We analyze how successful employment and salary depend on the university, specialty and region
Hello, Habr!
In 2014, we, together with several ministries and departments, launched the monitoring of the employment of Russian universities, the results of which were published in 2015 on the portal http://graduate.edu.ru/ .
Monitoring was conducted among graduates of 2013 (they had enough time to find a job). Now we are working on monitoring the graduates of 2014 and we decided to tell you about the goals and results of last year's project. If you are interested to know how the size of the salary and success of employment depends on the university, specialty and region, welcome under cat.
In the first part of the article we will talk about the goals, methods of monitoring and baseline data. If you are only interested in the results, you can immediately go to the section of the same name.
goal
The purpose of monitoring is to assess the employment of graduates in the following sections:
- University;
- Specialty (training direction);
- Geography of employment.
In this case, two main parameters were evaluated:
- Employment share (how many percent of graduates could find work);
- The level of average wages.
Such analytics is needed, for example, directly by the Ministry of Education and Science in order to evaluate the effectiveness of universities. Employment of graduates is not the only, but important criterion for such an assessment. Secondly, the results may be useful to school graduates and their parents. About how to choose a school, recently wrote on Habré . It turns out that our information is relevant for those a little older, especially in the light of the upcoming introductory campaign.
Methodology
Generally speaking, research on this topic is not uncommon. Many universities have services that analyze the fate of graduates. Various media and online recruitment resources also like to please with such statistics. And that's great. But this study is fundamentally different from them in the following:
- Scale - almost all Russian universities participated in the monitoring. At the time of monitoring, there were data on 1,240,532 graduates of 2013 indicating the name, age, gender, specialty, qualification and other attributes that were not very interesting to us.
- Data Sources - PFR data on employment and wages were used.
- Visualization - Convenient and affordable presentation of the results on the portal http://graduate.edu.ru/ .
Monitoring consists of several stages:
0) At the “zero” stage, all universities are required to enter information about the issued diplomas into the federal IS FRDO . By the way, each graduate can check the availability of information on him in this registerfrdocheck.obrnadzor.gov.ru (while there is data on graduates only 2013-2014 and partially 2015). This service can be used by employers. If you have not found yourself there, we highly recommend writing to your university about this.
1) At the first stage, all universities were selected from the FRDO data (except for power, foreign and those whose founders are religious organizations).
2) At the second stage, Rosobrnadzor checks and processes the information received for each graduate (in the protected circuit of the FRDO). Data on students who continue their studies are excluded (we assume that if a person continues to study further, then this is a good reason not to look for work). All graduates must be correctly filled in: name, gender and date of birth, otherwise the FIU will not be able to identify them.
After that, the data is grouped into packages and transferred to the Pension Fund of Russia for processing. Each package corresponds to a unique combination of the following sections: university, specialty, qualification, gender. In fact, this is a group of graduates who graduated from the university in one specialty.
3) At the third stage, the Pension Fund of Russia determines whether the graduate was employed according to official data (at least one deduction to the Pension Fund was made during the year or open IP), as well as how much the average graduate earned during his work summing up these data in the context each package.
4) The FIU transmits data on employment and the level of wages for each group, i.e. in an anonymous form (it’s impossible to understand exactly how much your former classmate receives).
All these data are analyzed and uploaded to the Portal.
For those who are confused, the procedure is shown in a separate figure:

Fig. 1
Based on the data obtained from the FIU, two main indicators are calculated:
- Employment share. This is the ratio of the number of employed graduates to the total number of university graduates minus “erroneous” and not found FIUs.
The final formula will look like this: where
where
Ktd is the number of employed graduates,
Ko is the total number of graduates selected at stages 1 and 2,
Kosh is the number of graduates with incorrect data, for example, an empty date of birth,
Khnffr is the number of graduates who could not be unambiguously identified PFR (full namesake by name, gender and date of birth)
Cinema - the number of graduates - citizens of foreign countries (applicable only to the university and more general sections - type of university, region of the university, etc.).
The value of Ko-Kosh for convenience will be called "the number of eligible for processing."
When calculating the share of employment as a whole for a university or region, foreign students are also deducted (for them, it is not entirely correct to use data from the domestic FIU). In the context of specialties, such data in this monitoring could not be collected, therefore, for them the share of employment is calculated without deducting foreigners. - The level of average wages. In fact, this is not only wages. This is all the money officially earned by the graduate (salaries, bonuses, etc.) for the entire calendar year following the year of graduation (that is, payments for the entire 2014 were analyzed for graduates of 2013).
The average salary is considered as this total income divided by the number of months the graduate worked in 2014.
Features of the methodology
Obviously, such a technique (like any other) has both pros and cons.
Cons are obvious:
- Only official employment is taken into account (if a graduate became a freelancer, but did not apply for an IP, then he will be considered unemployed);
- Only official incomes are taken into account (part-time jobs and gray salaries will not fall into the FIU data);
- The fact of compliance of the graduate specialty and the sphere of employment is not monitored (a joke about the humanities and McDonalds).
All these disadvantages are quite difficult to eliminate if we restrict ourselves to official data sources. Theoretically, you can try to get them using questionnaires / surveys, etc. But, firstly, it will bring its distortions to the data (on the topic of respondents distorting their income level, more than one hundred articles have been written), and secondly, on a Russian scale, to get a representative sample for all relevant sections, this would be comparable to a mini-census population.
Fortunately, cons are both pluses. The main advantage of the methodology is that the sample is almost continuous (minus the graduates who continued their education and the data provided with errors). This means that the error of representativeness is minimized, since we work almost directly with the general population.
Unfortunately, this was the first monitoring project and it did not take into account some factors: the form of training (full-time / part-time), the first or second higher, the form of payment. All this is taken into account in the monitoring of graduates in 2014, which is now in full swing.
Input data
Total universities involved in the monitoring - 933 (excluding branches):
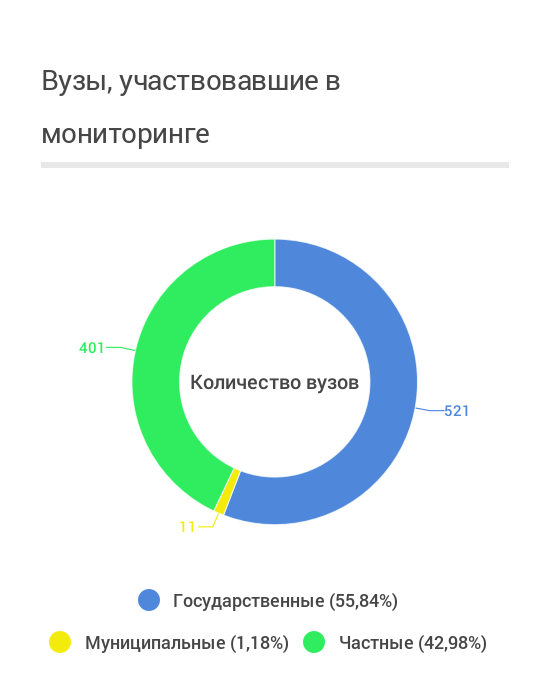
Fig. 2 ( interactive )
Not all of them passed the correct data (for various reasons, “private traders” basically could not cope with this):
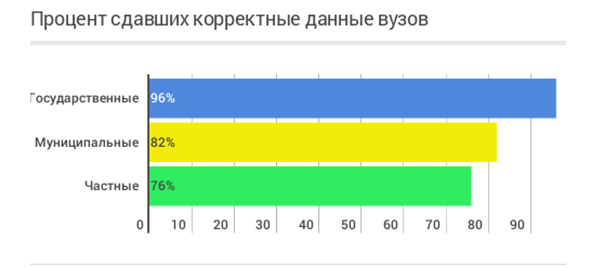
Fig. 3 ( interactive ) In
total, we got 819 universities that provided data on 1,240,532 graduates:
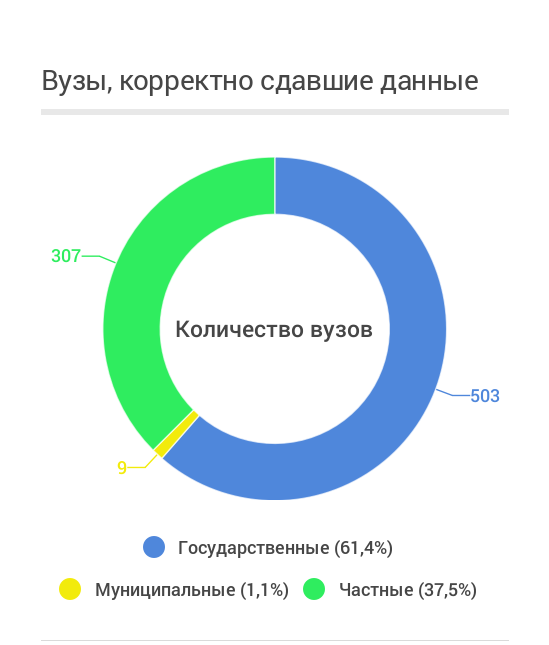
Fig. 4 ( interactive )
Let's see how graduates are distributed by type of university (the number of graduates will be considered taking into account branches, unless otherwise indicated):
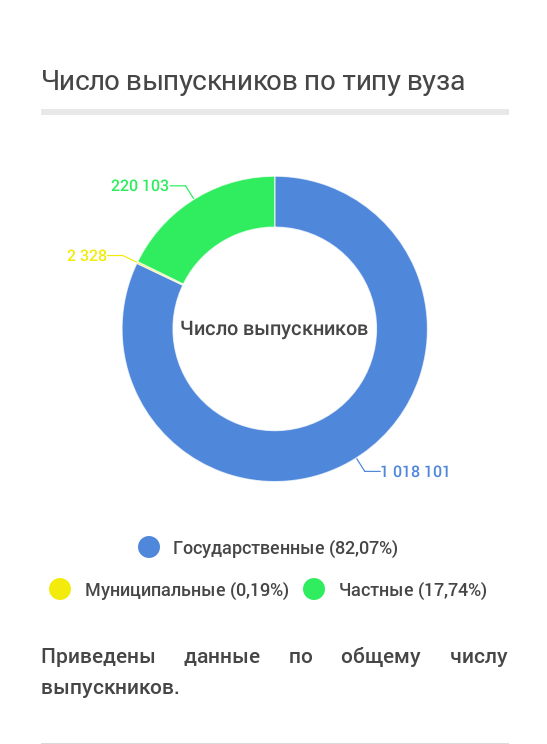
Fig. 5 ( interactive )
As you can see, the percentages compared to Figure 4 are already different. But this is quite logical - there are many large universities among state universities and much fewer among private ones.
Each graduate studied in a direction related to one of the enlarged groups of areas of training (specialties), in abbreviated form - UGS. For example, "mechanical engineering", "economics and management", etc. There are more than 50 such UGSs. In order not to give such a “sheet” here (we will look at it later), we will group the data by UGS type. The classification is rather arbitrary, but just such a breakdown is present in various legal acts in Russia.

Fig. 6 ( interactive )
In fact, economics and jurisprudence are included in the “sciences of society”, but their indicators were so great (35% of all graduates are “economists”) that they had to be distinguished into separate categories.
About 3% of graduates continued their education, another 0.4% of the data turned out to be incorrect (mostly incorrect or unfilled birth dates), and 1,198,276 people have already gone into processing. Their data served as the basis for the results described below.
results
Considering the volume of the data array, its analysis can be performed for a huge number of sections and many hypotheses can be checked on its basis. Therefore, here we present only some analysis results. This is only a small part of what can be obtained by studying monitoring data.
For those who want to independently work with the data (or just look at their own university) - detailed results for all universities can be seen on our portal. There, after registration (but without SMS), you can download this data in Excel format:
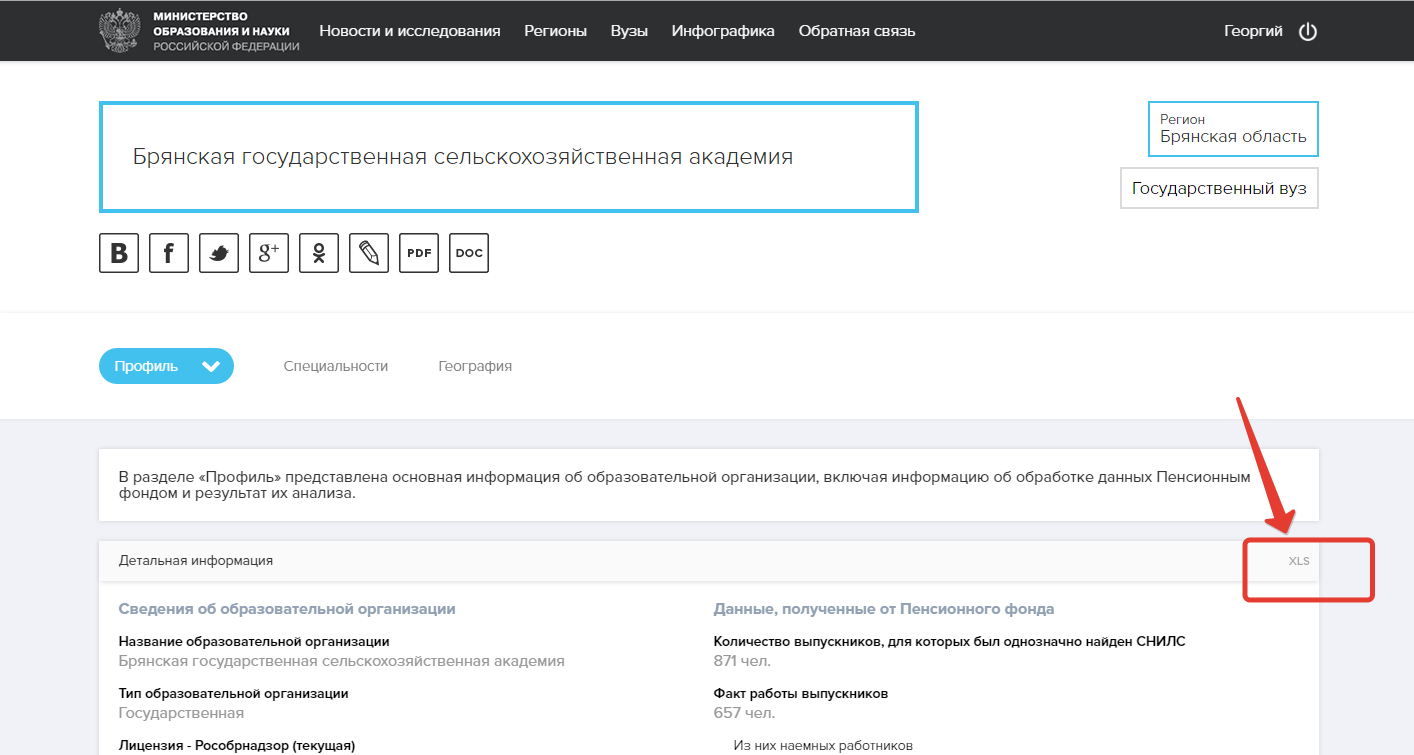
Fig. 7
In this article we will not consider data in the context of universities - information on them is on the portal, and there is not enough room for such an analysis. We will only say that in the first places there are small and not the most famous universities. There is nothing strange about this: the smaller the university, the more likely it is to show an indicator that deviates strongly from average values.
Before proceeding to a direct presentation of the results, a small remark for those who rarely deal with statistics. In the general case, when it comes to statistical laws, we cannot talk about what is the cause and what is the consequence. If the graduates of the prestigious NN university have good incomes and easily find work, this does not mean that the merit of the university is necessarily in this. Many talented and capable students are entering prestigious universities, it is likely that they would have reached the same or even greater heights while studying at another university. The answer to such questions is the topic of a separate large study.
Analysis results
To begin with, let's look at the result of employment and wages by type of university:
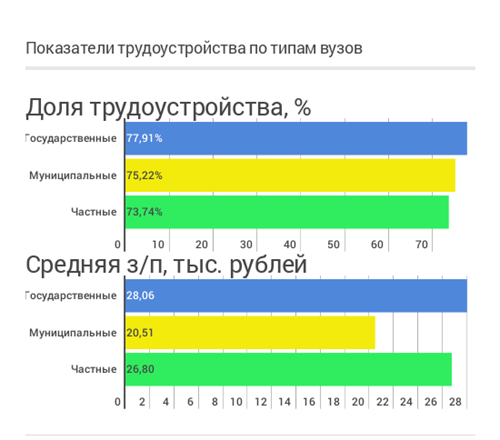
Fig. 8 ( interactive )
In part, the expected result: according to statistics, from the point of view of employment, it is better to study in state universities than in the conventional “Natalya Nesterova Academy” (no offense to graduates of this university).
However, this does not affect much the level of wages. But municipal universities are sagging. Perhaps because all of them are concentrated in regions where the level of salaries is lower than in Moscow or St. Petersburg.
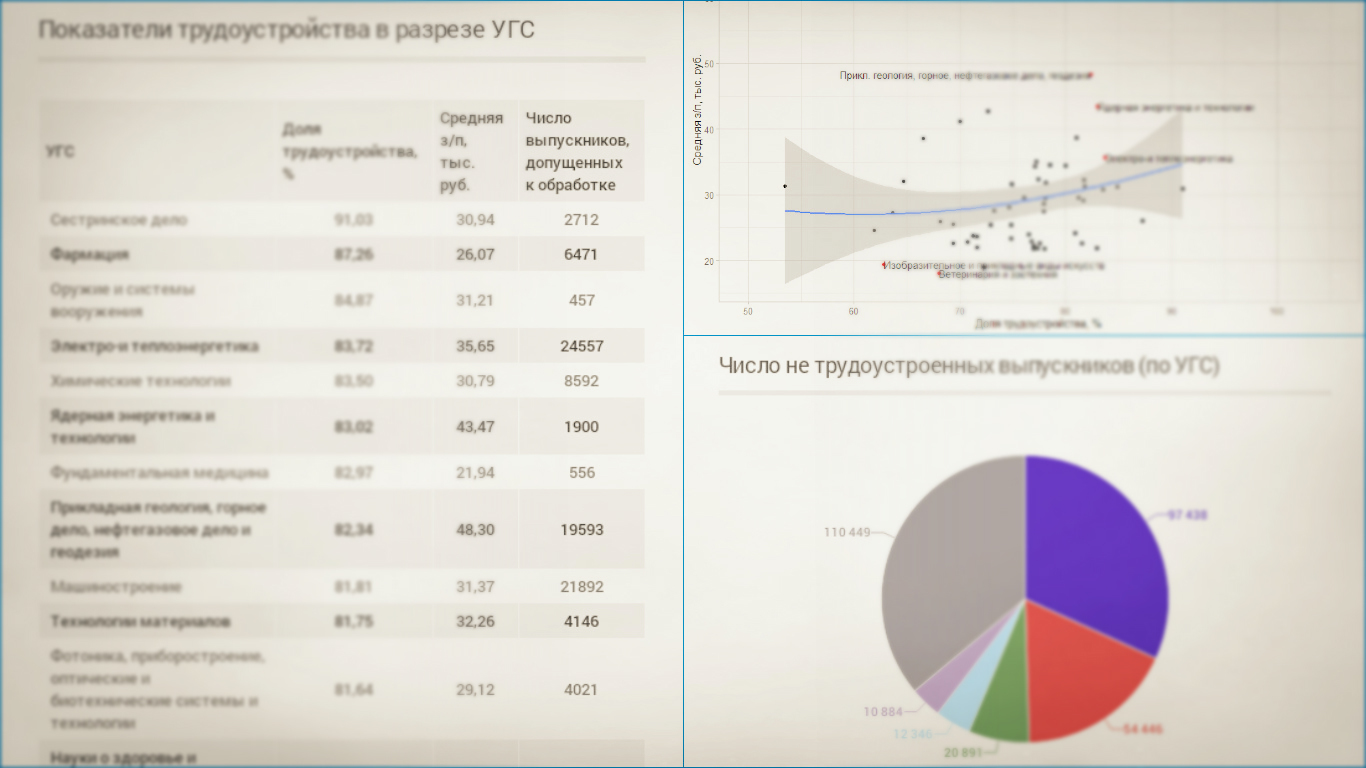
Now we give the same graph, but in the context of specialties (more precisely, "UGS" - enlarged groups of specialties):
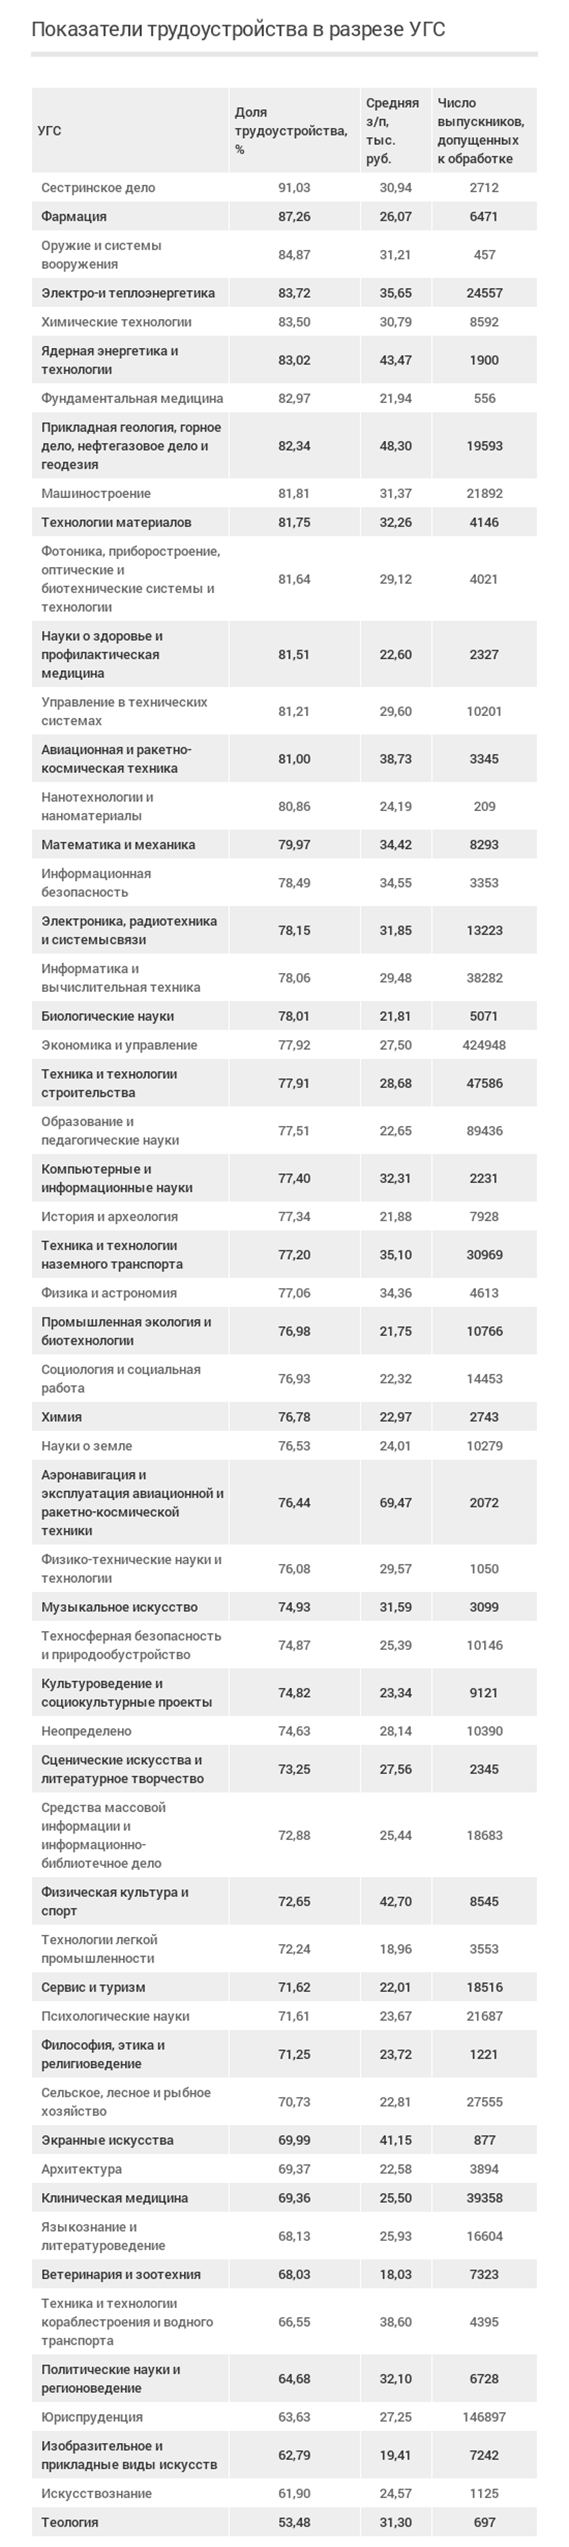
Fig. 9 ( interactive )
The table shows a column with the number of graduates for each UHS, so that you can estimate the number of employed students not only in percent, but also in absolute numbers.
As you remember, out of competition in the number of graduates, economic and managerial specialties. The three leaders also include educators and lawyers. At the same time, if economics and pedagogy still hold in the middle of the “standings” in terms of employment, then jurisprudence is an unequivocal outsider. If you look at the absolute numbers, then about half of all unemployed graduates are lawyers and economists:

Fig. 10 ( interactive )
At the same time, the differences in job search results between the representatives of these two specialties and the rest of the graduates are statistically significant (

Please note that the technical, medical and natural sciences are the leaders in terms of employment. Among the lagging ones are mainly “humanities” and creative professions.
The following specialties are leading in terms of salary :
- Air navigation and operation of aviation and rocket and space technology - 69,470 rubles.
This is not surprising given the salary of civil aviation pilots in Russia. - Applied geology, mining, oil and gas and geodesy - 48,290 rubles.
Given the current situation, it will be interesting to look at this industry in the dynamics of the next years. - Nuclear energy and technology - 43,460 rubles.
But this is a pleasant surprise. - Physical education and sport - 42 700 rubles.
It is unlikely that children's coaches and other specialists in this field receive high salaries, but in order to raise the average value, a small number of professional soccer players / hockey players who receive fabulous fees are enough. - Screen arts - 41,150 rubles.
Most likely, the situation is similar to that described in the previous paragraph.
It will be interesting to look at specialties at the same time both in terms of the share of employment and in terms of wages. That is, to identify "twice the best" and "twice the worst." To do this, we select the UGS for which the average salary and the level of employment will be lower (for the "worst") or higher (for the "best") of the 15th and 85th percentiles of the distribution of these values, respectively. Such a division is conditional, but for clarity, we restrict ourselves to it (a more detailed analysis can be carried out using the above table and portal data).
In the following figure, the “worst” and “best” specialties are highlighted in red and signed:
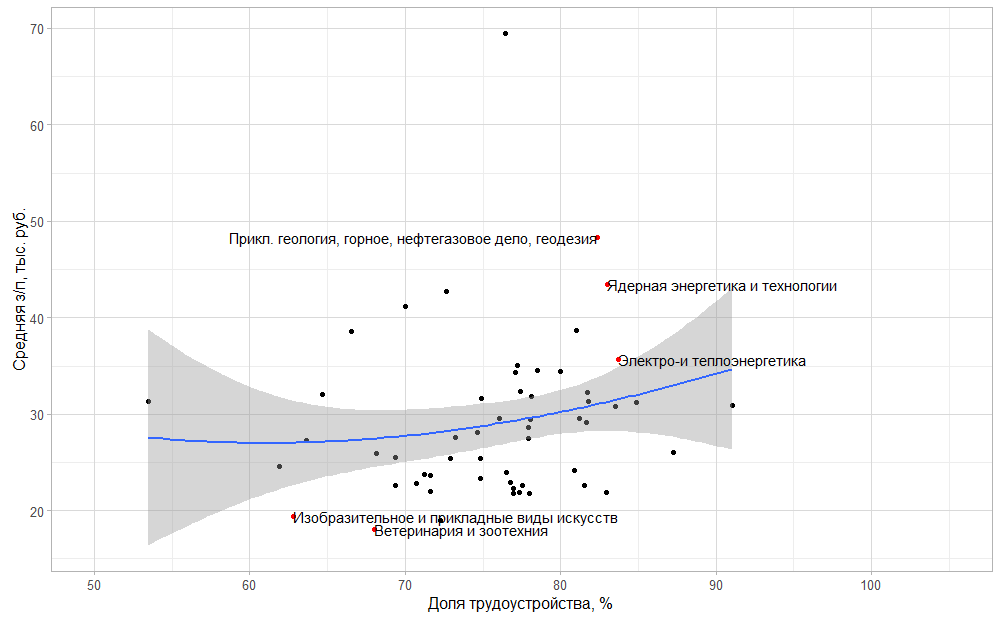
Fig. 11
So if you are an applicant and after graduation do not want to have problems with employment and salary, go to nuclear physicists :-)
Let's move on to another important indicator - geography.
Universities of which regions have the best employment rates? For convenience, we will take into account only the parent organizations, since in the general case it is unclear whose university the Vladivostok branch of a Moscow university is considered to be Moscow or, nevertheless, the Far East. Accounting for the geography of branches is the topic of a separate article.

Fig. 12 ( interactive )
As you can see, the biggest problems with employment rates are mainly among universities in the North Caucasus. If you look at the list of university regions with the worst employment rates in the Russian Federation, we will see this again:
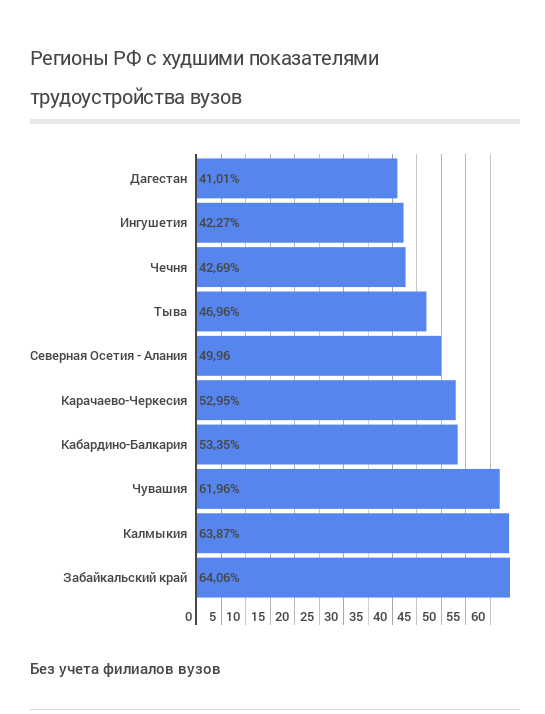
Fig. 13 ( interactive )
It is worth noting the high unemployment rate in these regions. According to the Federal State Statistics Service, in the North Caucasus Federal District it is twice as high as the national average. But it is impossible to say unequivocally what is the cause and what is the consequence. Unemployment can be caused by a small number of vacant jobs, or it may be due to the low quality of specialists or the reluctance of residents of the regions to get a (official) job.
Since we are talking about geography, we want to touch on the topic of labor migration. More detailed data on the migration of graduates of a university or region, including the salary levels of those who have left / left, can be viewed on the portal in the list of regions http://graduate.edu.ru/registry#/?slice=6 .
Take a look at the map, which shows the percentage of graduates who have left the region (relative to the total number of employed graduates from this region). This time, the branches participate - we consider their graduates as graduates of the region where the branch is physically located:
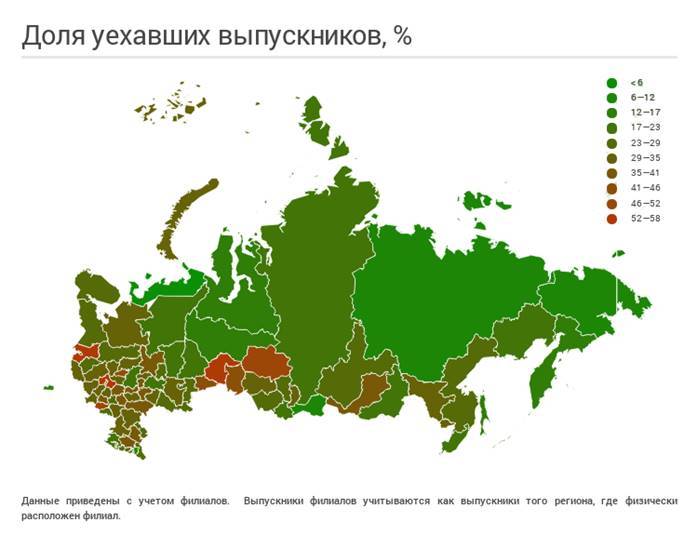
Fig. 14 ( interactive )
To find out the specific reasons for the high outflow of graduates, it is necessary to analyze each region separately. For many neighboring regions, the situation is similar: graduates are leaving en masse from the “issuing” region to the neighboring one. Perhaps this is simply the return of graduates home after graduation. Or maybe the neighboring region is just the closest, in which it is easy to find a good job. For example, from the Tomsk regionmany leave for neighboring Novosibirsk and Kemerovo. A similar situation with the Tyumen region and Khanty-Mansi Autonomous Okrug.
In Moscow, the proportion of graduates who left was unexpectedly high. Moreover, 18 thousand left in the suburbs:
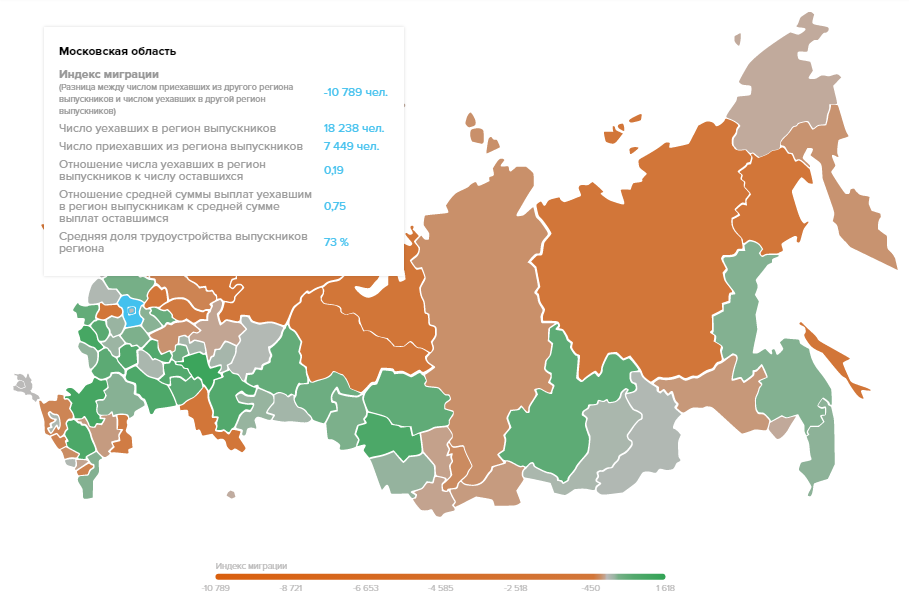
Fig. 15 ( interactive )
This is due to legal formalities. Many branches of Moscow universities at the end of training transfer their students to the “parent” organization. So a person living and working in the region receives a diploma as a graduate of a Moscow university, and not a branch.
And here is Kurskayathe region reflects the all-Russian trend - its graduates leave mainly for Moscow (in total about half of the graduates leave). We suspect this is due to the difference in the level of salaries - for those who work in Moscow it is 2 times higher than for the remaining. In general, in almost half of the regions of Russia, the most popular destination for graduate departure is Moscow and the Moscow Region.
Instead of a conclusion
We talked about only a small part of the data obtained and studied during monitoring. But at this time it is time to round off - the article was not so small anyway. We hope you were interested in learning about the project and some of its results. If it is interesting, SAnatoly can talk about the start and methodology of the project, and vpodolskiy about the architecture and the formation of packages for FIUs.
It should be remembered that such monitoring is not the only way to assess the effectiveness of universities and has a number of limitations and assumptions. Despite this, the results of the project provide enough food for thought and, possibly, help applicants with the choice of a profession or university.
We are waiting for everyone who is interested in this post on the portal - and just curious, and specialists in the field of education, and those who would like to independently analyze the data.