In search of perfect monitoring
In this short article I would like to talk about the monitoring tools used to analyze the work of our bank DWH. The article will be of interest to everyone who is not satisfied with the existing ready-made monitoring systems and who were visited by thoughts to assemble one for themselves from separate pieces. Much attention is paid in the article to the Grafana dashboard, which, in my opinion, is undeservedly deprived of attention on Habré. For most components of the monitoring system, the installation process (under RedHat) will be briefly reviewed.

Warm tube dashboards
Problem Statement
At first glance, the task is quite simple and banal: to have a means by which with as few movements as possible in a minimum amount of time it is possible to fully assess the status of all storage systems, and also be able to notify individual interested parties about an event. However, it is worth briefly telling about the features of systems that need supervision:
The choice of existing
Of course, the first thing I looked at already existing systems: Nagios, Zabbix (to a greater extent), Munin. Each of them is good in its own way, each has its own fields of application. On Habré there is enough information about each of the listed systems, therefore I will list only some reasons by which we abandoned the finished system in principle:
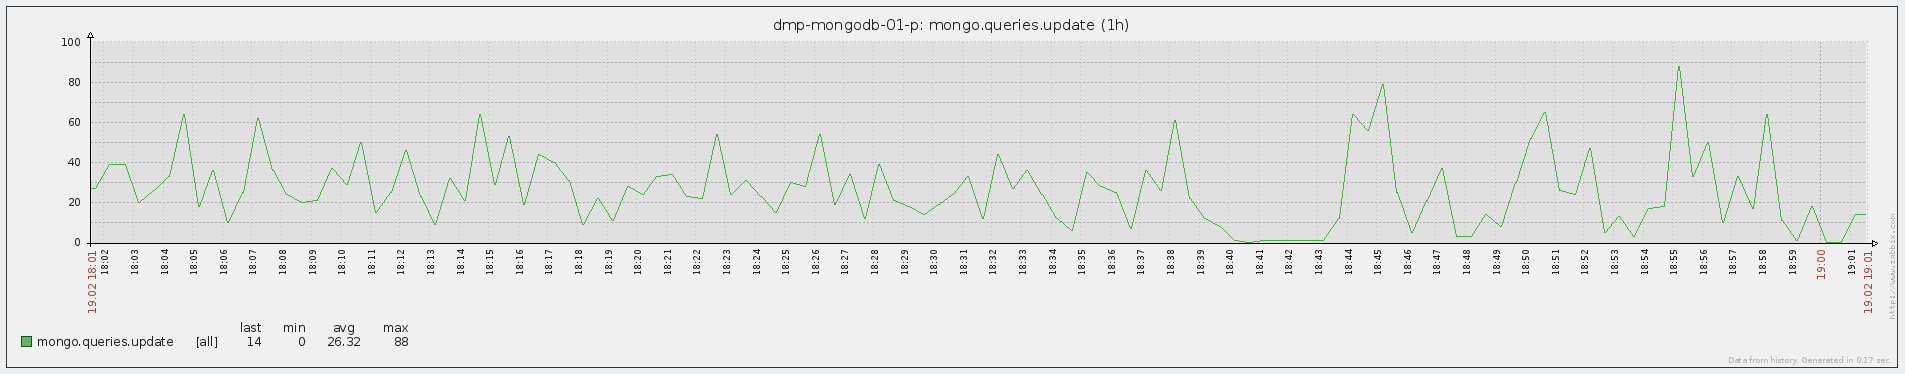
Fig. 1 Chart in Zabbix. In all the reviewed ready-made systems, there are very few opportunities for working with charts.
Also, in case we want to plot a certain function of the metric (for example, a derivative or an exponent), the value of the function will have to be calculated on the side of the self-written daemon sending the data.
In addition, Zabbix and Nagios are used in the bank for lower-level monitoring (state of iron), and there was some experience with their use. In short - all the fibers of the soul felt that this was not what we needed.
Graphite
So, in the process of finding a system capable of beautifully and intelligibly visualizing such a diverse set of metrics, Graphite was discovered. The first impressions of the descriptions were only positive, plus a significant contribution to the decision to deploy a test installation was made by Yandex lecture , in which the guys solved a fairly similar problem. So we got Graphite started.
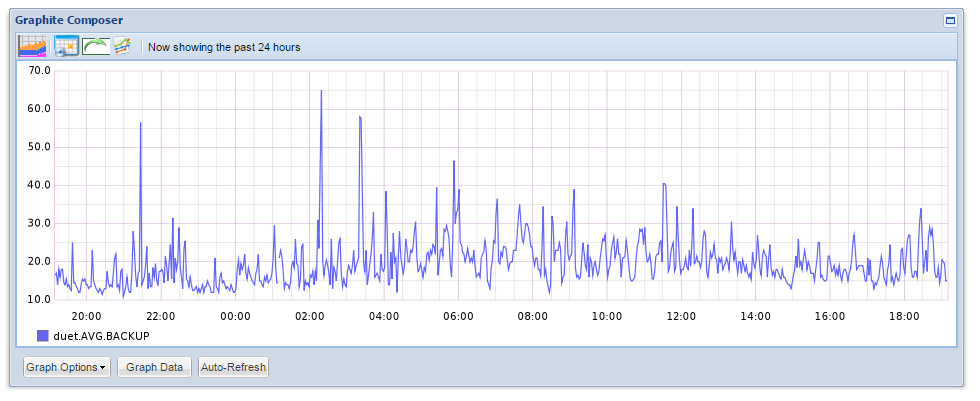
Fig. 2 Graph in Graphite
Graphite is nothing more than a system for online charting. Simplified - it simply takes the metric over the network and puts an end to the graph, which you can subsequently access in one way or another. Metrics are sent in the format "Folder1.Folder2.Metric_Name Metric_Value Temporary_Market". For example, the simplest sending of the Test metric, which is located in the Folder directory and currently has a value of 1, from bash will look something like this:
Simple, right?
Architecturally, Graphite consists of three components:
What Graphite liked:
What disappointed:
Grafana
So, for some time we worked with graphite. There was a test and product installation, metric references were added to Duet’s control code, daemons were written to monitor Greenplum status, and an application was written to count and send Attunity latency to Graphite. There was a certain visual representation of the operation of systems, for example, a major problem was identified by Duet’s historical work schedules. Alerts were implemented by third-party code (bash, sas).
But there is no limit to perfection, and after some time we wanted more - so we went to the grafana.
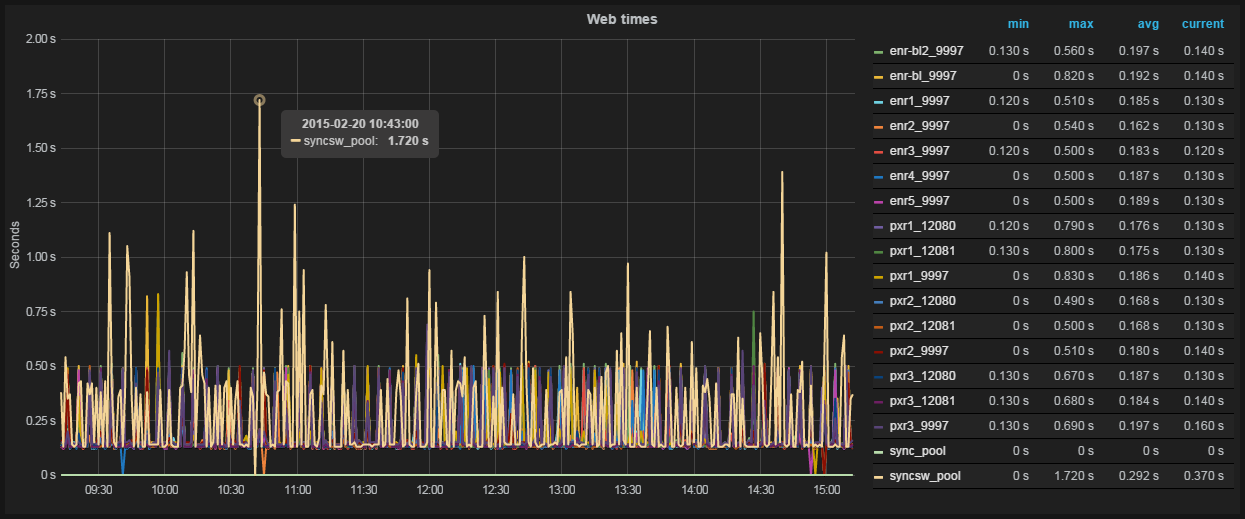
Fig. 3 Graph and table of values in Grafana
Grafana is a chart and dashboard editor based on data from Graphite, InfluxDB or OpenTSDB, specializing in the display and analysis of information. It is lightweight, relatively easy to install, and most importantly, it is incredibly beautiful. On board:
Functionally, a graphan is a set of user dashboards, divided into lines of user-defined height, at which, in turn, you can create functional elements (graphs, html inserts and trigger plates). Lines can be moved, renamed and generally mocked at them in every way.
Naturally, the main functional elements of the dashboard are graphics. Creating a new metric graph in Grafan absolutely does not require any special knowledge - everything is done easily and clearly:
1. Metrics from Graphite are added to the graph - everything happens in the GUI, you can specify all metrics in a specific folder, etc. ;
2. If necessary, functions are applied to the metrics that apply to the metrics before they are displayed. In addition to simple and often used ones (scale, average, percentiles ...), there are more interesting ones - for example, using the aliasByNode () function, a graphan herself can determine exactly what metrics should be called on graphs. A simple example, there are two metrics:
Servers.ServerA.cpu
Servers.ServerB.cpu
By default, the metrics will be called the same - cpu. If you use the above function, ServerA and ServerB will be displayed on the chart;
3. We edit the axis (there is auto-scaling of most popular quantities - time, file size, speed), the name of the graph;
4. Adjust the display style (filling, line / columns, summing up metrics, table with values, etc.);
The schedule is ready. Optionally, add html content to the dashboard and simple trigger dice (snap to one metric, change the color of the dice or text on it if the metric is beyond the given boundaries).
Thus, it is possible in almost all details to customize the display of any data.
Grafan's Benefits:
Disadvantages:
By the way, in the version of grafana 2.0 it is planned to add both authorization and notifications.
Diamond
Well, you say, we learned how to send metrics from the systems we need and display them on the graph as we need - but if, in addition to our super-unique metrics, we also want to see such values as cpu usage that are close to any Zabbix / Nagios administrator and user , iops, network usage - for each such metric, you also have to write your own daemon in bash and stuff it into cron ?! Of course not, because there is a Diamond .
Diamond is a python daemon that collects and sends system information to graphite and several other systems. Functionally, it consists of collectors - individual parser daemons that extract information from the system. In fact, collectors cover the entire spectrum of objects for monitoring - from cpu to mongoDB.
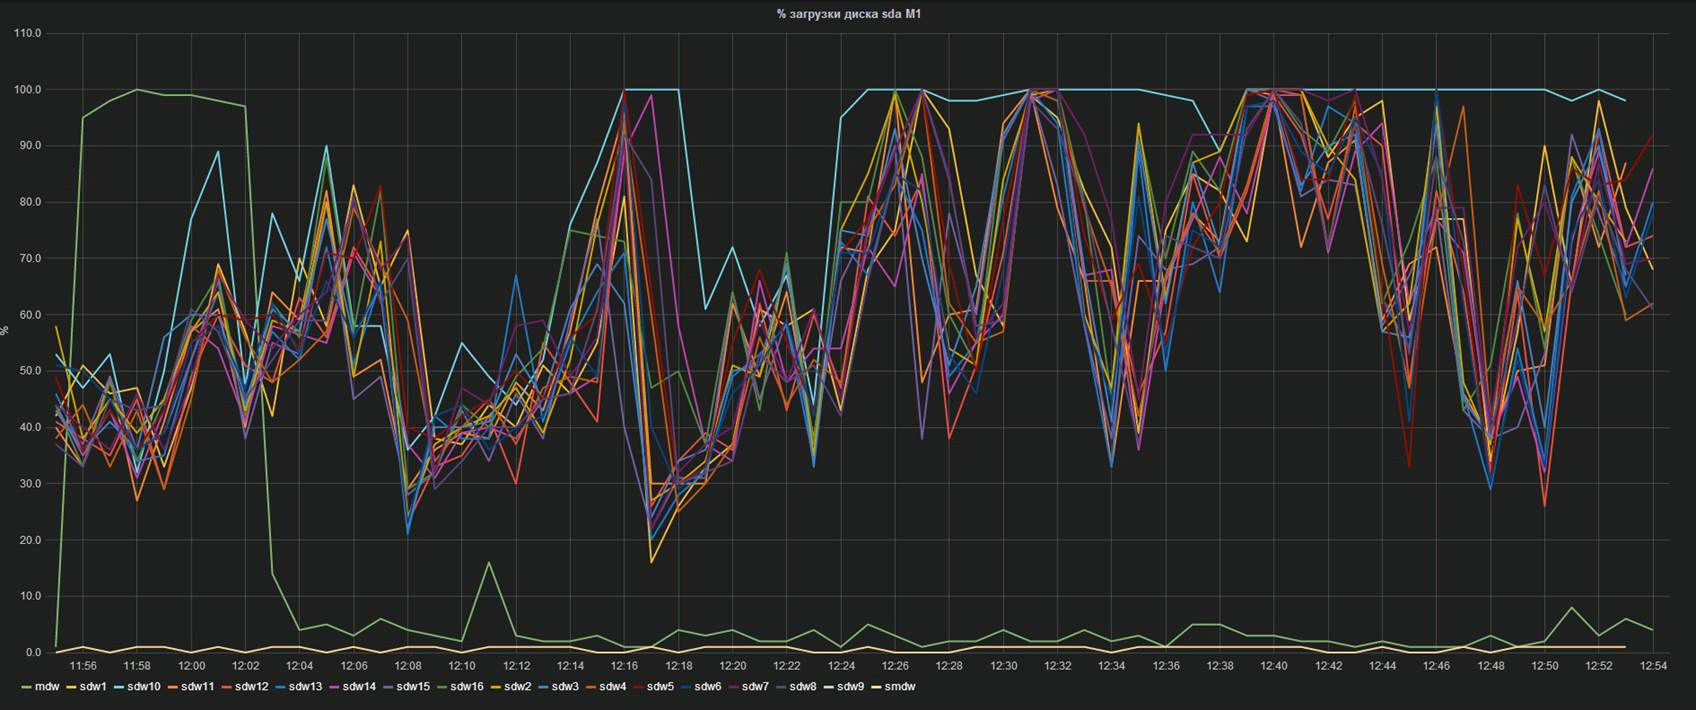
Fig. 4 The performance of one of the segment servers is knocked out of the general heap
Here, each line is the% of the controller load on one of the database segment servers. It can be seen that the segment named sdw10, with equal IOPS (visible on the adjacent chart), is loaded much more heavily. Knowing this feature allowed us, firstly, to prepare in advance for a replacement, and secondly, to begin negotiations with the vendor about a possible early replacement of disks upon the fact of a performance drawdown.
Seyren
So, the main problem - visualization and data acquisition - is solved. We have beautiful, flexible dashboards with current and historical information, we can send metrics from various systems and easily add new system indicators. There is only one thing left - to learn to notify interested parties about an event. Here Seyren comes to the rescue.- A small and very simple dashboard that can notify users in one way or another when one of their metrics goes into a new state. In practice, this means the following: the user creates a check on a specific metric from Graphite and sets two limits in it - WARN and ERROR levels. Then it adds subscribers, indicates the channel through which they need to be notified (Email, Flowdock, HipChat, HTTP, Hubot, IRCcat, PagerDuty, Pushover, SLF4J, Slack, SNMP, Twilio) and the notification schedule (for example, notify only on weekdays).
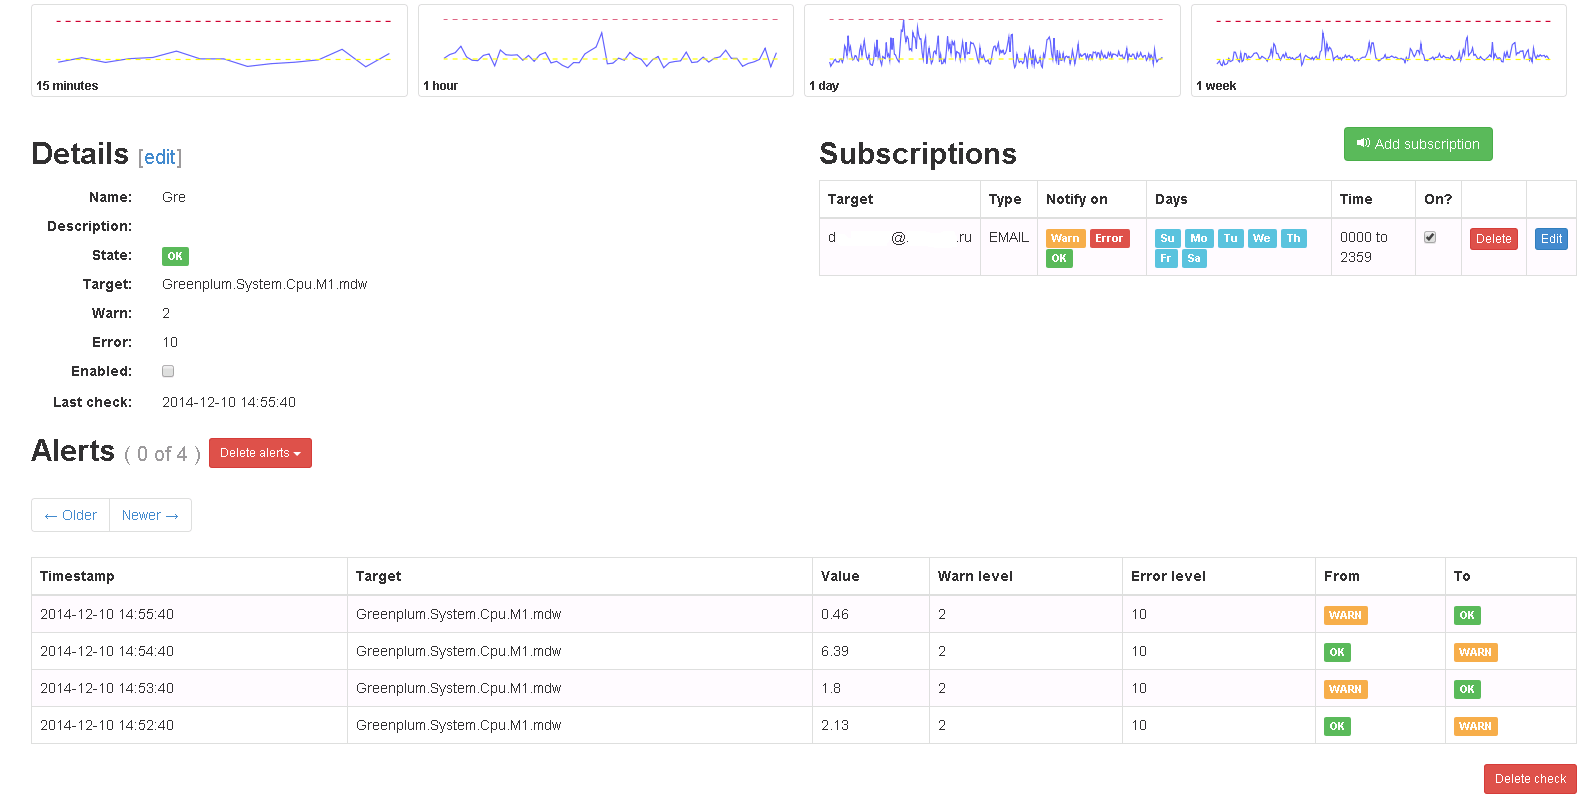
Fig. 5 Check in Seyren
In the future, when the metric reaches one of the limits, alerts are sent indicating criticality. When a metric returns to its previous state, the same thing happens.
It is necessary to note one not obvious point: for Seyren to pick up a metric from Graphite, you must completely, case-sensitive, enter its name when creating the check.
As you can see, the alerts are quite simple and only respond to a linear change in the metric - this is enough in our case. Using Seyren, it’s not possible to create an alert that, for example, responds to a change in the average value over the past half hour. For those who need checks of this kind, I recommend paying attention to Cabot - a complete analog of Seyren, which has the ability to create checks on the result of applying functions to Graphite metrics. Cabot is distributed as an instance for AWS or DigitalOcean, it also describes how to perform a bare-metal installation on CentOS.
Conclusion
In total, at the exit we have an almost ready-made monitoring system that in many respects surpasses the existing "whole" solutions. In addition, the integration of new services in such a system will be much more flexible (although in some ways, maybe more time-consuming), and the extensibility, taking into account the number of software working with Graphite, is almost unlimited.
Links
Graphite
Graphite - how to build a million graphs - post from Yet another conference 2013
Grafana
Diamond
Seyren
Cabot Cabot
Installation Instructions on CentOS
Our article on disaster recovery for Greenplum
Our article on Attunity CDC
Warm tube dashboards
Problem Statement
At first glance, the task is quite simple and banal: to have a means by which with as few movements as possible in a minimum amount of time it is possible to fully assess the status of all storage systems, and also be able to notify individual interested parties about an event. However, it is worth briefly telling about the features of systems that need supervision:
- MPP RDBMS Greenplum - 4 clusters of 10-18 (depending on the destination) machines in each. Of all the machines in the cluster, only two machines (master and standby-master) have access to an external network, the rest are only in an internal isolated interconnect network;
- Dual-ETL (Duet) - more details about this project can be found in the next article . From the point of view of monitoring, the project is interesting in that the necessary metrics are generated in a large number of different environments: bash scripts, SAS code, Oracle database and Greenplum;
- Attunity CDC - Details can also be found in the next article . The key indicator of this system is latency, that is, the time elapsed between the appearance / change of a record in the source database (Oracle) and a similar event in the receiver (Greenplum);
- ETL processes and the hardware used in them - it is necessary to fully cover the processes of loading and converting data;
- 18 web services for various purposes - the easiest task. The customer wanted to have an idea of the response time of the service and the time of its availability;
- A few other simple metrics.
The choice of existing
Of course, the first thing I looked at already existing systems: Nagios, Zabbix (to a greater extent), Munin. Each of them is good in its own way, each has its own fields of application. On Habré there is enough information about each of the listed systems, therefore I will list only some reasons by which we abandoned the finished system in principle:
- The metrics that we would like to monitor are rather "highly specialized", and with typical areas of application of finished systems (iron loading, network bandwidth, etc.) have little in common. This means that in any case, for each of the systems it would be necessary to write its own daemons sending data to the master system, and this breaks the whole concept of ready-made monitoring systems;
- The main purpose of such systems is to notify of problems, for us the main thing is to visualize the operation of the components, and the second task is to notify;
- Forgive the fans of the above systems, but they are ... ugly. They don’t want to open them on two monitors, select different display styles, calculate average, derivatives, print and discuss, scale and drag and drop, overlay graphs on each other and look for hidden meaning.
Fig. 1 Chart in Zabbix. In all the reviewed ready-made systems, there are very few opportunities for working with charts.
Also, in case we want to plot a certain function of the metric (for example, a derivative or an exponent), the value of the function will have to be calculated on the side of the self-written daemon sending the data.
In addition, Zabbix and Nagios are used in the bank for lower-level monitoring (state of iron), and there was some experience with their use. In short - all the fibers of the soul felt that this was not what we needed.
Graphite
So, in the process of finding a system capable of beautifully and intelligibly visualizing such a diverse set of metrics, Graphite was discovered. The first impressions of the descriptions were only positive, plus a significant contribution to the decision to deploy a test installation was made by Yandex lecture , in which the guys solved a fairly similar problem. So we got Graphite started.
Fig. 2 Graph in Graphite
Graphite is nothing more than a system for online charting. Simplified - it simply takes the metric over the network and puts an end to the graph, which you can subsequently access in one way or another. Metrics are sent in the format "Folder1.Folder2.Metric_Name Metric_Value Temporary_Market". For example, the simplest sending of the Test metric, which is located in the Folder directory and currently has a value of 1, from bash will look something like this:
echo "Folder.Test 1 $(date +%s)" |nc graphite_host 2003Simple, right?
Architecturally, Graphite consists of three components:
- Graphite-Web, Django web-shell, which is also a graph renderer, also uses mysql in its work;
- Carbon, a daemon for receiving, caching, and writing Whisper incoming metrics;
- Whisper, a file database for storing historical metrics data. Thus, metrics are stored in separate files - by file per metric, which allows you to manage these metrics quite conveniently (transfer between installations, delete, etc.)
What Graphite liked:
- all graphs in one place, sorted by folders at the discretion of the user, and not by the name of the servers or server groups (hello Zabbix);
- the time stamp for each metric is set arbitrarily, that is, points on the graph can be set both in the past and in the future tense - this is important in some components of the repository;
- functions can be superimposed on chart data;
- some nice graphic buns - filling, displaying columns and more;
- slightly more convenient scaling.
What disappointed:
- rather meager opportunities for creating a dashboard;
- in many nuances, lack of interactivity;
- there is no alert functionality in principle;
- there is no way to see the table of metric values.
Install Graphite
#
#Прошу учесть, что здесь и далее при изменении конфигов приведены не полные конфиги, а только блоки, нуждающиеся в редактировании
#
#Graphite использует для своих нужд mysql – в данном случае она ставится на тот же хост, что и сам Graphite
yum --nogpgcheck install graphite-web graphite-web-selinux mysql mysql-server MySQL-python python-carbon python-whisper
service mysqld start
/usr/bin/mysql_secure_installation
#говорим графиту, как именно ему надо ходить в mysql - редактируем /etc/graphite-web/local_settings.py:
DATABASES = {
'default': {
'NAME': 'graphite',
'ENGINE': 'django.db.backends.mysql',
'USER': 'graphite',
'PASSWORD': 'your_pass',
'HOST': 'localhost',
'PORT': '3306',
          }
}
mysql -e "CREATE USER 'graphite'@'localhost' IDENTIFIED BY 'your_pass';" -u root -p #создаём пользователя, указанного в конфиге выше
mysql -e "GRANT ALL PRIVILEGES ON graphite.* TO 'graphite'@'localhost';" -u root -p #даём пользователю права
mysql -e "CREATE DATABASE graphite;" -u root -p #создаём БД
mysql -e 'FLUSH PRIVILEGES;' -u root -p #применяем изменения
/usr/lib/python2.6/site-packages/graphite/manage.py syncdb
service carbon-cache start
service httpd start
#Идём на 80-й порт и наблюдаем девственный Graphite. По желанию в файле /etc/carbon/storage-schemas.conf можно настроить динамический интервал хранения метрик (хранить меньше (реже) старых точек и больше (чаще) новых)
Grafana
So, for some time we worked with graphite. There was a test and product installation, metric references were added to Duet’s control code, daemons were written to monitor Greenplum status, and an application was written to count and send Attunity latency to Graphite. There was a certain visual representation of the operation of systems, for example, a major problem was identified by Duet’s historical work schedules. Alerts were implemented by third-party code (bash, sas).
But there is no limit to perfection, and after some time we wanted more - so we went to the grafana.
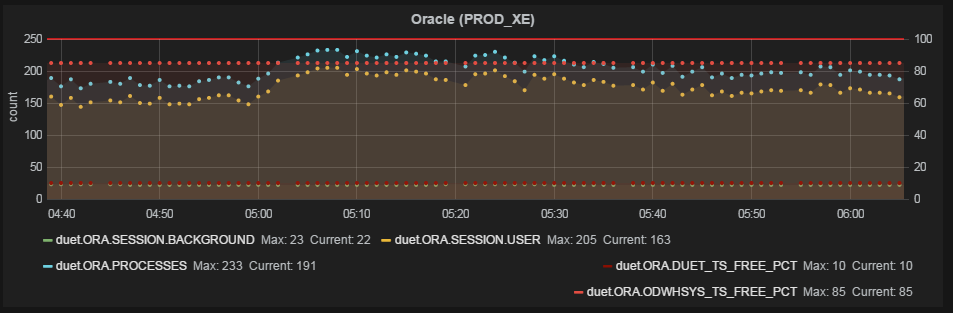
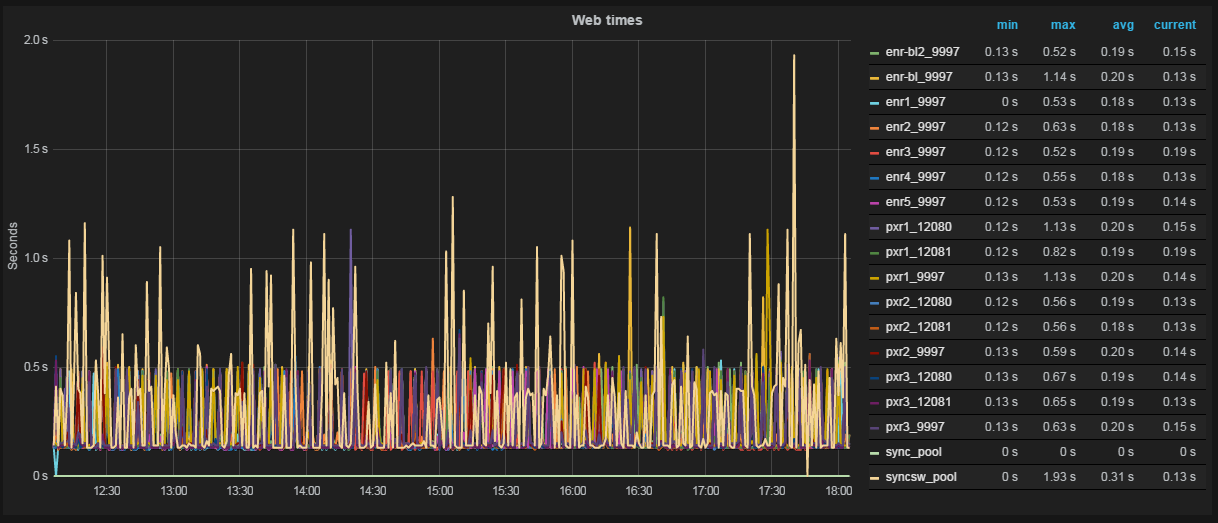
Fig. 3 Graph and table of values in Grafana
Grafana is a chart and dashboard editor based on data from Graphite, InfluxDB or OpenTSDB, specializing in the display and analysis of information. It is lightweight, relatively easy to install, and most importantly, it is incredibly beautiful. On board:
- full dashboards with graphs, triggers, html-inserts and other goodies;
- scrolling, zooming and other -ing;
- Sortable value tables (min, max, avg, current, total);
- support for all graphite functions.
Functionally, a graphan is a set of user dashboards, divided into lines of user-defined height, at which, in turn, you can create functional elements (graphs, html inserts and trigger plates). Lines can be moved, renamed and generally mocked at them in every way.
Naturally, the main functional elements of the dashboard are graphics. Creating a new metric graph in Grafan absolutely does not require any special knowledge - everything is done easily and clearly:
1. Metrics from Graphite are added to the graph - everything happens in the GUI, you can specify all metrics in a specific folder, etc. ;
2. If necessary, functions are applied to the metrics that apply to the metrics before they are displayed. In addition to simple and often used ones (scale, average, percentiles ...), there are more interesting ones - for example, using the aliasByNode () function, a graphan herself can determine exactly what metrics should be called on graphs. A simple example, there are two metrics:
Servers.ServerA.cpu
Servers.ServerB.cpu
By default, the metrics will be called the same - cpu. If you use the above function, ServerA and ServerB will be displayed on the chart;
3. We edit the axis (there is auto-scaling of most popular quantities - time, file size, speed), the name of the graph;
4. Adjust the display style (filling, line / columns, summing up metrics, table with values, etc.);
A few examples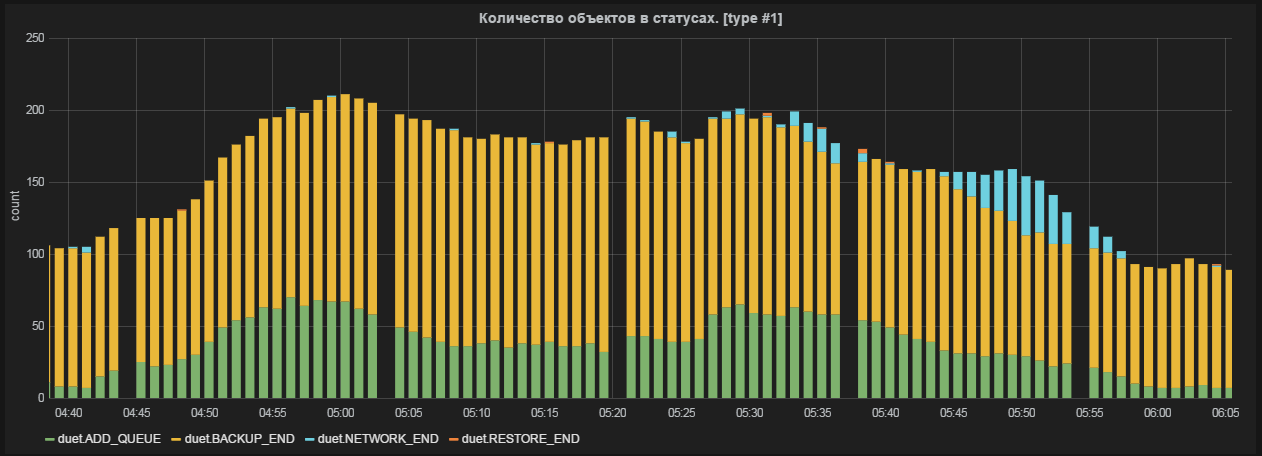

The schedule is ready. Optionally, add html content to the dashboard and simple trigger dice (snap to one metric, change the color of the dice or text on it if the metric is beyond the given boundaries).
Thus, it is possible in almost all details to customize the display of any data.
Grafan's Benefits:
- flexibility - everything and everything is configured;
- usability - it is as comfortable as it is beautiful;
- Before displaying a metric, you can apply mathematical / statistical functions to it;
- calculation of schedules occurs on the client side (although in some situations this can be attributed to disadvantages);
Disadvantages:
- no authorization - anyone can change your schedules and dashboards;
- no notifications;
By the way, in the version of grafana 2.0 it is planned to add both authorization and notifications.
Install grafana
#Скачать:
elasticsearch-1.1.1 #http://www.elasticsearch.org/downloads/1-1-1/
grafana-1.9.1.tar #http://grafana.org/download/, актуальная на момент написания статьи версия
nohup ./elasticsearch & #запускаем в фоне elasticsearch из папки, которую только что скачали
mkdir /opt/grafana
cp grafana-1.9.1/* /opt/grafana
cp config.sample.js config.js
vi  config.js
#для установки grafana на ту же машину, что и graphite, модифицируем блок:
graphite: {
type: 'graphite',
url: "http://"+window.location.hostname+":80",
default: true
},
vi /etc/httpd/conf.d/graphite-web.conf:
Header set Access-Control-Allow-Origin "*"
Header set Access-Control-Allow-Methods "GET, OPTIONS"
Header set Access-Control-Allow-Headers "origin, authorization, accept"
vi /etc/httpd/conf.d/grafana.conf:
Listen 8080

DocumentRoot /opt/grafana/

 service httpd restart
Diamond
Well, you say, we learned how to send metrics from the systems we need and display them on the graph as we need - but if, in addition to our super-unique metrics, we also want to see such values as cpu usage that are close to any Zabbix / Nagios administrator and user , iops, network usage - for each such metric, you also have to write your own daemon in bash and stuff it into cron ?! Of course not, because there is a Diamond .
Diamond is a python daemon that collects and sends system information to graphite and several other systems. Functionally, it consists of collectors - individual parser daemons that extract information from the system. In fact, collectors cover the entire spectrum of objects for monitoring - from cpu to mongoDB.
An impressive complete list of collectors
Each collector, in turn, processes and sends several metrics to the receiver system (in our case Graphite). For example, in the case of a network collector, as many as 18 metrics are sent for each network interface. Thus, in my monitoring system, it seems to me that the main functionality of Zabbix and Nagios is covered - adding new system metrics in one or two clicks. In particular, the small but vivid administration experience of Greenplum suggested that an extremely important parameter of the database operation is the load on the disk subsystem on the segment servers. A separate dashboard was created with graphs of iops,% load, await and service time of RAID controllers of segment servers (uses / proc / diskstats). A short observation revealed an interesting pattern: beforeAmavisCollector
ApcupsdCollector
BeanstalkdCollector
BindCollector
CPUCollector
CassandraJolokiaCollector
CelerymonCollector
CephCollector
CephStatsCollector
ChronydCollector
ConnTrackCollector
CpuAcctCgroupCollector
DRBDCollector
DarnerCollector
DiskSpaceCollector
DiskUsageCollector
DropwizardCollector
DseOpsCenterCollector
ElasticSearchCollector
ElbCollector
EndecaDgraphCollector
EntropyStatCollector
ExampleCollector
EximCollector
FilesCollector
FilestatCollector
FlumeCollector
GridEngineCollector
HAProxyCollector
HBaseCollector
HTTPJSONCollector
HadoopCollector
HttpCollector
HttpdCollector
IODriveSNMPCollector
IPCollector
IPMISensorCollector
IPVSCollector
IcingaStatsCollector
InterruptCollector
JCollectdCollector
JbossApiCollector
JolokiaCollector
KSMCollector
KVMCollector
KafkaCollector
LMSensorsCollector
LibvirtKVMCollector
LoadAverageCollector
MemcachedCollector
MemoryCgroupCollector
MemoryCollector
MemoryDockerCollector
MemoryLxcCollector
MongoDBCollector
MonitCollector
MountStatsCollector
MySQLCollector
MySQLPerfCollector
NagiosPerfdataCollector
NagiosStatsCollector
NetAppCollector
NetscalerSNMPCollector
NetworkCollector
NfsCollector
NfsdCollector
NginxCollector
NtpdCollector
NumaCollector
OneWireCollector
OpenLDAPCollector
OpenVPNCollector
OpenstackSwiftCollector
OpenstackSwiftReconCollector
OssecCollector
PassengerCollector
PgbouncerCollector
PhpFpmCollector
PingCollector
PostfixCollector
PostgresqlCollector
PostqueueCollector
PowerDNSCollector
ProcessResourcesCollector
ProcessStatCollector
PuppetAgentCollector
PuppetDBCollector
PuppetDashboardCollector
RabbitMQCollector
RedisCollector
ResqueWebCollector
S3BucketCollector
SNMPCollector
SNMPInterfaceCollector
SNMPRawCollector
ServerTechPDUCollector
SidekiqWebCollector
SlabInfoCollector
SmartCollector
SockstatCollector
SoftInterruptCollector
SolrCollector
SqsCollector
SquidCollector
SupervisordCollector
TCPCollector
TokuMXCollector
UDPCollector
UPSCollector
UnboundCollector
UptimeCollector
UserScriptsCollector
UsersCollector
VMSDomsCollector
VMSFSCollector
VMStatCollector
VarnishCollector
WebsiteMonitorCollector
XENCollector
ZookeeperCollector
Fig. 4 The performance of one of the segment servers is knocked out of the general heap
Here, each line is the% of the controller load on one of the database segment servers. It can be seen that the segment named sdw10, with equal IOPS (visible on the adjacent chart), is loaded much more heavily. Knowing this feature allowed us, firstly, to prepare in advance for a replacement, and secondly, to begin negotiations with the vendor about a possible early replacement of disks upon the fact of a performance drawdown.
Diamond setting
yum install build-essentials python-dev python python-devel psutil python-configobj
#Скачиваем https://github.com/python-diamond/Diamond, разархивируем, переходим в папку, затем
make install #собираем, ставим
cp /etc/diamond/diamond.conf.example /etc/diamond/diamond.conf #копируем пример конфига
vi /etc/diamond/diamond.conf #указываем хост и порт grahit'а, частоту отсылки метрик и префикс/постфикс названия метрик, чтобы в структуре папок graphite метрики лежали так, как нам хочется, остальное по желанию
#из /usr/share/diamond/collectors/ убираем ненужные коллекторы, оставляем те, от которых хотим получать метрики
diamond-setup #интерактивно настраиваем коллекторы, большинство можно оставить по умолчанию
/etc/init.d/diamond start #поехали
Seyren
So, the main problem - visualization and data acquisition - is solved. We have beautiful, flexible dashboards with current and historical information, we can send metrics from various systems and easily add new system indicators. There is only one thing left - to learn to notify interested parties about an event. Here Seyren comes to the rescue.- A small and very simple dashboard that can notify users in one way or another when one of their metrics goes into a new state. In practice, this means the following: the user creates a check on a specific metric from Graphite and sets two limits in it - WARN and ERROR levels. Then it adds subscribers, indicates the channel through which they need to be notified (Email, Flowdock, HipChat, HTTP, Hubot, IRCcat, PagerDuty, Pushover, SLF4J, Slack, SNMP, Twilio) and the notification schedule (for example, notify only on weekdays).
Fig. 5 Check in Seyren
In the future, when the metric reaches one of the limits, alerts are sent indicating criticality. When a metric returns to its previous state, the same thing happens.
It is necessary to note one not obvious point: for Seyren to pick up a metric from Graphite, you must completely, case-sensitive, enter its name when creating the check.
Install Seyren
#Для работы Seyren требует MongoDB, а потому
sudo yum install mongodb-org
sudo service mongod start
#Скачать https://github.com/scobal/seyren/releases/download/1.1.0/seyren-1.1.0.jar
mkdir /var/log/seyren #Создаём папку для логов
export SEYREN_LOG_PATH=/var/log/seyren/ #Параметры конфигурации seyren берёт прямо из переменных окружения. Здесь задаём путь до папки с логами
export GRAPHITE_URL="http://grahite_host:80" #Где искать graphite
export SMTP_FROM=seyren@domain.com #От кого слать почтовые алерты
nohup java -jar seyren-1.1.0.jar & #Запускаем в фоне
As you can see, the alerts are quite simple and only respond to a linear change in the metric - this is enough in our case. Using Seyren, it’s not possible to create an alert that, for example, responds to a change in the average value over the past half hour. For those who need checks of this kind, I recommend paying attention to Cabot - a complete analog of Seyren, which has the ability to create checks on the result of applying functions to Graphite metrics. Cabot is distributed as an instance for AWS or DigitalOcean, it also describes how to perform a bare-metal installation on CentOS.
Conclusion
In total, at the exit we have an almost ready-made monitoring system that in many respects surpasses the existing "whole" solutions. In addition, the integration of new services in such a system will be much more flexible (although in some ways, maybe more time-consuming), and the extensibility, taking into account the number of software working with Graphite, is almost unlimited.
Links
Graphite
Graphite - how to build a million graphs - post from Yet another conference 2013
Grafana
Diamond
Seyren
Cabot Cabot
Installation Instructions on CentOS
Our article on disaster recovery for Greenplum
Our article on Attunity CDC