Analysis of rendering through Skia Debugger: how to find the most expensive elements for rendering
 Good day, I recently solved the problem of slowing down the scroll on the pages of Mail.Ru Mail. This problem was especially noticeable on retina displays. After a simple analysis, I came to the conclusion that one of the main problems is the slow rendering of the page.
 In this article, I’ll talk about how you can use the Skia Debugger tool, which is part of the Chrome toolbox, for step-by-step analysis of the page rendering process, and how to use it to get information about how long it takes to render each element.
Like many similar optimization problems, this problem can be solved in many ways. I took up the optimization of rendering, since it took a considerable amount of time. Thus, I could quickly get a performance boost and, accordingly, improve the smoothness of the scroll, speeding up the rendering. In the beginning, I decided to see how long it takes to render a page. You can use the devtools “Enable continuos page repainting” setting for this . This option causes the browser to constantly redraw the page without any user action. In this mode, a panel with page rendering time is also displayed. About this and other features of devtools is perfectly described in this
article, so I will not focus on it. I can only say that after taking the measurements, it turned out that the page being analyzed on the retin is rendered on the order of 100 milliseconds , which creates slowdowns when the page is scrolled. The data that I can see when recording timing in devtools was not very informative, since it contained only the time the whole page was drawn, and I needed to find the culprit.
 So I began to look for which browser component is responsible for rendering, and which logs can help me understand what is slowing down. I started by studying this article and the Chromium architecture , which is available in the public domain and conceptually no different from the Chrome architecture.
 In these articles, I was interested in which component is responsible for rendering and which logs it provides. From the chapters describing the graphic components, I learned that basically all the work rests with the Skia library. To my joy, the Skia Debugger debugger was developed for her, which, judging by the screenshots on the project’s website, was necessary for me. But, unfortunately, installing it was not a trivial task for me (it was necessary to assemble the debugger itself and rebuild Chrome).
After searching a little more, I found a link to this video. I learned from it that this debugger was built into Chrome Canary , and it can be used by launching the browser with the --enable-skia-benchmarking option , on Mac this can be done with the following command:
/Applications/Google\ Chrome\ Canary.app/Contents/MacOS/Google\ Chrome\ Canary --enable-skia-benchmarkingStarting the browser with this parameter, go to the address chrome: // tracing . You should see the following tab:
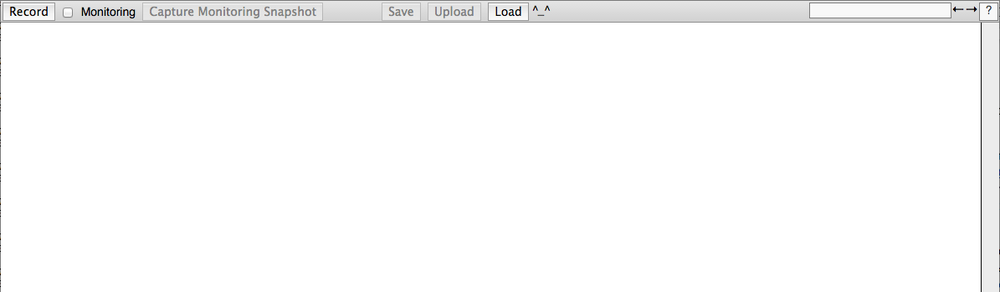
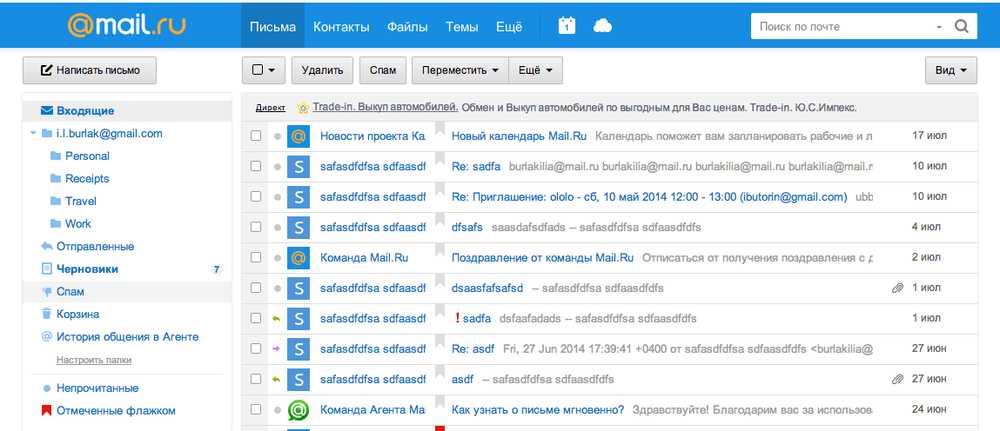
Open another tab with the page that we want to analyze. In my case, it was a mail list page. Go back to the chrome: // tracing tab and click Record, a popup should open. In it you need to select “Frame Viewer” from the list and click on Record. After that, the recording will begin, and you can perform any action on the analyzed tab, I recommend keeping no more than one tab open, since the recording buffer is very limited and a relatively small piece of data fits into it.
Once you have completed the steps you are interested in, go back to the tracing tab and click Stop. After that, you will build a diagram containing information about what happened in the system when recording. All data is grouped by browser processes. I'm interested in the process with a list of messages, it is easy to find by the title. In this process, we look at the cc :: Picture section, in which circles show the final images drawn by the browser.
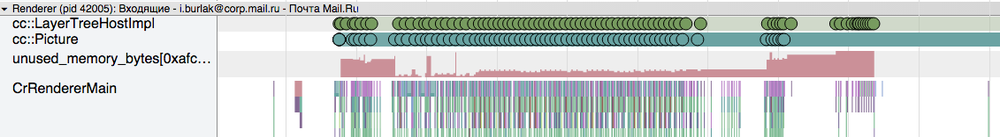
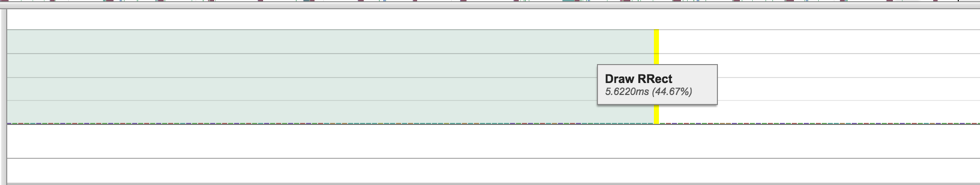
We will find among them one that contains the entire page rendering. Now at the bottom of the screen a window with a picture of the page was displayed. A diagram is displayed in the upper right corner, which shows how much total time each drawing function takes. On the left is a timeline with the sequence of rendering page elements and the time spent on each of them.
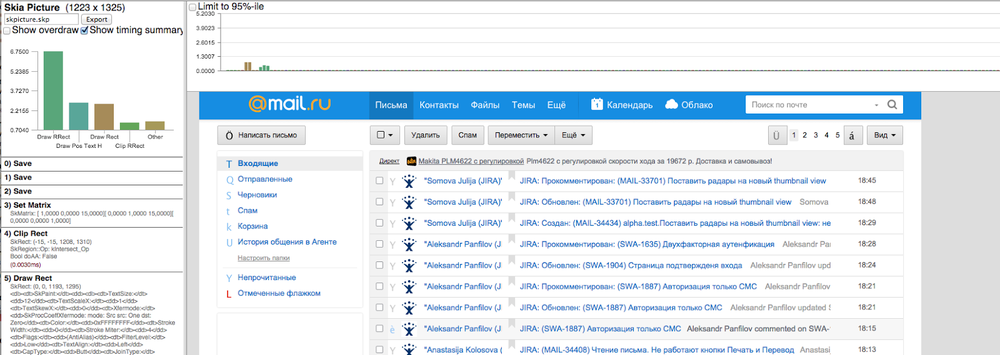
Scrolling through the timeline, I found that the main culprit for such a long rendering of the page is a container of a list of messages with a shadow. This element takes about 45% of the total page rendering time.
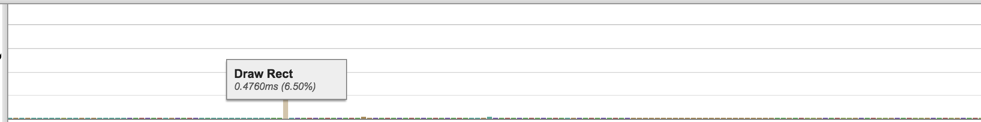
After I replaced box-shadow with a regular borderand re-recorded the page, I saw that the amount of time for rendering has decreased from 45% to 6.5%, and also that now another Skia function is already used.
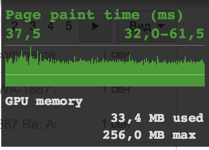 Acceleration of rendering was also confirmed after viewing the optimized page in the “Enable continuos page repainting” mode.
 It may seem to many that the box-shadow problem was obvious, and could have been found by simply changing the styles on the pages through devtools. But in this article I wanted to talk about how you can use alternative tools. How to use them to understand in what order the elements are drawn on the page and how much time it takes.
This tool has much greater capabilities that I did not describe in the article, as they are well described in the video about which I mentioned earlier.
Understanding the processes taking place in the browser is a very important knowledge that is necessary for the effective optimization of web applications. But for optimization, we also need tools that will allow us to measure the acceleration that this or that optimization has given, and also to understand the cause of the problem.
“When it comes to performance, there can be no“ likely. ” Without measuring performance, you won’t be able to know exactly whether your changes helped the program or hurt it. ”
Steve McConnell "Perfect Code" 2nd. Edition, p. 579 “Code Optimization Strategies”
Identifying the hardest elements to render is an important step in optimizing your web application. The knowledge gained on the new features of Chrome will help not only debug and find rendering bottlenecks, but also understand how any of the page components affects the entire rendering process of the stream as a whole. I will try to talk about other features of this tool in the following articles.