August 25, 2014 at 10:41
Journey through the Stack. Part 1
- Transfer
- Recovery mode

In previous materials, we examined the placement of a program in memory - one of the central concepts related to the execution of programs on computers. Now let's turn to the call stack - the workhorse of most programming languages and virtual machines. We will be introduced to amazing things like closure functions, buffer overflows, and recursion. However, everything has its own time - in the beginning you need to get a basic idea of how the stack works.
The stack is so important, because thanks to it, any function“Knows” where to return control after completion; the function, in turn, is the basic building block of the program. In general, programs are internally quite simple. The program consists of functions, functions can call other functions, in the process of its operation, any function pushes data on the stack and removes them from there. If you want the data to continue to exist after the function completes, then the space under it is allocated not on the stack, but on the heap. The above applies equally to programs written in relatively low-level C, as well as interpreted languages like JavaScript and C #. Knowing these things is sure to come in handy - and if you have to debug the program, and if you have to fine-tune the performance, and just to understand what is going on inside the program.
So, let's begin. As soon as we call a function, a stack frame is created for it on the stack . The stack frame contains local variables , as well as arguments that were passed by the calling function. In addition, the frame contains service information that is used by the called function to return control to the calling function at the right time. The exact contents of the stack and its layout in memory may vary depending on the processor architecture and the calling convention used. In this article, we consider an x86 stack with a call convention adopted in C ( cdecl ). The top image shows a stack frame located at the top of the stack.
Three processor registers are immediately evident. The stack pointer , esp , is designed to point to the top of the stack. Close to the top is always an object that has been added to the stack, but has not yet been removed from there . Similarly, in real life, things are with a stack of plates or a pack of 100-dollar bills.
The address stored in the esp register changes as objects are added and removed from the stack, however, it always indicates the last object added and not yet removed from the stack. Many processor instructions change the value of the esp register as a byproduct of their execution. Implement stack-less stack espIt would be problematic.
In the case of Intel processors, just like with many other architectures, the stack grows in the direction of lower memory addresses . Therefore, the top, in this case, corresponds to the smallest address on the stack at which the valid data is stored: in our case, it is the local_buffer variable . I think it should be clear what the arrow from esp to local_buffer means . That's all, as they say, in the case - the arrow points exactly to the first byte occupied by local_buffer , and this corresponds to the address stored in the esp register .
Next in line is another register used to track positions on the stack — the ebp register — the base pointer or the pointer to the base of the stack frame . This register is intended to indicate a position in the stack frame. Thanks to the ebp register, the current function always has a kind of reference point for accessing arguments and local variables. The address stored in the register changes when the function starts or stops execution. We can quite easily address any object in the stack frame as an offset relative to ebp , as shown in the figure.
Unlike esp , manipulating the ebp registerIt is carried out mainly by the program itself, and not by the processor. Sometimes you can achieve a performance gain simply by abandoning the standard use of the ebp register - some compiler flags are responsible for this . The Linux kernel is an example of where this technique is used.
Finally, the eax register is traditionally used to store data returned by the calling function - this statement is valid for most types supported in C.
Now let's parse the data contained in the stack frame. The figure shows the exact byte content of the frame, with the direction of growth of addresses from left to right - this is what we usually see in the debugger. And here is the picture itself:

Local variable local_buffer- this is an array of bytes, which is a null-terminated ASCII string; such lines are an invariable attribute of all C programs. Line size is 7 bytes, and most likely it was obtained as a result of keyboard input or reading from a file. In our array, 8 bytes can be stored and, therefore, one byte remains unused. The value of this byte is unknown . The fact is that data is added and removed from the stack every now and then, and in this “endless dance of the add and remove operations” you can never know in advance what the memory contains until you write to it. The C compiler does not burden itself with initializing the stack frame with zeros. Therefore, the data contained there are unknown in advance and are somewhat random. How much blood did this behavior of the compiler among programmers!
We go further. local1 is a 4-byte integer, and the figure shows the contents of each byte. It seems that this is a large number - just look at all these zeros after the eight, but here our intuition has served us badly.
Intel processors use direct byte order (literally "pointed"), and this means that numbers are stored in memory starting with the low byte. In other words, the least significant byte is stored in the memory location with the lowest address. In figures and diagrams, bytes of multibyte numbers are traditionally depicted in order from left to right. In the case of direct byte order, the least significant byte will be displayed in the leftmost position, which differs from the usual way of representing and writing numbers.
It’s good to know that all this “pointed / blunt” terminology dates back to Jonathan Swift’s Gulliver’s Travels. Just as the inhabitants of Liliput cleaned an egg from the sharp end, Intel processors also process numbers starting from the low byte.
Thus, the variable local1 actually stores the number 8 (yes, just like the number of tentacles of an octopus). Regarding param1, then there is a deuce in the second octet from the beginning, so as a result we get the number 2 * 256 = 512 (we multiply by 256, because each octet is a range from 0 to 255). param2 stores the number 1 * 256 * 256 = 65536.
The service information of the stack frame includes two components: the address of the stack frame of the calling function (saved ebp in the figure) and the address of the instruction where control should be transferred upon completion of this function (in the figure - return address). This information makes it possible to return control, and therefore, further execution of the program as if there was no call.
Now let's look at the process of "birth" of a stack frame. The stack is not growing in the direction that they usually expect to see., and at first it can be confusing. For example, to increase the stack by 8 bytes, the programmer subtracts 8 from the value stored in the esp register . Subtraction is a strange way to increase something. Funny, isn't it!
Take, for example, a simple C program:
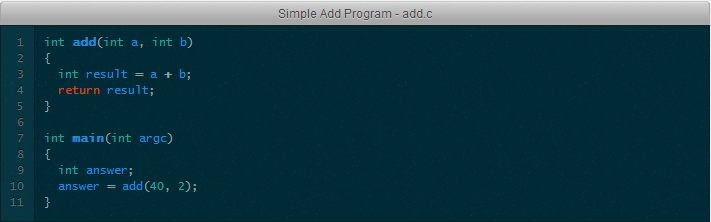
Suppose a program was launched without parameters on the command line. When executing a program in Linux, the first thing the control gets is the code contained in the standard C library. This code will call the main () function of our program, and, in this case, the argc variable will be 0 (in fact, the variable will be equal to "1", which corresponds to the parameter - the name under which the program is running, but let's simplify this moment now ). When the main () function is called , the following occurs:
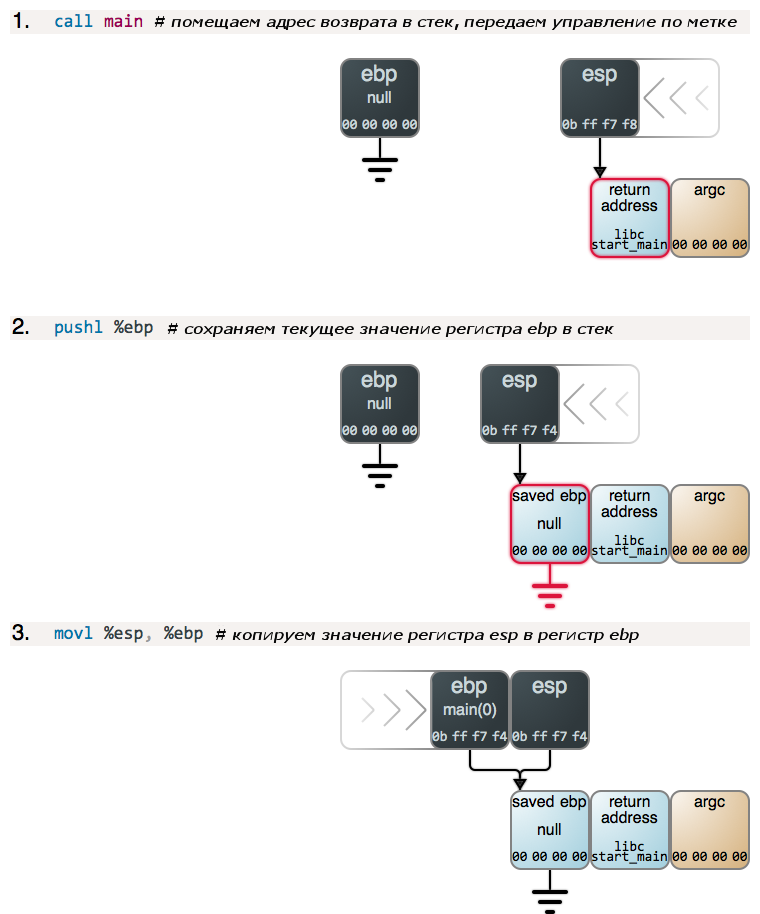
Steps 2 and 3, as well as 4 (described below) correspond to a sequence of instructions called a “prolog” that occurs in almost any function: the current value of the ebp register is pushed onto the stack, then the value of the esp register is copied to the ebp register , which actually leads to the creation of a new stack frame. The prologue of the main () function is the same as the other functions, with the only difference being that the ebp register is at the start of program executioncontains zeros.
If you look at what is located on the stack under argc , you will see some more data - a pointer to the name line under which the program was started, pointers to the parameter lines passed through the command line (traditional argv C-array ), and also pointers to environment variables and directly these variables themselves. However, at this stage this is not particularly important for us, so we continue to move towards the add () function call :
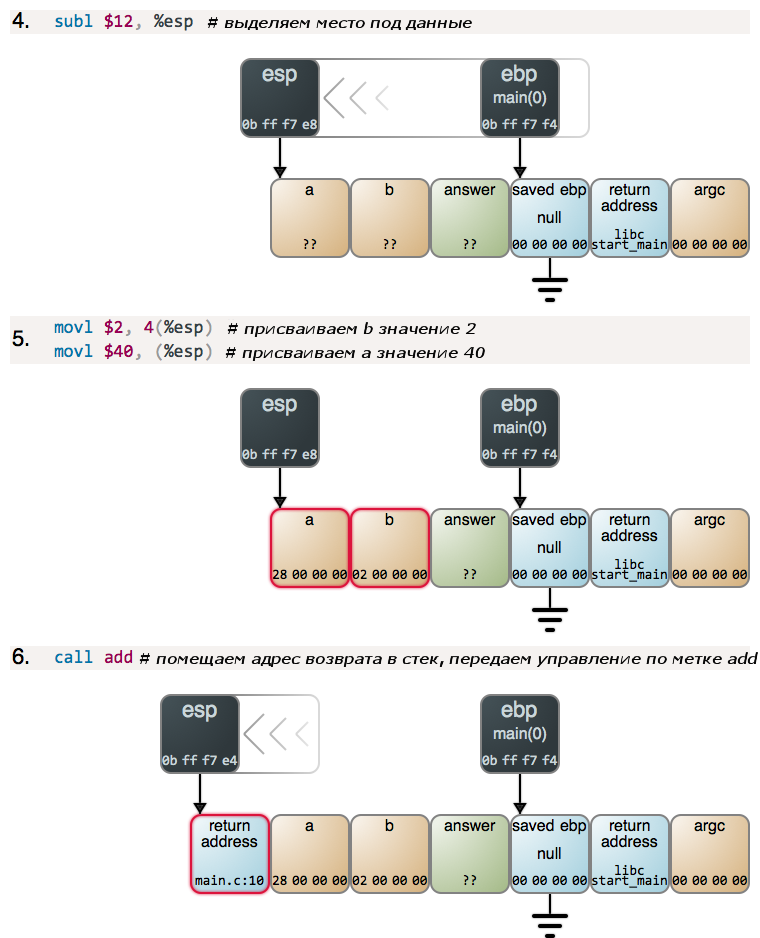
The main () function first subtracts 12 from the current value in the esp register to select the place it needs and then assigns values to the variables a and b. The values stored in the memory are shown in the figure in hexadecimal form and with direct byte order - as in any debugger. After assigning the values, the main () function calls the add () function , and it starts to execute:

The further, the more interesting! We have yet another prologue, but now we can clearly see how the sequence of stack frames in the stack is organized into a linked list, and the ebp register stores a link to the first element of this list. Based on this, stack tracing in debuggers and Exception objects of high-level languages are implemented. Let's pay attention to a situation typical for the start of a function when the ebp and esp registerspoint to the same place. And once again, we recall that to expand the stack, the value stored in the esp register is subtracted .
It is important to note the following - when copying data from the ebp registerin memory there is a seemingly incomprehensible change in the order of storage of bytes. The fact is that for registers such a thing as “byte order” does not exist. In other words, considering the register, we can’t say that it has “high or low addresses”. Therefore, debuggers show the values stored in the registers in the most convenient way for human perception: from more significant to less significant numbers. Thus, having the standard notation “left-to-right” and “little-endian” machine, it creates a misleading impression that as a result of the copy operation from register to memory, the bytes reversed the order. I wanted the picture shown in the drawings to be as close to reality as possible - hence such drawings.
Now that the hardest part is behind us, we do the addition:
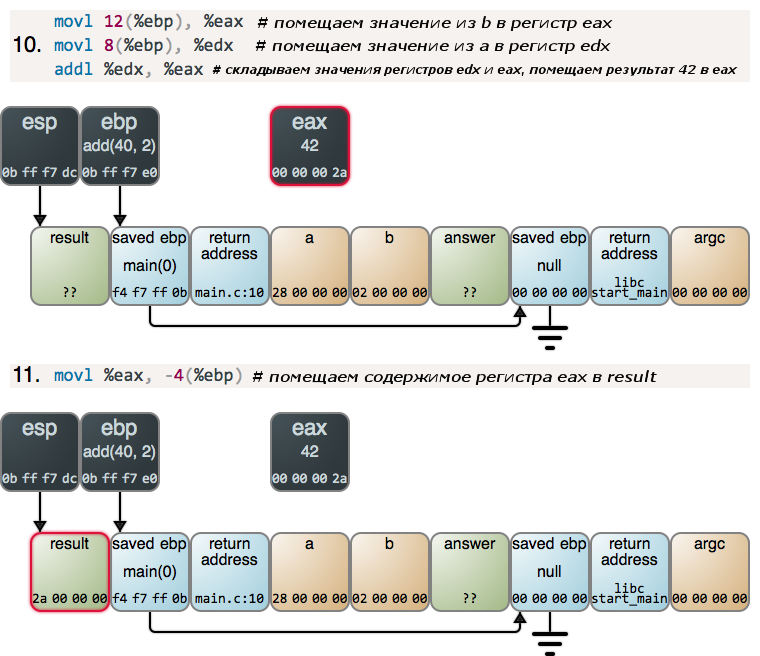
Here we have an unknown register to help with the addition, but overall nothing special or surprising. The add () function does its job and, starting from this moment, all actions on the stack will be performed in the reverse order. But we'll talk about this some other time.
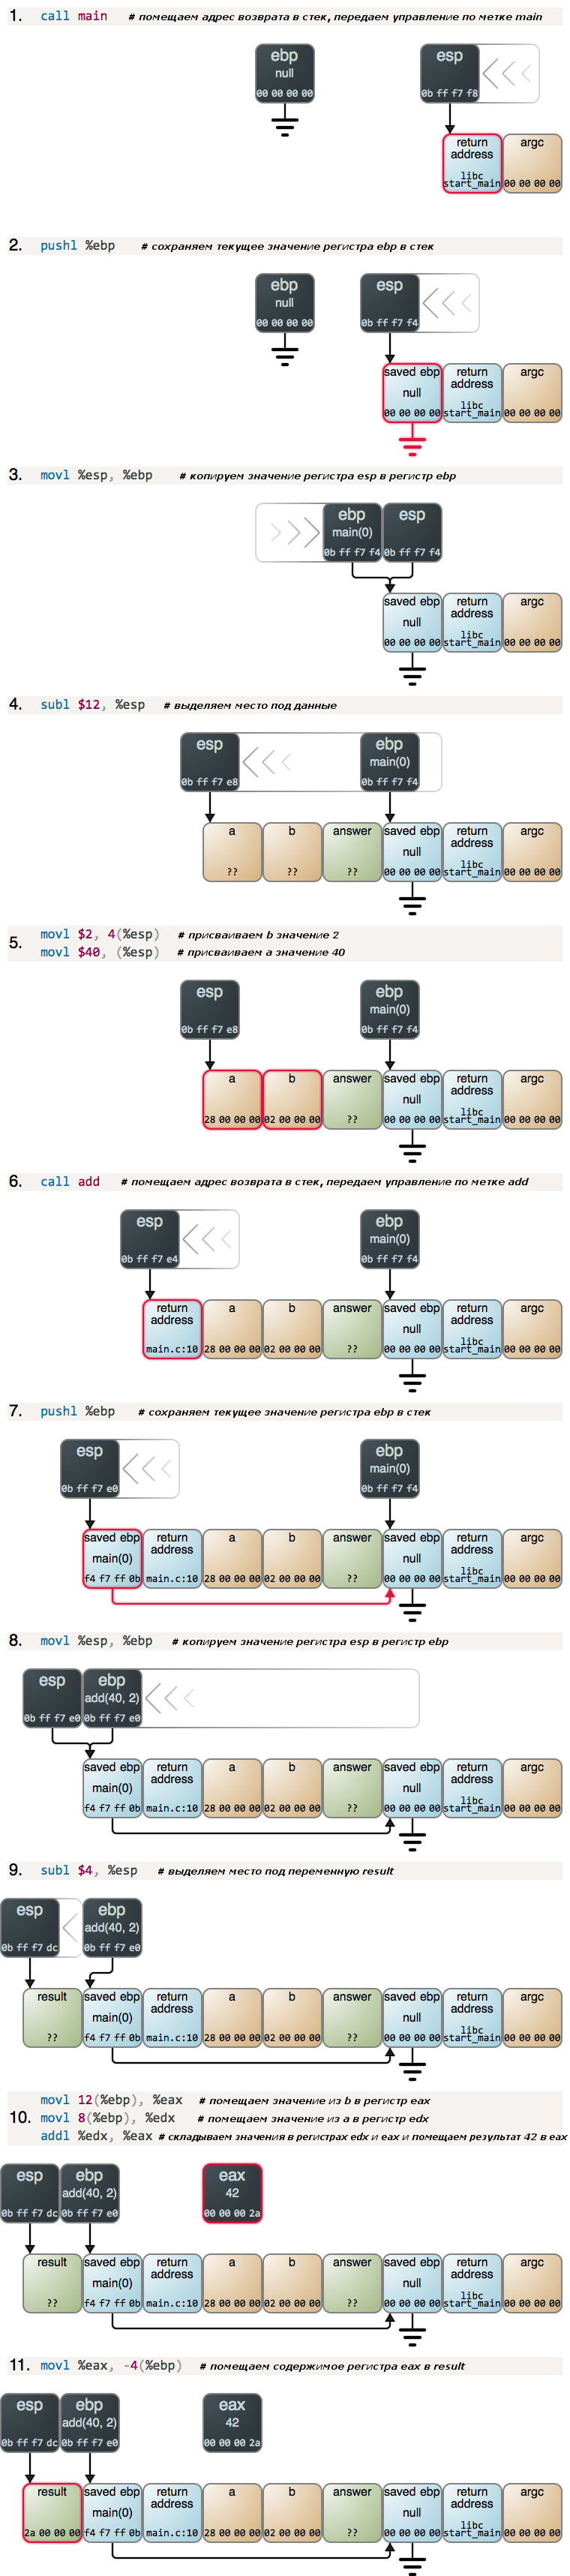
Everyone who has read up to these lines deserves a gift for endurance, so with great geek pride I will present to you this single little diagram that shows all the steps described above.
It's not all that complicated, you just have to put everything on the shelves. By the way, small squares are very stronghelp understand. Without the "little squares" in computer science in general, nowhere. I hope that my drawings made it possible to create a clear picture of what is happening, which intuitively shows both the growth of the stack and the changes in the contents of the memory. Upon closer inspection, our software is not so much different from a simple Turing machine.
This concludes the first part of our journey along the stack. In future articles, we are waiting for new immersions in the “byte” jungle, after which we will see what high-level programming languages are capable of building on this foundation. See you next week.
The material was prepared by Smart-Soft
smart-soft.ru employees