Decomposition, a task without a complete data set, desktops and marketing
In our reality, we never have complete source data for tasks that seem purely mathematical on paper. Here is an example from the practice of one of the regions with a store. In June, they call you from the radio and say that they are ready to repeat the placement of advertisements with a 40% discount. This is 192 videos in two weeks. Last time you ordered this ad to "try it" because the expected profit was higher than the cost of advertising.
The problem is that two big things happened during the placement period:
Now we need to separate one from the other and understand what and how it worked. You can not evaluate advertising without taking into account the recession, and the decline without taking into account advertising. Here is your sales schedule for the period before the holidays, during and after:

The original city, sales in pieces vertically to weeks horizontally.
It shows that sales fall after advertising on holidays. Fall on holidays is the norm for all cities. True, we, roughly speaking, do not know what would be the schedule without ads. Same? A little lower? Strongly lower?

Without advertising, events would follow one of these scenarios. For what - I do not know.
So, the task is to understand how advertising influenced sales, despite the fact that there were at least two global factors changing them. This problem is almost always found when you need to evaluate the effectiveness of advertising or promotions.
Let's start from the other side. We know that in another city the schedule was as follows:

Control city 1
But this is not enough for us, we need a third point. Another completely controlled source in the third city:

Control city 2
We put them on top of each other:
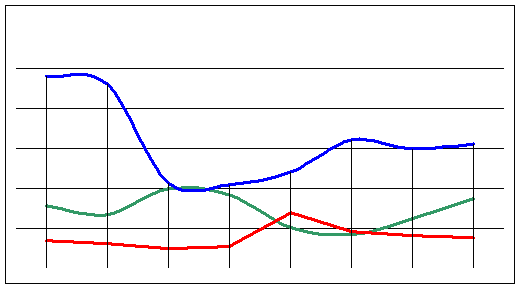
Our investigated city is green.
It turns out a picture that so far looks like some kind of garbage from colored lines. The taxonomy is not visible, since sales volumes in absolute terms in cities are different.
What is needed is normalization, and not the assembly of a general sales schedule. Since one of the cities almost tripled the speed of the two remaining (there is more population), then in a superposition we just see a noisy signal of this particular city, like this:

Let's move on to the relative sales per cycle, that is, we normalize the graphs. We get this.

In the third week of the period, a peak in the studied city and recessions in the control are visible. But further in one of the controls an incomprehensible peak is visible.
We return to the data on three cities. I remind you that we need to identify two trends: a seasonal decline and a rise in the green city of sales after radio advertising. First we need to clean the graphics from local distortion.
It should be understood that the data in our upload arrived grouped by week. This makes sense, since one week corresponds to one rise-fall cycle by day, plus it contains data on delivery orders that were, for example, received and sent in this cycle, but shipped only in the next. The week has a pronounced “seasonality” inside: for example, on Monday sales are much less than on Wednesday.
Compare our cycle and the cycle of advertising. Radio ads and holiday recessions last far more than a single cycle. This means that all the sharp jumps inside the cycles themselves are local distortions, in our case, noise. We have every right to use the weeks.
We build a reference profile of a standard week, removing emissions. If our assumption is correct, then all the weeks in all cities will be approximately the same. But suddenly it turns out that during the cycles of advertising the green city in the blue city (where this advertisement was not) local outbursts were noted. There is more than 40% waste from a regular day of sales.
Most likely, there was something that was not explained by the model. First, we test the hypothesis of incorrect data transfer from reality. I chose a simple method - I called the head of the call center and asked a question when the last time there were such surges that the shift simply vomited. Considering that the call center also builds the profiles of the reference week and forms the shift sizes from them, I will receive a check of my emission hypothesis over the course of weeks. Roughly speaking, if the forecast is incorrect, then everyone in the call center will remember the overload. In our case, yes, the CC remembers the peak in this period. That is, this is not, for example, a faulty synchronization server, which for some reason downloaded data with one report for several days.
But I, in my analysis, and CC in the formation of shifts, proceed from similar assumptions, which means that there may be a general error in the calculations. We need to dig further, checking the causes of these downturns. Ok, let’s switch to the site’s toolkit: I’m looking at the traffic sources for these numbers. Yeah, the first peak is a small effect from the publication of a large local blogger, it can be removed from the schedule as part of solving the season / radio task. The second peak detected is traffic from search queries. Fortunately, judging by the shape of the graph, I know what it can be. I check the reports on the placements - yes, one of the games appeared on the local television channel in a children's program. Also remove.
Here I am using mad skillz roughly showing how it looks:

An approximate graph with the deductions of the described effects
Total - we have two test cities with similar graphs after the decomposition of other known factors. Roughly speaking, we are now comparing normal sales of the red city, normal sales of blue (excluding blogger and television) and normal sales of green, taking into account the influence of the radio. The graphs show that both control cities go down for the holidays. The green city rises during the holidays, but is not being restored at the same time as they are.
Ok, let's go find out further. After the May holidays, people return to the city and begin to participate in various summer events. The graphs of the control cities show an upsurge - yes, in both cities we brought the boards for some major events of a city-wide scale. On the graph of the studied city there is no such thing. We need a hypothesis to explain what it is. Options:
The first and third reasons seem extremely unlikely, so let's start with the second. I look at the sales schedule in the store - the distribution by hours is normal. The sellers also did not notice anything strange, except that they complain about the rain, because of which few people come. Yeah! So, you need to check the weather during the weekend events - if there were few people, then the decline will be explained. I check - yes, for sure, rainfall. That is, the decline in the studied city is explained by the weather (it happens). And if not for this, there would have been the same rise as in the control cities.
We cleaned the three graphics from noise, made a decomposition for different events - and got a comparison of the city with radio advertising and cities without. Most importantly, I have numerical data on various vectors of increasing or decreasing sales (accumulated from history over 3 years), that is, I can evaluate not only “works - does not work”, but also evaluate the profit from this advertisement. Let's say with an error of 10-30%.
Why don't we take into account the long-term effects of advertising? Because in calculations of efficiency it is necessary to rely in such cases only on the direct effect on sales. Of course, the people themselves with the radio will tell five times what lasting effect it has (and this is true for single customers), but after the placement - in general - there will be no effect.
Result?It can be seen that advertising brought more net profit than we spent on it, and ROI (return on investment) in the region of 130-160%. So, now there is an informed decision - advertising can continue.
The problem is that two big things happened during the placement period:
- There was a seasonal decline due to the holidays, and city sales were falling.
- Advertising was supposed to give additional sales.
Now we need to separate one from the other and understand what and how it worked. You can not evaluate advertising without taking into account the recession, and the decline without taking into account advertising. Here is your sales schedule for the period before the holidays, during and after:
The original city, sales in pieces vertically to weeks horizontally.
It shows that sales fall after advertising on holidays. Fall on holidays is the norm for all cities. True, we, roughly speaking, do not know what would be the schedule without ads. Same? A little lower? Strongly lower?
Without advertising, events would follow one of these scenarios. For what - I do not know.
So, the task is to understand how advertising influenced sales, despite the fact that there were at least two global factors changing them. This problem is almost always found when you need to evaluate the effectiveness of advertising or promotions.
Let's start from the other side. We know that in another city the schedule was as follows:
Control city 1
But this is not enough for us, we need a third point. Another completely controlled source in the third city:
Control city 2
We put them on top of each other:
Our investigated city is green.
It turns out a picture that so far looks like some kind of garbage from colored lines. The taxonomy is not visible, since sales volumes in absolute terms in cities are different.
What is needed is normalization, and not the assembly of a general sales schedule. Since one of the cities almost tripled the speed of the two remaining (there is more population), then in a superposition we just see a noisy signal of this particular city, like this:
Let's move on to the relative sales per cycle, that is, we normalize the graphs. We get this.
In the third week of the period, a peak in the studied city and recessions in the control are visible. But further in one of the controls an incomprehensible peak is visible.
We return to the data on three cities. I remind you that we need to identify two trends: a seasonal decline and a rise in the green city of sales after radio advertising. First we need to clean the graphics from local distortion.
Unit Check
It should be understood that the data in our upload arrived grouped by week. This makes sense, since one week corresponds to one rise-fall cycle by day, plus it contains data on delivery orders that were, for example, received and sent in this cycle, but shipped only in the next. The week has a pronounced “seasonality” inside: for example, on Monday sales are much less than on Wednesday.
Compare our cycle and the cycle of advertising. Radio ads and holiday recessions last far more than a single cycle. This means that all the sharp jumps inside the cycles themselves are local distortions, in our case, noise. We have every right to use the weeks.
Model check
We build a reference profile of a standard week, removing emissions. If our assumption is correct, then all the weeks in all cities will be approximately the same. But suddenly it turns out that during the cycles of advertising the green city in the blue city (where this advertisement was not) local outbursts were noted. There is more than 40% waste from a regular day of sales.
Most likely, there was something that was not explained by the model. First, we test the hypothesis of incorrect data transfer from reality. I chose a simple method - I called the head of the call center and asked a question when the last time there were such surges that the shift simply vomited. Considering that the call center also builds the profiles of the reference week and forms the shift sizes from them, I will receive a check of my emission hypothesis over the course of weeks. Roughly speaking, if the forecast is incorrect, then everyone in the call center will remember the overload. In our case, yes, the CC remembers the peak in this period. That is, this is not, for example, a faulty synchronization server, which for some reason downloaded data with one report for several days.
But I, in my analysis, and CC in the formation of shifts, proceed from similar assumptions, which means that there may be a general error in the calculations. We need to dig further, checking the causes of these downturns. Ok, let’s switch to the site’s toolkit: I’m looking at the traffic sources for these numbers. Yeah, the first peak is a small effect from the publication of a large local blogger, it can be removed from the schedule as part of solving the season / radio task. The second peak detected is traffic from search queries. Fortunately, judging by the shape of the graph, I know what it can be. I check the reports on the placements - yes, one of the games appeared on the local television channel in a children's program. Also remove.
Here I am using mad skillz roughly showing how it looks:
An approximate graph with the deductions of the described effects
Total - we have two test cities with similar graphs after the decomposition of other known factors. Roughly speaking, we are now comparing normal sales of the red city, normal sales of blue (excluding blogger and television) and normal sales of green, taking into account the influence of the radio. The graphs show that both control cities go down for the holidays. The green city rises during the holidays, but is not being restored at the same time as they are.
Ok, let's go find out further. After the May holidays, people return to the city and begin to participate in various summer events. The graphs of the control cities show an upsurge - yes, in both cities we brought the boards for some major events of a city-wide scale. On the graph of the studied city there is no such thing. We need a hypothesis to explain what it is. Options:
- Belated seasonal shift: all of a sudden come on holidays in this city later? Then our calculations are not suitable - it is necessary to compare with a similar shift in the graphs of control cities.
- A local problem of any nature.
- Rollback from advertising - all of a sudden we pushed people who were thinking - and exhausted the market a bit?
The first and third reasons seem extremely unlikely, so let's start with the second. I look at the sales schedule in the store - the distribution by hours is normal. The sellers also did not notice anything strange, except that they complain about the rain, because of which few people come. Yeah! So, you need to check the weather during the weekend events - if there were few people, then the decline will be explained. I check - yes, for sure, rainfall. That is, the decline in the studied city is explained by the weather (it happens). And if not for this, there would have been the same rise as in the control cities.
Conclusion
We cleaned the three graphics from noise, made a decomposition for different events - and got a comparison of the city with radio advertising and cities without. Most importantly, I have numerical data on various vectors of increasing or decreasing sales (accumulated from history over 3 years), that is, I can evaluate not only “works - does not work”, but also evaluate the profit from this advertisement. Let's say with an error of 10-30%.
Why don't we take into account the long-term effects of advertising? Because in calculations of efficiency it is necessary to rely in such cases only on the direct effect on sales. Of course, the people themselves with the radio will tell five times what lasting effect it has (and this is true for single customers), but after the placement - in general - there will be no effect.
Result?It can be seen that advertising brought more net profit than we spent on it, and ROI (return on investment) in the region of 130-160%. So, now there is an informed decision - advertising can continue.