Monitoring Kubernetes Cluster with Prometheus
- Transfer
Hello colleagues.
We have just given to translation an interesting book by Brendan Burns, which tells about design patterns for distributed systems.
 In addition, we are already in full swing translating the book " Mastering Kubernetes " (2nd edition) and is preparing for September the author's book about Docker, about which there will be a separate post.
We believe that the next stop on this path is a book about Prometheus, therefore today we bring to your attention the translation of a small article by Björn Wenzel about the close cooperation of Prometheus and Kubernetes. Do not forget to take part in the survey.
Monitoring the Kubernetes cluster is very important. The cluster contains a lot of information that allows answering questions from the discharge: how much memory and disk space is available, how is cpu being actively used? What container how much resources does it spend? This also includes questions about the status of applications running in a cluster.
One of the tools held for such work is called Prometheus. He is supported by the Cloud Native Computing Foundation, initially Prometheus was developed by SoundCloud. Conceptually, Prometheus is very simple:
The Prometheus server can work, for example, in a Kubernetes cluster and receive the configuration through a special file. Such a configuration, in particular, contains information on where the terminal is located, from which it is necessary to collect data after a specified interval. Then the Prometheus server requests metrics from these terminals in a special format (usually they are available at the address
First, we define the name of the task
First, the name of the metric is given, then the captions (information in curly brackets) and, finally, the value of the metric. The most interesting is the search function for these metrics. For this purpose, Prometheus has a very powerful query language .
The main idea of Prometheus, already described above, is the following: Prometheus queries the port with metrics at a specified interval and stores them in a time series database. If Prometheus cannot remove metrics by itself, then there is another functionality called pushgateway. The pushgateway gateway accepts metrics sent by external tasks, and Prometheus collects information from this gateway at specified intervals.
Another optional component of the Prometheus architecture is this
In addition, the Prometheus server contains many integrated features , for example, it can request ec2 instances on the Amazon API or request scams, nodes, and services from Kubernetes. There are also many exporters , such as the one mentioned above
In addition, it is not difficult to write your own exporter - for example, for an application that provides metrics such as jvm information. There is, for example, such a library developed by Prometheus for exporting such metrics. This library can be used in conjunction with Spring, and also allows you to define your own metrics. Here is an example from the page
This is a metric that describes the duration of the method, and other metrics can now be provided through the terminal or pushed through pushgateway.
As I already mentioned, for using Prometheus in the Kubernetes cluster there are integrated features for removing information from the hearth, node and service. The most interesting is that Kubernetes is specially designed to work with Prometheus. For example,
In this example, for starters, I use the official helm-chart.
For myself, I slightly changed the default helm-chart configuration. First, I had to activate
I made the simplest changes:
After that, you can run Prometheus with helm:
So, we will install the Prometheus server, and on each node, we will install it under node_exporter. Now you can go to the Prometheus web-based GUI and see some information:
The following screenshot shows why Prometheus collects information (Status / targets), and when information was
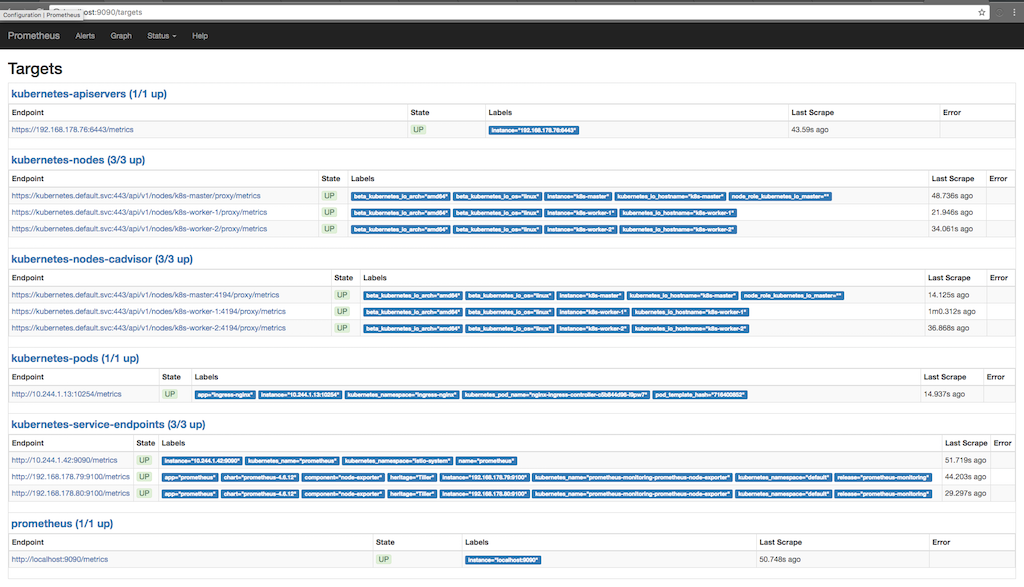
taken in the last several times: Here you can see how Prometheus requests metrics from apiserver, nodes, cadvisor, running on nodes and at the end points of the kubernetes services. You can see the metrics in detail by going to Graph and writing a request to view the information of interest to us:

Here, for example, we see free storage at the mount point “/”. Signatures are added to the bottom of the diagram, which are added by Prometheus or are already available from node_exporter. We use these signatures to request only the mount point “/”.
As already shown in the first screenshot, where the goals from which Prometheus is requesting metrics are derived, there is also a metric for the hearth operating in the cluster. One of the nice features of Prometheus is the ability to shoot information from entire pods. If the container in the pod provides Prometheus metrics, then we can collect these metrics with Prometheus automatically. The only thing we need to take care of is to provide the installation with two annotations; in my case
Here we see that the deployment pattern is supplied with two annotations of Prometheus. The first one describes the port through which Prometheus should request metrics, and the second one activates the data collection functionality. Now Prometheus is requesting a
We have a project in which Prometheus is used in federated mode. The idea is this: we collect only the information that is available only from inside the cluster (or it is easier to collect this information from inside the cluster), turn on the federated mode and get this information using the second Prometheus installed outside the cluster. Thus, it is possible to collect information from several Kubernetes clusters at once, also capturing other components that are not accessible from within this cluster or not related to this cluster. In addition, then it is not necessary to store the collected data in the cluster for a long time and, if something goes wrong with the cluster, we can collect some information, for example, node_exporter, and from outside the cluster.
We have just given to translation an interesting book by Brendan Burns, which tells about design patterns for distributed systems.
In addition, we are already in full swing translating the book " Mastering Kubernetes " (2nd edition) and is preparing for September the author's book about Docker, about which there will be a separate post. We believe that the next stop on this path is a book about Prometheus, therefore today we bring to your attention the translation of a small article by Björn Wenzel about the close cooperation of Prometheus and Kubernetes. Do not forget to take part in the survey.
Monitoring the Kubernetes cluster is very important. The cluster contains a lot of information that allows answering questions from the discharge: how much memory and disk space is available, how is cpu being actively used? What container how much resources does it spend? This also includes questions about the status of applications running in a cluster.
One of the tools held for such work is called Prometheus. He is supported by the Cloud Native Computing Foundation, initially Prometheus was developed by SoundCloud. Conceptually, Prometheus is very simple:
Architecture
The Prometheus server can work, for example, in a Kubernetes cluster and receive the configuration through a special file. Such a configuration, in particular, contains information on where the terminal is located, from which it is necessary to collect data after a specified interval. Then the Prometheus server requests metrics from these terminals in a special format (usually they are available at the address
/metrics) and stores them in the time series database. The following is a brief example: a small configuration file requesting metrics from a module node_exporterbeing deployed as an agent on each node:scrape_configs:
- job_name: "node_exporter"
scrape_interval: "15s"
target_groups:
- targets: ['<ip>:9100']First, we define the name of the task
job_name, later on this name, you can request metrics in Prometheus, then the data retrieval interval scrape_intervaland the group of servers on which it works node_exporter. Now Prometheus will every 15 seconds request the server for the path path /metricsto the actual metrics. It looks like this:# HELP go_gc_duration_seconds A summary of the GC invocation durations.# TYPE go_gc_duration_seconds summary
go_gc_duration_seconds{quantile="0"} 1.4852e-05
go_gc_duration_seconds{quantile="0.25"} 2.0702e-05
go_gc_duration_seconds{quantile="0.5"} 2.2059e-05
...First, the name of the metric is given, then the captions (information in curly brackets) and, finally, the value of the metric. The most interesting is the search function for these metrics. For this purpose, Prometheus has a very powerful query language .
The main idea of Prometheus, already described above, is the following: Prometheus queries the port with metrics at a specified interval and stores them in a time series database. If Prometheus cannot remove metrics by itself, then there is another functionality called pushgateway. The pushgateway gateway accepts metrics sent by external tasks, and Prometheus collects information from this gateway at specified intervals.
Another optional component of the Prometheus architecture is this
alertmanager. Componentalertmanagerallows you to set limits, and if they are exceeded, send notifications by email, slack or opsgenie. In addition, the Prometheus server contains many integrated features , for example, it can request ec2 instances on the Amazon API or request scams, nodes, and services from Kubernetes. There are also many exporters , such as the one mentioned above
node_exporter. Such exporters can work, for example, on a site where an application like MySQL is installed and interrogate the application about metrics at specified intervals and provide them to the terminal / metrics, while the Prometheus server can collect these metrics from there.In addition, it is not difficult to write your own exporter - for example, for an application that provides metrics such as jvm information. There is, for example, such a library developed by Prometheus for exporting such metrics. This library can be used in conjunction with Spring, and also allows you to define your own metrics. Here is an example from the page
client_java:@ControllerpublicclassMyController{
@RequestMapping("/")
@PrometheusTimeMethod(name = "my_controller_path_duration_seconds", help = "Some helpful info here")
public Object handleMain(){
// Делаем что-либо
}
}This is a metric that describes the duration of the method, and other metrics can now be provided through the terminal or pushed through pushgateway.
Use in Kubernetes Cluster
As I already mentioned, for using Prometheus in the Kubernetes cluster there are integrated features for removing information from the hearth, node and service. The most interesting is that Kubernetes is specially designed to work with Prometheus. For example,
kubeletthey kube-apiserverprovide metrics that can be read in Prometheus, so monitoring is very simple. In this example, for starters, I use the official helm-chart.
For myself, I slightly changed the default helm-chart configuration. First, I had to activate
rbacin the Prometheus installation, otherwise Prometheus was not able to collect information from kube-apiserver. Therefore, I wrote my own values.yaml file, which describes how the helm-chart should be displayed.I made the simplest changes:
alertmanager.enabled: false, that is, canceled the deployment of alertmanager in the cluster (I was not going to use the alertmanager, I think it is easier to configure the warnings using Grafana)kubeStateMetrics.enabled: falseI think these metrics return only some information about the maximum number of pods. When you first start the system, this information is not important to me.server.persistentVolume.enabled: falseuntil I have a persistent volume configured by default- I changed the information collection configuration in Prometheus, as was done in the pull request on github . The fact is that in Kubernetes v1.7, cAdvisor metrics work on a different port.
After that, you can run Prometheus with helm:
helm install stable/prometheus --name prometheus-monitoring -f prometheus-values.yamlSo, we will install the Prometheus server, and on each node, we will install it under node_exporter. Now you can go to the Prometheus web-based GUI and see some information:
kubectl port-forward <prometheus-server-pod> 9090The following screenshot shows why Prometheus collects information (Status / targets), and when information was
taken in the last several times: Here you can see how Prometheus requests metrics from apiserver, nodes, cadvisor, running on nodes and at the end points of the kubernetes services. You can see the metrics in detail by going to Graph and writing a request to view the information of interest to us:
Here, for example, we see free storage at the mount point “/”. Signatures are added to the bottom of the diagram, which are added by Prometheus or are already available from node_exporter. We use these signatures to request only the mount point “/”.
Custom metrics with annotations
As already shown in the first screenshot, where the goals from which Prometheus is requesting metrics are derived, there is also a metric for the hearth operating in the cluster. One of the nice features of Prometheus is the ability to shoot information from entire pods. If the container in the pod provides Prometheus metrics, then we can collect these metrics with Prometheus automatically. The only thing we need to take care of is to provide the installation with two annotations; in my case
nginx-ingress-controllermakes it out of the box:apiVersion: extensions/v1beta1
kind: Deployment
metadata:
name: nginx-ingress-controller
namespace: ingress-nginx
spec:
replicas: 1
selector:
matchLabels:
app: ingress-nginx
template:
metadata:
labels:
app: ingress-nginx
annotations:
prometheus.io/port: '10254'
prometheus.io/scrape: 'true'
...Here we see that the deployment pattern is supplied with two annotations of Prometheus. The first one describes the port through which Prometheus should request metrics, and the second one activates the data collection functionality. Now Prometheus is requesting a
Kubernetes Api-Serverpod annotated to collect information, and is trying to collect information from the terminal / metrics.Work in federated mode
We have a project in which Prometheus is used in federated mode. The idea is this: we collect only the information that is available only from inside the cluster (or it is easier to collect this information from inside the cluster), turn on the federated mode and get this information using the second Prometheus installed outside the cluster. Thus, it is possible to collect information from several Kubernetes clusters at once, also capturing other components that are not accessible from within this cluster or not related to this cluster. In addition, then it is not necessary to store the collected data in the cluster for a long time and, if something goes wrong with the cluster, we can collect some information, for example, node_exporter, and from outside the cluster.
Only registered users can participate in the survey. Sign in , please.