OpenNMS Monitoring System
I do not wish to seem unpatriotic in the slightest degree, but historically it turned out that when choosing a corporate system for monitoring network infrastructure, OpenNMS defeated our company, having removed Grandma Cacti from this position and overtaken compatriot Zabbix. Comparative analysis of Open Source monitoring systems is not included in my plans, therefore, I’ll just briefly talk about OpenNMS, since they didn’t write about it on Habré and generally there is little information about it.
The main function of OpenNMS (Open Network Monitoring System) is the monitoring of various services and internal systems of network and server equipment. To collect information, the so-called "collectors" are used, working via SNMP, HTTP, ITDITP protocols. OpenNMS does not have separate server agents. If the information turns out to be in demand, then I will describe examples of implementations of “wrappers” in the following material in the section “Use cases”. I don’t want to repeat mistakes with the publication of giant sheets of text, which are difficult for both the author and readers to understand.
a brief description of
OpenNMS is developing dynamically, it’s pretty well documented, but the community is fragmented, and configuring as editing a myriad of XML files can frighten many away. The system is written in Java with Perl appendices and a fair amount of distributions for various platforms have been released. If desired, it can be run on any machine with the Java SDK and PostgreSQL server.
A 1 GHz Pentium III (or equivalent processor) or better. A minimum of 256 MB of RAM, although 512 MB is strongly recommended.
These system requirements from the official documentation, to put it mildly, are the most minimal and will allow just what to start the system itself. Therefore, I will allow myself to correct them a bit: 64-bit CPU, 2 Gb RAM (this is the very, very minimum), a high-performance hard drive.
The voracity of the system directly depends on the number of nodes that it will monitor. A system with more than 1500 nodes and 5000 interfaces on them (VLANs, ports, services, etc.) feels comfortable on the Xeon E5520 with 12 Gb of RAM and SAS hard. At the same time, a 2Gb tmpfs partition was given for storing rrd files. The power reserve has been allocated more than two times - this is a reserve for the growth of the network and the appetites of the system in the process of updating and development.
Installation
Pre set
ntp, net-snmp, net-snmp-utils, postgresql, postgresql-server, perl. Basically configure and run all the services indicated. Then we install the latest version JDK by downloading it from the Oracle site, and finally you can connect the OpenNMS repository and install the system itselfrpm -Uvh http://yum.opennms.org/repofiles/opennms-repo-stable-rhel6.noarch.rpm
yum install opennms iplike
The last package is an add-on to PostgreSQL from the OpenNMS developers in the form of an IPLIKE stored procedure that helps to work with queries by IP addresses and network addresses using masks like
192.168.4-255.*that is actively used within the system itself. [!] If the host name on which the system is installed does not resolve on the DNS servers registered in resolv.conf, write it in hosts. Otherwise, the system will not start. You should also pay attention to the initial configuration of PostgreSQL. After the default installation of the server in
/var/lib/pgsql/data/pg_hba.conf, put the method trust to all three local connections./opt/opennms/bin/runjava -S /usr/java/latest/bin/java
/opt/opennms/bin/install -dis
/etc/init.d/opennms start
Once launched, the system will be available on
hostname:8980. It is not necessary to install a separate web server - the OpenNMS web interface works through the Jetty server. However, if you wish, you can reconfigure Jetty itself, or hang Nginx or apache with mod_proxy on port 80 and do proxy_pass on all requests. When reinstalling the entire system, you should drop the database and delete it
/var/opennms. Otherwise, there will be collisions with graphs and reports. For a complete reinstallation, we do yum reinstall opennmsand /opt/opennms/bin/install -dis, for a partial reinstallation , only the second. It happens that OpenNMS displays a message at startup
Started OpenNMS, but it has not finished starting up. First of all, you should check whether a configuration error has been made and if all services are running (commandopennms -v status) And if all the services are running, then I have bad news for you - OpenNMS does not have enough resources and it wants relief. Create a $opennms/etc/opennms.confcontent file START_TIMEOUT=20. The number in the parameter is the coefficient by which the 5-second interval for checking the neglect of all services will be multiplied. By default, this parameter is 10 and it turns out that if in 50 seconds all the services do not have time to report a successful start, an error will be returned. That is, START_TIMEOUT=20it is a 100 second wait for all systems to start.Interface and setup
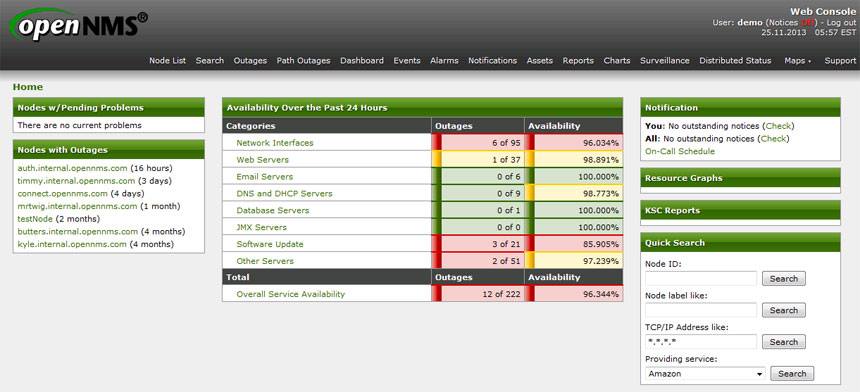
Perhaps I’ll skip the part with a detailed description of the web interface - in general terms, the system will become clear after 10 minutes of walking through the sections, but it should be noted right away that you can’t get away with just working with the web interface in XML files - you will have to dig deep into XML files.
So, for example, you can easily add an SNMP community for a specific subnet through the web interface in the section
Admin → Configure SNMP by IP. But you can view and edit already added community only in the corresponding XML file. At the same time, the ranges of subnets to be monitored ( network discovery) can be completely edited from the web interface.Since you will have to edit configuration files a lot, I would recommend connecting any familiar CVS to track changes. Also, I would advise you to develop the habit of checking it as after editing the configuration file
xmllint --noout filename.xml. And the final touch: changes to the configuration files are applied by restarting the opennms daemon, which takes quite a while.Internal mechanics
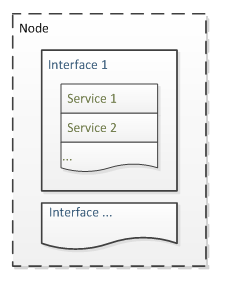 The basic unit of data collection is an interface that integrates certain services. All interfaces on one device are grouped into a node. An interface may not necessarily be a network - from the point of view of OpenNMS, temperature sensors are also interfaces. Starting with version 1.9, similar interfaces are organized into separate groups.
 When a new interface is detected, an event is triggered
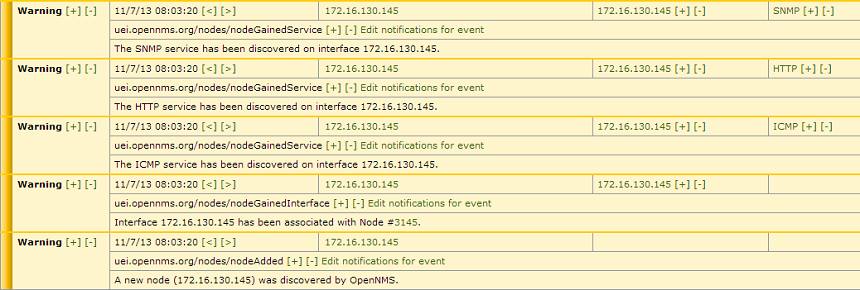
newSuspect, after which the system tries to find services on this interface, find other interfaces on the device in a chain and group the received information into a node. OpenNMS can receive data about new interfaces automatically (by searching for given ranges with a certain frequency), manually (by calling a perl script), or by receiving SNMP trap.# Вручную скормим системе сервер, на котором она сама и установлена:
perl /opt/opennms/bin/send-event.pl --interface 192.168.11.11 uei.opennms.org/internal/discovery/newSuspect
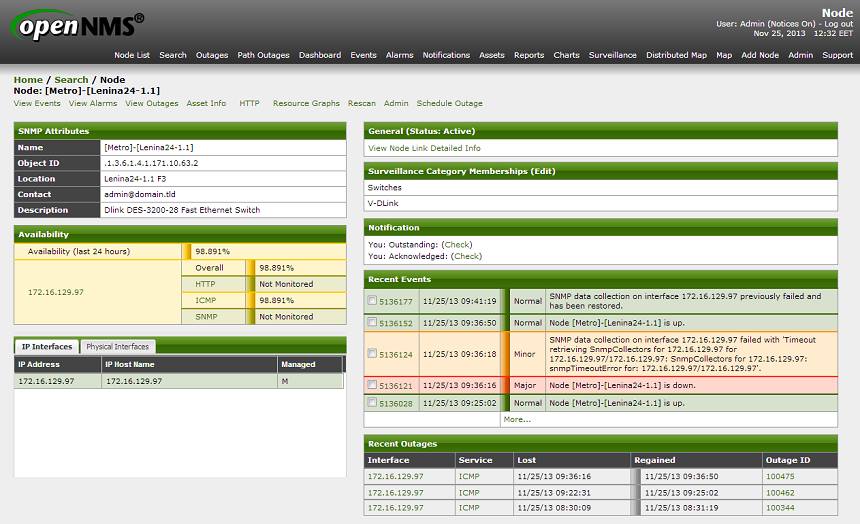
Now in Events → All Events you can observe the bewitching process of the birth of a new node. The speed of its appearance varies depending on the device and ranges from a few seconds to several minutes.
Of particular interest are Resource Graphs - graphs of system resources. After adding a new node, we will see only the default data for each service (for example, ICMP and HTTP response time if the latter is present). However, it is quite possible to expand the amount of information received. For example, we want to take more data from another server running CentOS. We will receive data via SNMP, therefore, install net-snmp on the target server and edit
/etc/init.d/snmp/snmpd.conf# комментируем в начале конфига строки с com2sec, group, view и
# добавляем read-only комьюнити
rocommunity stat
# правим location и contact
syslocation Datacenter N1, Rack 2
syscontact admin@domain.tld
# описываем разделы для мониторинга
disk / 10000
disk /var 10000
# описываем предельные значения load average
load 12 14 14
We open 161 UDP port in iptables, run snmpd and start a new SNMP community in OpenNMS (Admin → Operations → Configure SNMP Community Names by IP). After that, you can open the added node and make it Rescan. After the scan is completed, there will be more information and graphs will provide data on disk space, inodes and system loading.
Restarting opennms when adding SNMP community through the admin panel is not formally required. But sometimes updating this file or adding a new discovery group is delayed a lot and it is faster to restart opennms than waiting for it to wake up on its own.
A little more internal mechanics
Of course, OpenNMS can scan the network and determine the appearance of new devices on the network. The search process is configured in the web interface in the Admin → Configure Discovery section or in the file
$opennms/etc/discovery-configuration.xml.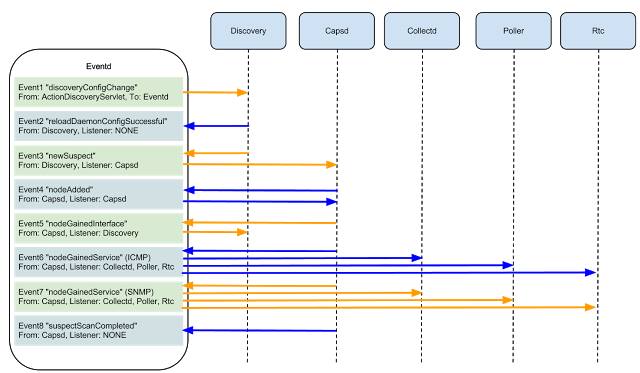
Image from oopsmonk
Let us dwell in more detail on the connections between services in OpenNMS, which start after the discovery of a new interface and the operation of newSuspect. There are two services that determine the availability of various services: capsd (capabilities daemon) and provisiond (provisioning daemon). By default, they are launched both, and for me it remains a mystery why this is done. After all, starting with version 1.8.0, capsd is deprecated, although it retains a higher priority than provisiond.
Therefore, my personal recommendation is to disable capsd, shifting all the care of finding services onto the shoulders of provisiond. Working with the latter provides access to provisioning requisitions, which allow you to flexibly configure defined services, automatically enable monitoring of the necessary interfaces on nodes, sort nodes by categories, etc.
The service is directly defined by the detectors that are part of the provisiond. Detectors only deal with the detection and registration of services within the interface, and pollerd is responsible for collecting information. In earlier versions of the system, collectd and pollerd were involved in data collection and processing; the first collected values for graphs, and the second processed the values upon request. Then Collectd was integrated into Pollerd and the hassle with the configuration became smaller, although in some places you can still come across both concepts, which can cause some confusion.
Closing the data processing chain are policies that define the rules that apply to nodes that fall under certain initialization conditions. Three are currently available: MatchingIpInterfacePolicy, MatchingSnmpInterfacePolicy, NodeCategorySettingPolicy. Their names speak for themselves and the application of policies allows you to control the mechanics of obtaining information from the desired interfaces. As an example:
- Using MatchingSnmpInterfacePolicy, you can enable forced collection of information from interfaces that have a specific word in the description (for example, [mon] ).
- Using NodeCategorySettingPolicy send all D-Link switches to a separate category.
- With MatchingIpInterfacePolicy, we disabled the collection of information from port 80 from all switches located on the same subnet. In the case of switches, an HTTP response timeline is not needed - there is always an ICMP response and data from interfaces that specify the magic word [mon]
Conclusion
Stability. The only serious glitch in the system was detected during the “Leap Second Failure”. And then, it affected the database system, not OpenNMS itself. Otherwise, not a single gripe of stability for several years of work.
Complexity. The system is complex and complex. It is easy to use from the point of view of support - everything is beautiful, clear and there is even a client for an iPhone [x]. But the tuning process (especially for the first time) can easily burn a lot of nerve cells. The documentation covers almost all the basic aspects of the system, but it is worth noting an unpleasant feature - many articles contain information for previous versions. Logically, the reasons for this are understandable: maintaining relevance for such an integrated system is not an easy task. But this does not simplify our life at all.
Flexibility.Having understood the system, you can connect your events, ladders and modules for monitoring. If the equipment gives any parameters via SNMP or HTTP - it can be monitored. Data storage in RRD allows you to flexibly customize the appearance of graphs (which by default do not shine with beauty) in the usual RRDTool syntax. Exceeding thresholds is handled in the form of notifications and alarms. External systems can receive data from OpenNMS via ReST or directly from the database.
I will not be able to answer the questions “Why not% systemname%?” And deliberately did not undertake a comparative analysis of different monitoring systems - after a long work with one system and a certain binding to its functionality, an unbiased review would not work, and such resources work would take too much. I’ll be happy to answer questions about the system itself, and if the topic is more or less relevant, then in the course of this introductory material you can write examples of user cases.