KDD 2018, second day, seminars

Today at the KDD 2018 seminar day - along with a large conference that will start tomorrow, several groups gathered listeners on some specific topics. I visited two such get-togethers.
Time Series Analysis
In the morning I wanted to go to a seminar on analysis of graphs , but he was detained for 45 minutes, so I switched to the next one, according to the analysis of time series. Unexpectedly, a blonde professor from California opens the seminar with the theme “Artificial Intelligence in Medicine”. Strange, because for this separate track in the next room. Then it turns out that she has several graduate students who will talk about time series here. But, in fact, to the point.
Artificial Intelligence in Medicine
Medical errors - the cause of 10% of deaths in the United States, this is one of the three main causes of death in the country. The problem is that there are not enough doctors; those that are there are overloaded, and computers, rather, create problems for doctors, than they solve, at least, doctors perceive it that way. In this case, most of the data is not really used for decision making. All this must be fought. For example, one bacterium Clostridium difficilecharacterized by high virulence and drug resistance. Over the past year she has done $ 4 billion in damage. Let's try to assess the risk of infection based on a time series of medical records. Unlike previous works, we take a lot of signs (10k-vector for each day) and build individual models for each hospital (in many respects, apparently, a necessary measure, since all hospitals have their own data set). As a result, we obtain an accuracy of about 0.82 AUC with a CDI risk prediction in 5 days.
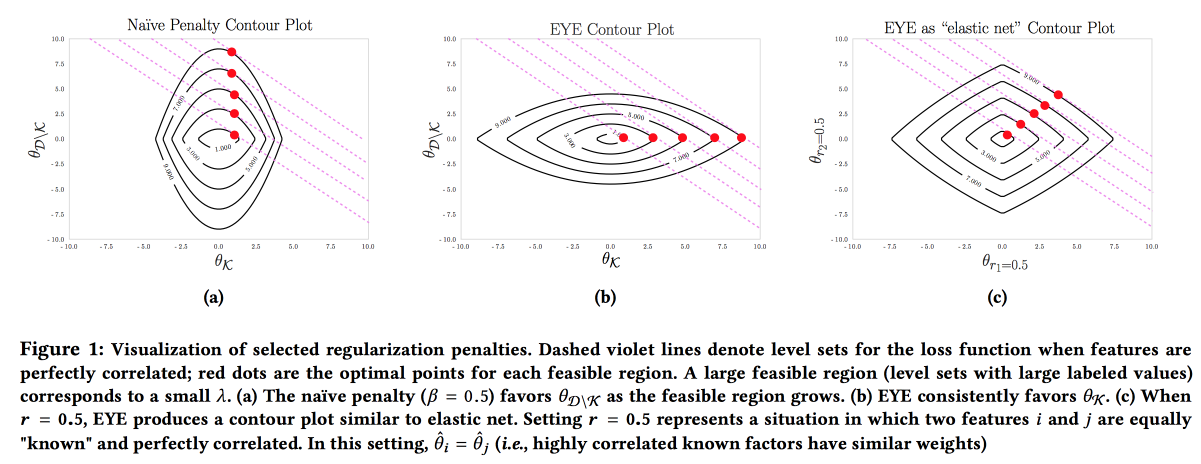
It is important that the model is accurate, interpretable and stable, it is necessary to show what we can do to prevent the disease. Such a model can be constructed by actively using knowledge from the subject area. It is the desire for interpretability that often reduces the number of features and leads to the creation of simple models. But even a simple model with a large feature space loses its interpretability, and the use of L1-regularization often leads to the fact that the model randomly selects one of the collinear features. As a result, doctors do not believe the model, despite the good AUC. The authors propose to use a different type of regularization EYE(expert yield estimate). Taking into account whether there is known data on the impact on the result, it turns out to focus the model on the necessary features. It gives good results, even if the expert screwed up, moreover - by comparing the quality with standard regularizations, one can estimate how right the expert is.
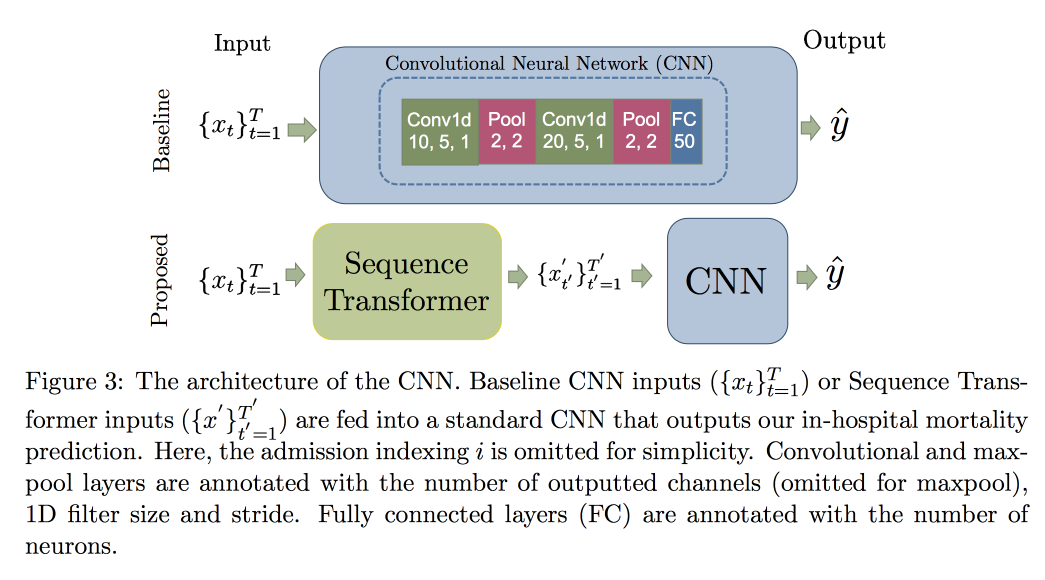
Next, go to the analysis of time series. It turns out that in order to improve the quality in them, it is important to look for invariants (in fact, to lead to some canonical form). In a recent article, a group of professors proposed an approach based on two convolutional networks. The first, Sequence Transformer, brings the series to a canonical form, and the second, the Sequence Decoder, solves the classification problem.
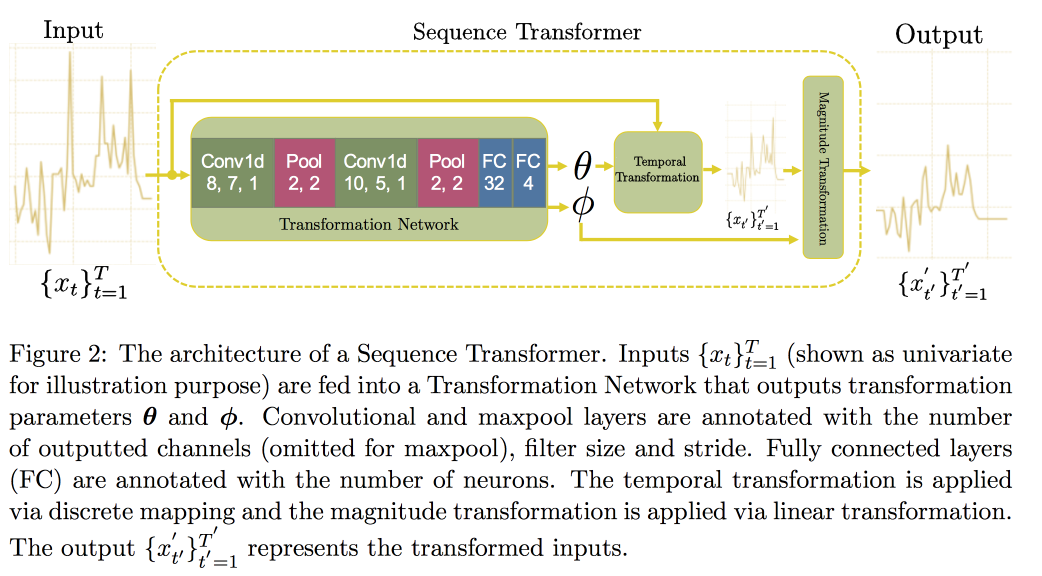
The use of CNN, and not RNN, is explained by the fact that they work with rows of fixed length. Checked onMIMIC , tried to predict death in the hospital for 48 hours. As a result, an improvement of 0.02 AUC compared to a simple CNN with additional layers was obtained, but the confidence intervals overlap.
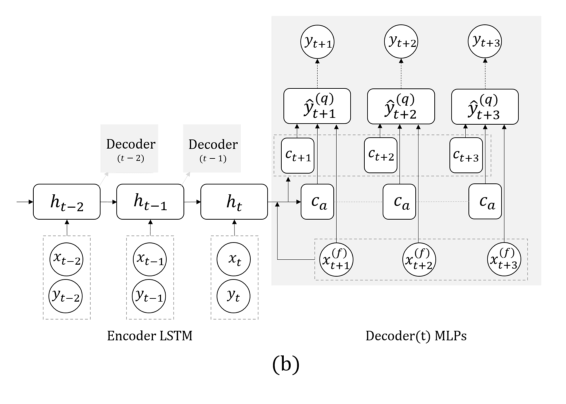
Now, another task: we will predict exclusively on the basis of the series itself, without external signals (that they ate, etc.). Here, the team proposed replacing the RNN for forecasting a few steps ahead with a grid with several outputs, without recursion between them. The explanation for this solution is that the error does not accumulate during recursion. Combine this technique with the previous one (search for invariants). Immediately after the professor’s speech, the postdoc spoke in detail about this model, so here we’ll end here, noting only that during validation it is important to look not only at the general error, but also at the classification of dangerous cases of too high or low glucose.
Threw a question about the feedback model: while it is a sore open question, they say that we should try to understand what changes in the distribution of signs occur as a result of the fact of intervention, and what - the natural changes caused by external factors. Actually, the presence of such shifts greatly complicates the situation: it is impossible not to retrain the model, as the quality degrades, mix randomly (it’s not ethical to check someone’s death and check if it’s dying), it’s guaranteed to bias ...
Sample path generation
An example of how not to make presentations: very quickly, it's hard to even hear, and getting an idea is almost impossible. The work itself is available here .
The guys are developing their previous forecasting result a few steps ahead. There are two main ideas in the previous work: instead of TIN, we use a network with several outputs for different points in time, plus instead of concrete numbers, we try to predict distributions and estimate quantiles. This is called all MQ-RNN / CNN (Multi-Horizont forecasting Quantile regression).
This time they tried to clarify the forecast using postprocessing. Considered two approaches. As part of the first, we are trying to “calibrate” the distribution of the neural network using a posteriori data and learning the covariance matrix of the outputs and observations, the so-called Covariance Shrinkage. The method is quite simple and working, but I want more. The second approach was to use generative models for constructing a “sample path”: using a generative approach for forecasting (GAN, VAE). Good, but unstable results were obtained using WaveNet, which was developed to generate sound .
Graph Structured Networks
Interesting work on the transfer of "knowledge about the domain" in the neural network. Shown on the example of forecasting the level of crime in space (by regions of the city) and time (by day and time). The main difficulty: a strong sparseness of data and the presence of rare local events. As a result, many methods work poorly, on average for the day, it is still possible to guess, but for specific areas and hours it is not. Let's try to combine high-level structure and micro-patterns in one neural network.
We build a communication graph by postal codes and determine the effects of one on the other using the Multivariate Hawkes Process . Further, on the basis of the graph obtained, we build the topology of the neural network, linking the blocks of regions of the city, the crime in which showed a correlation.
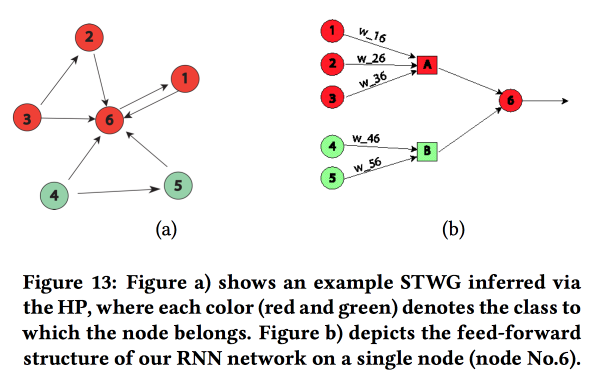
We compared this approach with two others: train on a grid per area or on a grid per group of areas with similar crime rates, showed an increase in accuracy. For each region, a two-layer LSTM with two fully connected layers is introduced.
In addition to the crimes, examples of work on traffic prediction were shown. Here, the graph for network construction is taken geographically according to kNN. It is not completely clear how far their results can be compared with others (the metrics in the analysis were rather freely changed), but on the whole, the heuristics for building a network looks adequate.
Nonparametric approach for ensemble forecasting
Ensembles are a very popular topic, but how to deduce the results from individual predictions is not always obvious. In their work, the authors propose a new approach .
Often the simple average in ensembles works well, even better. than newfangled Bayesian model averaging and averaging-nn. Regression is also not bad, but often gives strange results in terms of the choice of weights (for example, some predictions will give a negative weight, etc.). In fact, the reason for this is often that the aggregation method uses some assumptions about how the prediction error is distributed (for example, according to Gauss or normal), but when it is applied, it is forgotten to check the fulfillment of this assumption. The authors attempted to propose an approach free of assumptions.
We consider two random processes: the Data Generation Process (DGP) models reality and may depend on time, and the Forecast Generation Process (FGP) models forecasting (there are many of them, one for each participant in the ensemble). The difference of these two processes is also a random process, which we will try to analyze.
- Collect historical data and build error distribution density for predictors using Kernel Density Estimation.
- Next, we build the forecast and turn it into a random variable by adding the constructed error.
- Then we solve the problem of maximizing likelihood.
The resulting method is almost like EMOS (Ensemble Model Output Statistics) with a Gaussian error and much better with a non-Gaussian one. Often in reality, for example, ( Wikipedia Page Traffic Dataset ) is a non-Gaussian error.
Nested LSTM: Modeling Taxonomy and Temporal Dynamics in a Location-Based Social Network
The work is presented by authors from Google. We are trying to predict the next user check. using his recent chekin history and metadata of places, first of all their relationship to tags / categories. The categories are three-level, we use two upper levels: the parent category describes the user's intention (for example, the desire to eat), and the child one - the preferences of the user (for example, the user likes Spanish food). The child category of the next checkin must be shown to generate more revenue from online advertising.
We use two nested LSTMs: the top one, as usual, according to the sequence of check-ins, and the nested one - according to the transitions in the category tree from parent to child.
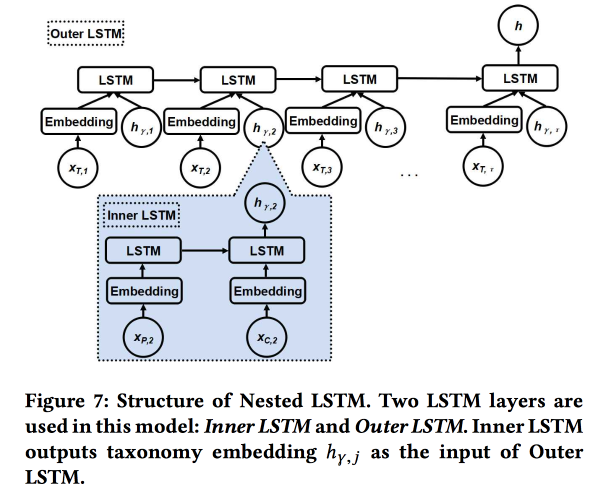
It turns out 5-7% better compared to simple LSTM with raw category embeddings. In addition, we showed that LSTM transition embeddings in the category tree look more beautiful compared to simple ones and cluster better.
Identifying Shifts in Evolutionary Semantic Space
Enough vigorous performance of the Chinese professor . The point is to try to understand how words change their meaning.
Now everyone successfully trains embedings of words, they work well, but being trained at different times for comparison is not suitable - it is necessary to do alling.
- You can take the old for initialization, but it does not guarantee.
- You can learn the transformation function for aligning, but this is not always the case, since the dimensions are not always separated in the same way.
- And you can use topological, not vector space!
As a result, the essence of the decision: we construct a kNN-graph by neighbors of the word in different periods to assess the change in meaning, and we are trying to understand whether there is a significant change here. For this we use the model of Bayesian Surprise . In fact, we are looking at the KL-divergence of the distribution of the hypothesis (prior) and hypotheses under the condition of observations (posterior) - this is a surprise. With words and KNN-graphs, we use Dirichlet based on the frequencies of neighbors in the past as the prior distribution and compare it with the real multinomial in recent history. Total:
- We cut the story.
- We build embeddings (LINE with preservation of initialization).
- We consider kNN on embeddings.
- We appreciate the surprise.
Validating, taking two random words with the same frequency, and changing each other - the increase in quality from surprise is 80%. Then we take 21 words with known drifts of meaning and see if we can find them automatically. In open sources, while a detailed presentation of this approach is not, but there is a SIGIR 2018 .
AdKDD & TargetAd
After lunch, moved to a seminar on online advertising. There are much more speakers from the industry and everyone is thinking about how to make more money.
Ad Tech at AirBnB
Being a large company with a large DS-team, AirBnB invests quite a lot in correctly advertising itself and its internal proposals on external sites. One of the developers talked a bit about the problems that arise.
Let's start with advertising in a search engine: when searching for hotels on Google, the first two pages are advertising :(. But the user often doesn’t even understand this, because advertising is very relevant. Standard scheme: match requests for advertising by keywords and extract meaning by patterns / patterns ( city, cheap or luxury, etc.)
After the candidates are selected, we arrange an auction between them (now Generalized Second Price is used everywhere)). When participating in an auction, the goal is to maximize the effect with a fixed budget, using a model with a combination of probability of click and income: Bid = P (click | search query) * booking value. An important point: do not spend all the money too quickly, so add Spend pacer.
In AirBnB, a powerful system for A / B tests, but here it does not apply, as it drives most of the Google process. They promised to add more tools for advertisers, the big players are waiting.
Separate problem: contact of the user with advertising in several places. We travel on average a couple of times a year, the trip preparation and booking cycle is very long (weeks or even months), there are several channels where we can reach the user, and we need to divide the budget by channel. This topic is very patient, there are simple methods (linear, balanced, by the last click or by the results of the uplift test ). AirBnB tried two new approaches: based on Markov models and Shapley models .
Everything is more or less clear with the Markov model: we build a discrete chain, the nodes at which correspond to the points of contact with the advertisement, there is also a node for conversion. According to the data we select the weights for the transitions, we give more nodes to those nodes where the transition probability is greater. He threw the question to them: why use a simple Markov chain, whereas it is more logical to use MDP; They said that they were working on this topic.
More interesting with Shapley: in fact, this is a long-known scheme for evaluating an additive effect, in which different combinations of effects are considered, the effect from each of them is evaluated, and then an aggregate is determined for each individual impact. The difficulty is that between synergies there can be synergy (more rarely antagonism), and the result from the sum is not equal to the sum of the results. In general, quite an interesting and beautiful theoryI advise you to read .
In the case of AirBnB, using the Shapley model looks like this:
- We have examples in the observed data with different combinations of effects and the actual result.
- Fill in the data gaps (not all combinations are represented) using ML.
- We calculate the loan for each type of impact on Shapley.
Microsoft: Pushing {AI} Boundaries
A little more about that. how they are engaged in advertising at Microsoft, now from the side of the platform, first of all, Bing. A few nobles:
- The advertising market is growing very fast (exponentially).
- Advertising on one page cannibalizes each other, it is necessary to analyze the entire page.
- Conversion on some pages above, despite the fact that STR is worse.
The Bing advertising engine has about 70 models, 2000 experiments offline, 400 online. One major change in the platform every week. In general, they work tirelessly. What are the changes in the platform:
- The myth of a single metric: it does not work out so that metrics grow and compete.
- They have altered the system of ad matching to requests from NLP to DL, which is cheated on FPGA.
- They use federated models and context gangsters: internal models produce probability and uncertainty, the gangster from above makes a decision. They talked a lot about gangsters, use them to start models and launch at cruising speed, bypassing with their help the fact that often improving a model leads to lower incomes :(
- It is very important to assess the uncertainty (well, yes, without it the gangster cannot be built).
- For small advertisers, the institution of advertising through bandits does not work, there is little statistics, you need to make separate models for a cold start.
- It is important to monitor the performance on different cohorts of users, they have an automatic system for slicing according to the results of the experiment.
We talked a little about the analysis of the outflow. It is not always hypothesis salespeople about the causes of the outflow are correct, it is necessary to dig deeper. To do this, you have to build interpreted models (or a special model to explain the predictions) and think a lot. And then conduct experiments. But it is always difficult to make experiments with outflow; they recommend using second-order metrics and an article from Google .
They also use such a thing as Commercial Knowledge Graph, representing the description of the subject area: brands, products, etc. Build a graph completely automatically, unsupervised. Brands are labeled by categories, this is important, as in general it is not always possible to unsupervised to single out the brand as a whole, but within the framework of a category-topic the signal is stronger. Unfortunately, I did not find any open works according to their method.
Google Ads
Tells the same dude that yesterday talked about the graphs, all the same sad and arrogant. Walked through several topics.
Part One: Robust Stochastic Ad Allocation. We have budget nodes (ads) and online nodes (users), and there are also some weights between them. Now you have to choose which advertisements to show the new node. You can do this greedily (always at the maximum weight), but then we risk developing a budget prematurely and getting an inefficient solution (the theoretical limit is 1/2 of the optimum). You can fight this differently, in fact, here we have the traditional conflict of revenu and wellfair.
When choosing an allocation method, one can assume a random order of appearance of online nodes in accordance with a certain distribution, but in practice there can also be an adversarial order (that is, elements of some opposing influence). The methods in these cases are different, give references to their latest articles: 1 and 2 .
Part Two: Inceptive-aware learning / Robust Pricing. Now we are trying to solve the issue of choosing the price of a reservation to increase the revenue of advertising sites. We also consider the use of other auctions such as Myerson auction , BINTAC , rollback to the auction of the first price when it hits the reservation. Do not go into details, send to your article .
Part Three: Online Bundling. Again we solve the problem with an increase in income, but now we are entering from the other side. If you could buy wholesale advertising (offline bundling), then in many situations you can offer a more optimal solution. But it is impossible to do this in an online auction, it is necessary to build complex models with a memory, and in the harsh conditions of RTB this cannot be crammed.
Then a magic model appears, where all memory is reduced to a single digit (bank account), but time is running out, and the speaker begins frantically flipping through slides. For answers, in his best style, sends to the article .
Deep Policy optimization by Alibaba
We work with “sponsored search”. We decided to use RL, as the name implies - deep. Detailed information can be found in the article .
One of the important points was told about the division of the offline-part of the training, where the deep network itself is trained, and the online-part, where the adaptation of the signs takes place.
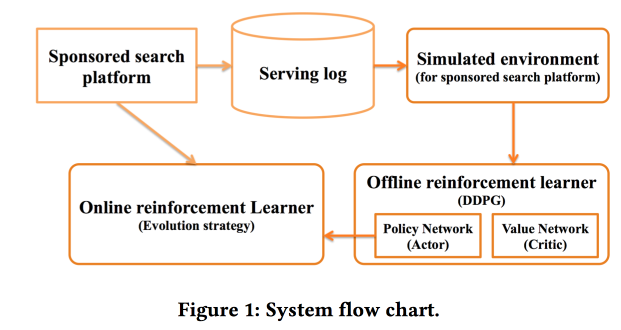
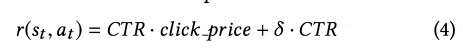
As a reward, a mixture of CTR and income is used, the DDPG model is used .
At the end, the speaker addressed three open-ended questions to the audience, “to think about”:
- There is no real environment for RL.
- A lot of noise in reality, which greatly complicates the analysis.
- How to work with a changing environment?
Criteo Large Scale Benchmark for Uplift Modeling
Again we return to the task of identifying aplift (the effect of a particular impact among many). In Criteo, to analyze the approaches to solving the problem, they made a new dataset Criteo-UPLIFT1 (450 MB) and drove the benchmark.
The idea is quite simple. There is an initial desire to buy something, perhaps the user would have bought without treatment (he recovered). We look at the difference of two conditional probabilities with and without treatment - this is uplift (remember that we are looking at a particular user).
How to evaluate such a model? Let's look at the situation as a ranking task. For some reason, going to the ranking, we introduce a strange estimation model - take the uplift cumulative in rank with our ranking and random order, compare the area between the curves (AUUC). We also look at the Qini coefficient( Gini generalization for uplift) can be compared with the ideal Qini, and not random.
Tested in the framework of the benchmark two approaches. In the first case, we train two models: one on the treatment group, the other on the non-treatment group to predict probability. We rank by delta forecasts.
Another approach was called revert label. Redesigned datasets so that the units are those who received treatment and converted, as well as those who did not receive and did not convert; the remaining zeros. We rank, putting up those who look like units.
According to the results of the benchmark, in terms of visits, the model with reverser works better. With conversions, improvement is achieved as data increases.
Deep Net with Attention for Multi-Touch Attribution
How to work with many channels, this time from Adobe . We immediately discard simple models and begin to learn, of course, the grid! And not just a grid, but with a attention-layer on top of LSTM, just to simulate the contribution of individual sources. To simulate static features, add a fully connected mesh of several layers next to LSTM, and get the best result.
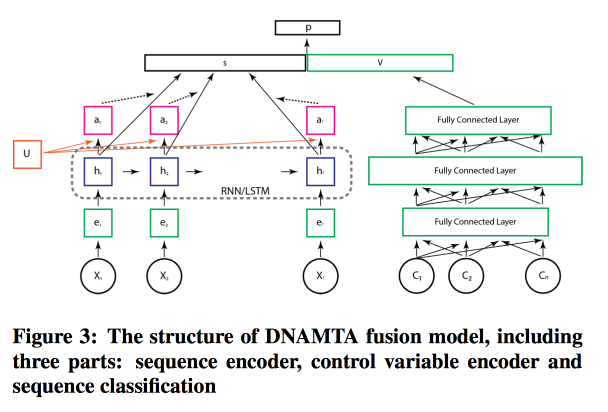
In general, the model does not look so crazy, and the attention-layer really gives a chance for the model to be interpretable.
Conclusion
Then there was a pretentious opening session with an IMAX-roller in the best traditions of trailers for blockbusters, many thanks to everyone who helped to organize everything - a record KDD in all respects (including $ 1.2 million sponsorship), a farewell from Lord Byts (Minister of Innovation) Development UK) and poster session, which has no strength left. We must prepare for tomorrow.