December 19, 2012 at 17:05
7 New Intel® VTune Amplifier XE Features

VTune Amplifier XE has long been known to users for its in-depth analysis of software performance, both at the application level and at the microarchitectural level.
The tool does not stand still and is actively developing, improving and acquiring new functionality. This post provides a brief overview of the new "features" that appeared both in VTune Amplifier XE 2013, released in September, and most recently, in subsequent updates:
- Cycle analysis
- Text search
- Energy efficiency analysis
- EBS analysis with stacks
- Java Application Profiling
- API for custom tasks
- Command Line Improvements
Cycle analysis
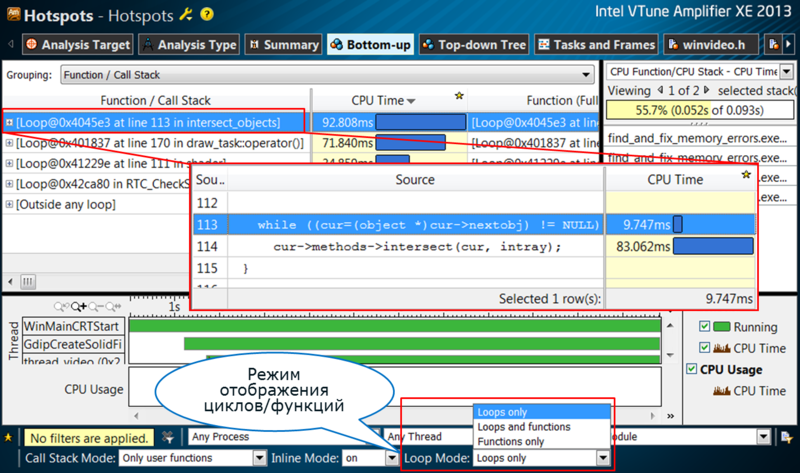
As you know, the optimization of high-performance computing is often built around loops - here, parallelization, and redistribution of data for optimal use of the cache, and vectorization. VTune Amplifier XE 2013 update 3 can determine which “hot spots” are actually “hot cycles”. Now the user can concentrate on optimizing them, and not on searching for cycles in the source code, plus to evaluate the effect of optimizing each specific cycle from start to start.
Text search
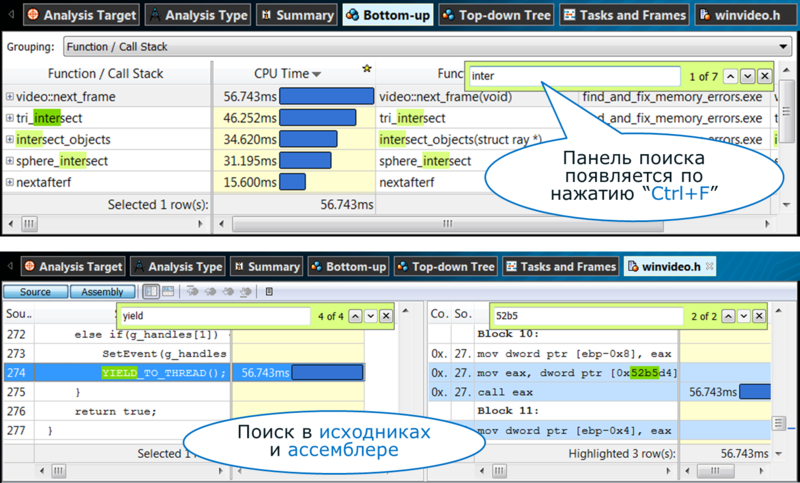
VTune Amplifier XE profiling results can be quite voluminous, and it can be difficult to immediately find the function / module / synchronization object that you are interested in, etc.
Now users can finally use a simple text search in all the main windows: bottom-up, top-down, source view, assembly view.
Energy efficiency analysis
The energy efficiency of applications is becoming increasingly important. After all, not only the hardware, but also the software is to blame for the waste of energy. VTune Amplifier XE 2013 introduced two new types of analysis in this area (so far only available for Linux).
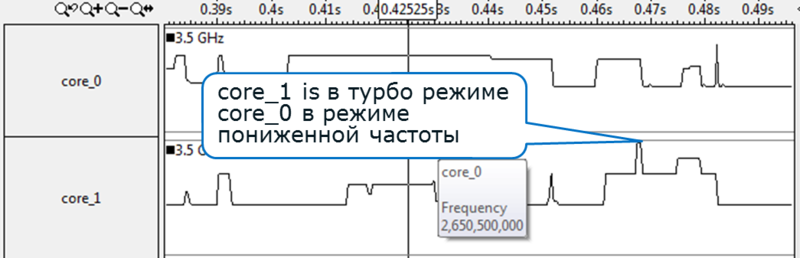
Analysis of the CPU Frequency allows you to track the change in clock frequency during program execution on all cores. This gives an assessment of active energy consumption, in order to then play with frequency changing technologies: Turbo Boost, SpeedStep, etc.
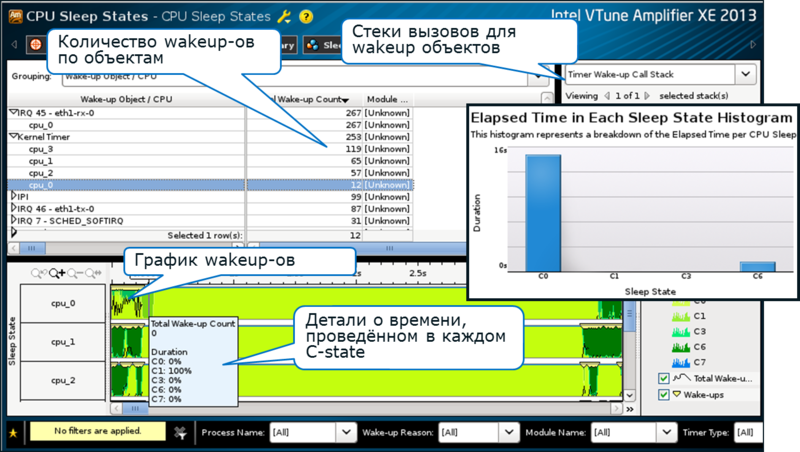
Analysis of the Sleep States CPU provides estimates of passive power consumption - the transition across C-states. It tracks “wake-ups” - “awakenings”. Moving to a deeper C-state and getting out of it have costs, so if this happens too often, it makes sense to think about changing the situation. Analysis of the Sleep States CPU shows the frequency of state transitions, the statistics of being in different states, and most importantly, objects that cause unwanted "awakenings" - for example, timers:
EBS analysis with stacks
VTune Amplifier XE uses two main profiling approaches. The first is based on the binary instrumentation of the process being analyzed and is called “user level analysis”. The second approach (EBS analysis) does not work with the process, but with the PMU module in the processor, which allows you to profile not only user applications, but also the operating system and drivers. In addition, one can find the "microarchitectural" problems of software.
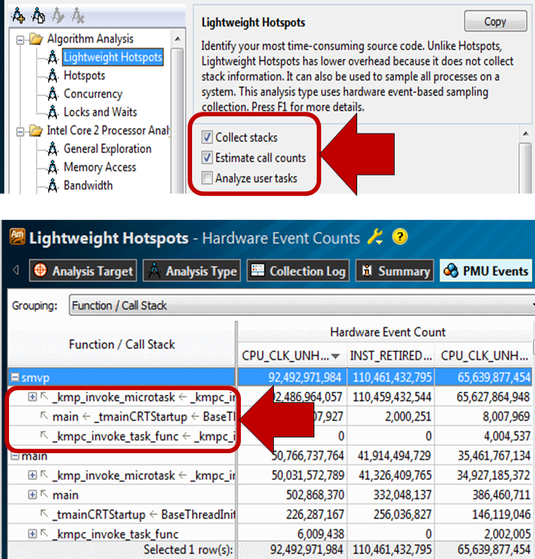
Prior to the release of the 2013 version of EBS, analysis allowed finding functions and their code, but not call stacks. This was inconvenient if, for example, a system function turned out to be a “hot spot” - it was not easy to find the user code responsible for this. Since 2013, EBS-based analyzes have also provided call stacks. Now you can trace the path from system calls and drivers to your application, if it is involved.
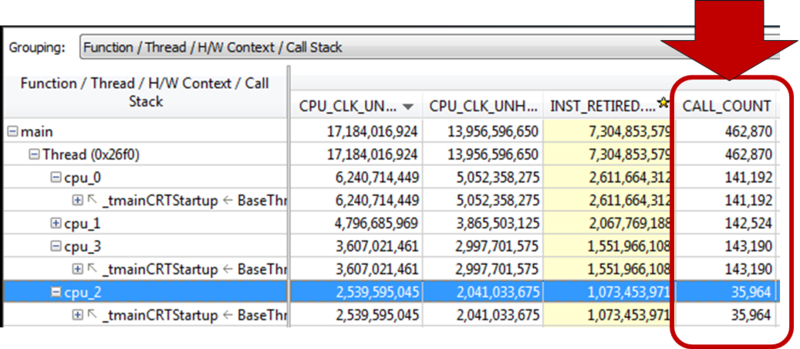
Another nice point is the statistical calculation of the number of function calls. Now you can not only see the total time spent on the execution of the function, but also evaluate how it is formed - often, but by little, or vice versa.
Java Application Profiling
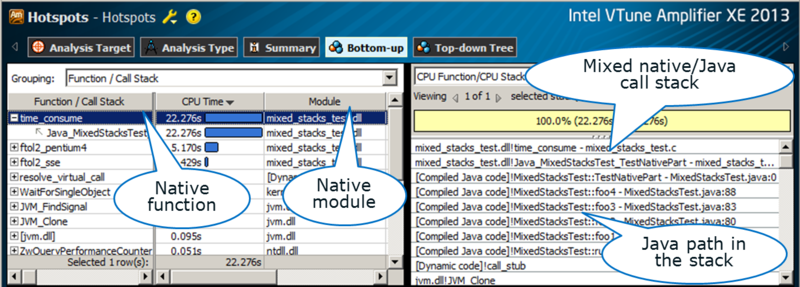
Starting in 2013, VTune Amplifier XE supports Java application profiling. This can be especially useful for analyzing "mixed" code that combines Java and calls to "native" modules (for example, to perform heavy computing). In addition, the profiler allows you to detect microarchitectural problems in Java code, for example, inefficient use of the cache. Read more in this article (in English).
API for custom tasks
Many parallel applications are built on "tasks" - small logical elements of work executed by threads. For example, Intel Threading Building Blocks is built on tasks.
The API provided by VTune Amplifier XE (__itt API) has recently been replenished with a markup tool for such tasks:
void do_foo(double seconds);
DWORD WINAPI work (void *pArg) {
	 __itt_task_begin (domain, __itt_null, __itt_null, UserSubTask);
	do_foo (1);
	__itt_task_end (domain);
	return 0;
}
int main() {
	int i = 0;
	HANDLE hThread [NUM_THREADS];
	__itt_task_begin (domain, __itt_null, __itt_null, UserTask);
	do_foo (0.3);
	for (i = 0; i < NUM_THREADS; i++)
	{
		hThread[i] = CreateThread ( NULL, 0, work, (void*)i, 0, 0 );
	}
	WaitForMultipleObjects (NUM_THREADS, hThread, TRUE, INFINITE );
	__itt_task_end (domain);
	return 0;
}
Now user tasks can be tracked through grouping “Task Type / Function / Call Stack" and the Tasks window:


Read more about the task API in this post .
Command Line Improvements
VTune Amplifier XE is not only a
$ amplxe-cl -R hotspots -report-width=100 -r r004ccFor fans of GNU gprof, a new format for presenting results has appeared, in the gprof format:
$ amplxe-cl -report gprof-cc -r r001hsWhen creating your own EBS analysis with the set of events you need, you may need to run it on another machine. If it does not have a graphical interface, you can copy the command line. Until recently, together with such non-standard analysis, it was necessary to copy the configuration file, which required additional steps, to figure out how to use this file, etc.
In the latest VTune Amplifier XE updates, this has become easier - all parameters are contained on the command line. Just press the “Command line” in the GUI and copy the generated line to the remote machine. No additional files needed.

Summary
All seven new features described in the post are available in the latest version of Intel VTune Amplifier XE 2013 update 3 - download, try, enjoy. The trial version can be downloaded from the official site .