The principle of 20/80 on an example of Habr
Somehow it became interesting whether the Pareto Law acts on such a self-regulated resource as Habr . I’ll briefly recall that the Pareto law is the “20/80 Principle” in this case, it can be interpreted that 20% of users bring 80% of the result. And since our resource has a very accurate method of evaluating user results based on the opinions of a diverse, independent, decentralized crowd. Why not take it into account. About the evaluation method, we read the book “The Wisdom of the Crowd” by James Shurovieschi (it seems to me that every Khabarovsk citizen should know about it). The values of karma (the total result of activity for all the time according to other users) and rating(the result of activity over the past 50 days according to synthetic algorithms of the Habr).
To obtain data, statistics were taken from gabbered and grubby users. This rating includes a list of only those users who have done at least something for the Habr, and not just registered, so we will consider it quite relevant. Having applied some programming knowledge, I parsed data from the site. I think that for this article the method will not play a special role, maybe if it will be interesting then I will write separately. As a result, I got a list of users with their current karma and rating. So it was processed.
Beauty picture:

In the calculations, 24049 users were taken into account. Of these, the total positive karma was 190,371.89; the total positive rating was 229,145.98. Only positive values were taken because they are most suitable for the concept of result. Of all non-zero users, 20% is 4810 and for them the sum of karma and rating is 150318.87 and 188463.37, respectively. It should be noted that the amounts are taken separately sorted in decreasing order of karma and rating (top hubs)
Now, dividing the values, we get a result close to 80% with an error of ± 3%, which allows us to talk about the presence of dependency (formulas are clickable)
For karma For rating Well this is what the Pareto law foreshadowed us. But what other parameters apply to 20% of users?

So, the total rating and karma of all users (including the minuses) are 150,403.63 and 186,244.84, respectively, which with the naked eye coincides with the total values for 20%. But still count.
For karma For rating We accept the hypothesis with an error of ± 3%. We can say a little pathetic, incredibly 20% of top users in total have the same amount of karma and rating as all users, taking into account the “lagging behind”. Those. we can say that the lagging ones cancel each other and it can be assumed that the same thing happens in other systems. Well, what about the average.

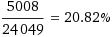
The values of average positive karma and average positive rating were found for all users of 7.92 and 9.53, respectively. The number of users with a rating> = average value turned out to be 5449 and 5008, respectively. Which is compared with the total number of non-zero users.
For karma For rating Total 20% of users have a rating or karma above average positive (i.e. productive) with a deviation of ± 3%. The effect of negative values for karma and rating was also observed. It consists in the fact that in total all negative karma and negative rating make up 20% of the sum of positive values. In total, all negative karma and rating are -39968.26 and -42901.14. While the positive values are 190371.89 and 229145.98.
For karma For rating That is 20% with a given error of ± 3%. To everything written above, I am attaching a document in a progressive format with the initial data. Results. Xlsx Obviously, the values change dynamically so these data can become outdated :) Of course, for complete statistics, you need to take data periodically for a long period of time. But parsing html is not good for this. And the question of removing this data is better than Chip and Dale, no one will solve this. Probably the shift of the relations can be correlated with some events or have a cyclical character. Also, the results should by no means be regarded as an immutable law of nature with specifically specified numerical parameters. All calculations are purely

empirical . Also, if we talk about leaving only 20% of useful users, then according to the Pareto law, they will eventually be divided according to the 20/80 rule.
Of all the calculations, we can confirm the fact that: “Most successful events are due to the action of a small number of highly productive forces; most of the trouble is due to the action of a small number of highly destructive forces. ”
You can also say that on average, out of every 5 users invited to the hub, only 1. will be useful for the hub.
At the request of the comments, the logarithmic graph of the distribution of karma and rating for lists sorted in descending order. Horizontal scale means a place in the ranking. For a blue chart, a place in the ranking by karma (from larger to smaller). Similarly for red.

Direct on the red graph of the rating from 10,867 to 12,631 places means a large number of users with a rating of 2.
And a partially coinciding direct blue graph from 11573 to 12,603 places means Khabarovsk residents with karma 2. Where so many people with karma and rating 2 are silent about. But it can be a reason for new research)
For those who read only the beginning and the end:
Brief conclusions with an error of ± 3%:
To obtain data, statistics were taken from gabbered and grubby users. This rating includes a list of only those users who have done at least something for the Habr, and not just registered, so we will consider it quite relevant. Having applied some programming knowledge, I parsed data from the site. I think that for this article the method will not play a special role, maybe if it will be interesting then I will write separately. As a result, I got a list of users with their current karma and rating. So it was processed.
Beauty picture:
In the calculations, 24049 users were taken into account. Of these, the total positive karma was 190,371.89; the total positive rating was 229,145.98. Only positive values were taken because they are most suitable for the concept of result. Of all non-zero users, 20% is 4810 and for them the sum of karma and rating is 150318.87 and 188463.37, respectively. It should be noted that the amounts are taken separately sorted in decreasing order of karma and rating (top hubs)
Now, dividing the values, we get a result close to 80% with an error of ± 3%, which allows us to talk about the presence of dependency (formulas are clickable)
For karma For rating Well this is what the Pareto law foreshadowed us. But what other parameters apply to 20% of users?
So, the total rating and karma of all users (including the minuses) are 150,403.63 and 186,244.84, respectively, which with the naked eye coincides with the total values for 20%. But still count.
For karma For rating We accept the hypothesis with an error of ± 3%. We can say a little pathetic, incredibly 20% of top users in total have the same amount of karma and rating as all users, taking into account the “lagging behind”. Those. we can say that the lagging ones cancel each other and it can be assumed that the same thing happens in other systems. Well, what about the average.
The values of average positive karma and average positive rating were found for all users of 7.92 and 9.53, respectively. The number of users with a rating> = average value turned out to be 5449 and 5008, respectively. Which is compared with the total number of non-zero users.
For karma For rating Total 20% of users have a rating or karma above average positive (i.e. productive) with a deviation of ± 3%. The effect of negative values for karma and rating was also observed. It consists in the fact that in total all negative karma and negative rating make up 20% of the sum of positive values. In total, all negative karma and rating are -39968.26 and -42901.14. While the positive values are 190371.89 and 229145.98.
For karma For rating That is 20% with a given error of ± 3%. To everything written above, I am attaching a document in a progressive format with the initial data. Results. Xlsx Obviously, the values change dynamically so these data can become outdated :) Of course, for complete statistics, you need to take data periodically for a long period of time. But parsing html is not good for this. And the question of removing this data is better than Chip and Dale, no one will solve this. Probably the shift of the relations can be correlated with some events or have a cyclical character. Also, the results should by no means be regarded as an immutable law of nature with specifically specified numerical parameters. All calculations are purely
empirical . Also, if we talk about leaving only 20% of useful users, then according to the Pareto law, they will eventually be divided according to the 20/80 rule.
Of all the calculations, we can confirm the fact that: “Most successful events are due to the action of a small number of highly productive forces; most of the trouble is due to the action of a small number of highly destructive forces. ”
You can also say that on average, out of every 5 users invited to the hub, only 1. will be useful for the hub.
At the request of the comments, the logarithmic graph of the distribution of karma and rating for lists sorted in descending order. Horizontal scale means a place in the ranking. For a blue chart, a place in the ranking by karma (from larger to smaller). Similarly for red.

Direct on the red graph of the rating from 10,867 to 12,631 places means a large number of users with a rating of 2.
And a partially coinciding direct blue graph from 11573 to 12,603 places means Khabarovsk residents with karma 2. Where so many people with karma and rating 2 are silent about. But it can be a reason for new research)
For those who read only the beginning and the end:
Brief conclusions with an error of ± 3%:
- 20% of residents have 80% of the total positive rating.
- 20% of Habrachians have 80% of all positive karma.
- 20% of the top habravchans have as much karma as the sum of all the karma of all habravchans.
- 20% of top habrach residents have the same rating as the sum of the rating of all habrach residents.
- 20% of residents have karma above average positive karma.
- 20% of residents have a rating higher than the average positive rating.
- The entire negative rating by volume is 20% of the positive.
- All negative karma by volume is 20% of positive.