Xdebug profiler log visualization tools
Probably many php developers use the xdebug profiler to find application bottlenecks. But just looking at the logs is not very convenient, so tools were created to visualize them. I want to briefly talk about these tools .
Webgrind
Webgrind is a set of php scripts that can be installed on a local or remote web server. Then everything is simple to indecent - we upload the log file and look at the statistics. Webgrind's most obvious plus is cross-platform and easy to install . Shows the list of functions that were called, the number of calls (Invocation Count), the total time spent on the call (Total Self Cost) and the total time spent on the execution (Total Inclusive Cost).
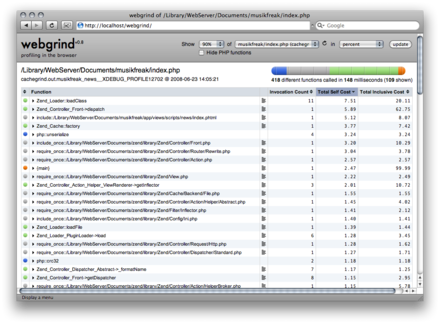
You can hide php functions. You can go inside the function to see detailed statistics.
KCachegrind
KCachegrind requires libraries of the third KDE to work. It will work on most Unix-like operating systems (it definitely works for me on Ubuntu and FreeBSD), as well as Windows (via Cygwin) and MacOS X (I did not check). This is probably the most functional and convenient tool for visualizing profiles from all available. You can see the function calls, time, and you can also see the call graph (very convenient) and the map (also sometimes convenient). WinCacheGrind .
WinCacheGrind is a stripped-down KCachegrind for Windows. You can of course try to run on a virtual machine under other OSs, but I see no reason. You can view function calls from the functionality, and you can also hide fast-running functions.

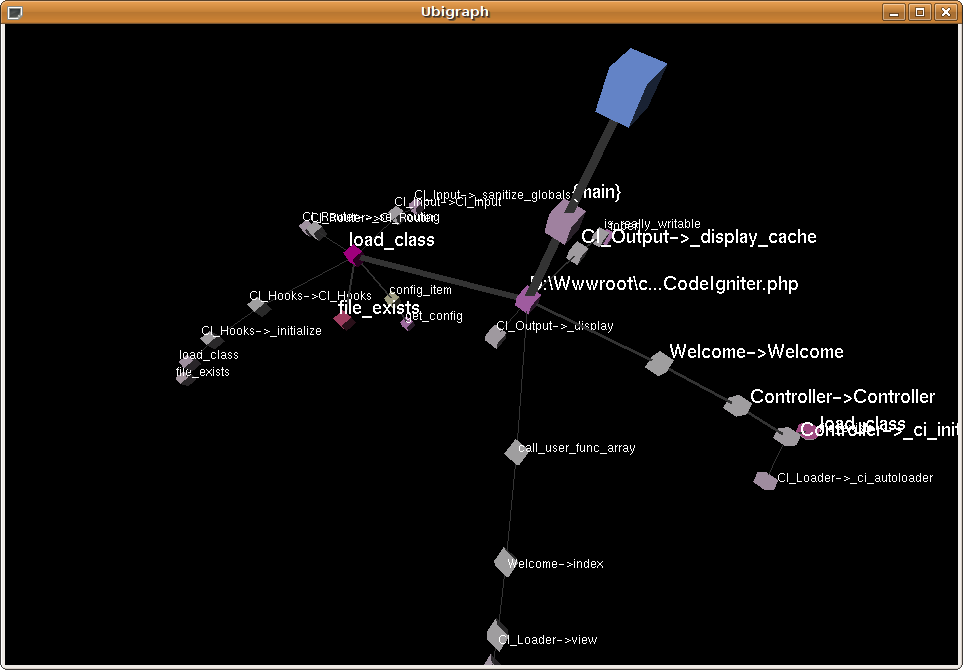
xdebugtoolkit
If you probably knew about the above tools, then you probably hear about xdebugtoolkit for the first time. I myself found out about him only a few months ago.
xdebugtoolkit allows you to visualize these graphs:

In general, if you really don’t want to pull KDE into KDE to install KCachegrind, then you can use xdebugtoolkit in conjunction with Webgrind.
MacCallGrind
Visualizer for MacOS X. I did not use it (it almost did not work with MacOS X). It looks like this:

Looks like WinCacheGrind externally. Judging by the description, the functionality is similar.
CachegrindVisualizer
About it literally just told me ftr . This is the domestic development of the Develar habrayuzer . Powered by Adobe AIR. The screenshot is very large, here is the link . And excerpt from the description:
It looks impressive. You will need to try to use. If someone has already worked - share your impressions.
Afterword
As I promised, the description is short . I have been working with most of these applications for a long time. Now I use KCachegrind as the most convenient and functional tool.
PS . In order to enable the profiler in xdebug you need to write "xdebug.profiler_enable = 1" in php.ini.
UPD . On Habré there is a translation of the article on profiling code using xdebug Profiling PHP Applications With xdebug . It details the work with WinCacheGrind and KCachegrind.
Webgrind
Webgrind is a set of php scripts that can be installed on a local or remote web server. Then everything is simple to indecent - we upload the log file and look at the statistics. Webgrind's most obvious plus is cross-platform and easy to install . Shows the list of functions that were called, the number of calls (Invocation Count), the total time spent on the call (Total Self Cost) and the total time spent on the execution (Total Inclusive Cost).

You can hide php functions. You can go inside the function to see detailed statistics.
KCachegrind
KCachegrind requires libraries of the third KDE to work. It will work on most Unix-like operating systems (it definitely works for me on Ubuntu and FreeBSD), as well as Windows (via Cygwin) and MacOS X (I did not check). This is probably the most functional and convenient tool for visualizing profiles from all available. You can see the function calls, time, and you can also see the call graph (very convenient) and the map (also sometimes convenient). WinCacheGrind .

WinCacheGrind is a stripped-down KCachegrind for Windows. You can of course try to run on a virtual machine under other OSs, but I see no reason. You can view function calls from the functionality, and you can also hide fast-running functions.
xdebugtoolkit
If you probably knew about the above tools, then you probably hear about xdebugtoolkit for the first time. I myself found out about him only a few months ago.
xdebugtoolkit allows you to visualize these graphs:
In general, if you really don’t want to pull KDE into KDE to install KCachegrind, then you can use xdebugtoolkit in conjunction with Webgrind.
MacCallGrind
Visualizer for MacOS X. I did not use it (it almost did not work with MacOS X). It looks like this:
Looks like WinCacheGrind externally. Judging by the description, the functionality is similar.
CachegrindVisualizer
About it literally just told me ftr . This is the domestic development of the Develar habrayuzer . Powered by Adobe AIR. The screenshot is very large, here is the link . And excerpt from the description:
CachegrindVisualizer builds a more informative graph than KCacheGrind - on the edge of the edge there is a label typed in a smaller font - this is the proper time (self time) spent on this function - the proper execution time of this particular call, and not all calls to this function.
It looks impressive. You will need to try to use. If someone has already worked - share your impressions.
Afterword
As I promised, the description is short . I have been working with most of these applications for a long time. Now I use KCachegrind as the most convenient and functional tool.
PS . In order to enable the profiler in xdebug you need to write "xdebug.profiler_enable = 1" in php.ini.
UPD . On Habré there is a translation of the article on profiling code using xdebug Profiling PHP Applications With xdebug . It details the work with WinCacheGrind and KCachegrind.