Using Oracle Database for Technical Market Analysis
This article is about Oracle Database, PL / SQL, SQL, MATCH_RECOGNIZE, MODEL clause, aggregate, and pipelined functions.
The technical analysis (TA) of the markets was used as a functional area. First, a small, superficial introduction to trading in markets, then calculations.
Technical analysis - a set of tools for forecasting likely price changes based on patterns of past price changes. Theoretically, Technical Analysis is applicable in any market. But the most widespread Technical analysis received in highly liquid free markets, for example, on exchanges.

Many SQL statements, procedures, and graphs have been developed. Part - below, full code - on GitHub at the link at the bottom of the article.
Technical Market Indicators (TIR) - additional charts for price charts, formed on the basis of recalculation of values contained in the base price chart . Usually these are different types of averaging (the next point of the chart is calculated as the average value of a number of previous price values, for example, a moving average), relationships (the next point is the result of comparing a number of previous prices - their difference, derivative of a change over a period), or lags ( delays). The indicators clearly show some non-obvious information contained in the statistics of price changes, and can form recommendations on trade orders - BUY / SELL. Indicators have at least one variable parameter, from the value of which the result will change.To open real transactions, usually several indicators are used in combination, plus additional information, at the discretion of the trader.
One of the postulates of the Technical Analysis is “history repeats itself”: Market participants in similar circumstances behave in approximately the same way, forming similar dynamics of price changes. And it is natural to assume that market behavior in the future will mainly repeat the patterns that have emerged in the past. Following this statement, the investor can choose from the possible parameters of the TIR those that have proven themselves best in past periods.
This article builds a graph of trade performance when using each indicator on the value of the TIR parameter, this is in a two-dimensional representation. But in fact, I will build in a three-dimensional representation in order to evaluate also the effect of the delay in the execution of the order on the result, so the parameter will be the X axis (abscissa), the delay will be the Y axis (ordinate), the result will be the Z axis (applicate). This is some attempt to evaluate the effect of “slippage”, which, unfortunately, always happens. Instead of real “slippage” along the Y axis, I postpone the execution of the BUY / SELL order for a period of 1 to 5 periods.
If a global maximum is highlighted on this graph and the graph itself will look like a hat (in general, it is called the “normal distribution”, but it assumes strict symmetry about the vertical axis), the cone, the pyramid are also suitable - it means you can select a certain parameter value for this , which will show the highest result, and with this indicator you can try to trade. If the performance chart, depending on the parameter, resembles a “stockade”, it is impossible to select the optimal parameter value and there is no point in using this TIR in trade.
We can say that in this article I only calculate the “hit percentage” of indicators. The problem, to evaluate how much you can "earn", I did not dare.
Successful completion of the described verification is one of the necessary, but not sufficient factors for effective trading.
For information ... In contrast to Technical Analysis, Fundamental Analysis (FA) is a term for designating methods for predicting the market (exchange) value of instruments based on the analysis of financial and production performance indicators.
The “intrinsic value” of the FA in most cases does not coincide with the company's share price, which is determined by the ratio of supply and demand in the stock market. Investors using FA in their activities, primarily interested in situations where the "intrinsic value" of the company's shares exceeds the price of shares on the exchange. Such shares are considered undervalued, which means their price will rise, and they are potential investment targets.
One of the best known investors using Fundamental Analysis is Warren Buffett.
Check out the trailer: https://www.youtube.com/watch?v=SqE8fnvmV1Y
Thus, we have two diametrically opposite approaches - TA and FA .
FA usually interests long-term investors, TA - short- and medium-term and is used for transactions of a speculative nature, when the trader himself is not interested in the subject of trade.
And the objectives of this article are two ...
In addition to the above discussions about TA and FA, I wanted to explore and show the capabilities of Oracle Database to perform calculations of Technical market indicators .
I present these opportunities to the readers' judgment.
If you decide to repeat my calculations - download the code from GitHub at the link at the bottom of the article. Code verified on version 12.2.0.1.
First create shared objects. The first are the tables and view. In the same file below is a transaction modeling package.
The second step is the creation of functions that perform the calculation of TIR .
The third step is the calculations.
All functions for calculating all TIRswill return a cursor with the following fields: STOCK_NAME, ADATE, ACLOSE (closing price of the day), AACTION (sell / buy order)
The package contains three tabular modeling functions that take the cursor from the TIR calculation functions described above , offset (delay in order execution, lag), and the initial capital, by default is 1000 USD. Package functions are called like this:
where XXXXXXXX is the name of the TIR .
All functions calculate the result of trading subject to full reinvestment of profits, excluding transaction costs and taxes, and excluding inflation and discounting.
The first function
The second function
In the last line of each instrument, you can see the result of trading for each instrument, as well as in the previous function, if the investor is “in securities”, the sale is simulated to calculate the balance in the currency.
The third function
Calculations are given for such markets and indices: S & P500, NYSE, Brent, BTCUSD, EURUSD.
The first 4 were downloaded from Yahoo Finance, the last from another source. Calculation results for courses from other sources may vary.
Please note that the periods of the courses of each instrument are different, namely:
Therefore, one cannot compare the achieved profitability of instruments with each other, but it is possible to compare the profitability of each of the instruments using different indicators.
The download file (SQL * Loader) can also be taken from GitHub at the link at the bottom of the article.
There are at least three main types of moving averages:
They differ in the weights of their constituent parts. For a linear moving average, the weights are equal, for exponential and linearly weighted weights, they decrease as the component moves farther from the right edge of the window - exponentially or linearly.
The linear moving average is the easiest to calculate. In Oracle, this is a function
The linear moving average has drawbacks. Firstly, such averages react slowly to market reversals. Since many values are averaged, each of which is given equal weight, the average reaction often occurs several timeframes after an asset price reversal.
Also, the linear moving average is not very effective, because it responds to the signal twice: when the indicator entered the sliding window and left it. The rest react only to the input of the indicator and smoothly remove it from the calculation as you move from the right edge of the window to the left.
In calculating TIR , all three types of moving averages are used. For exponential and linearly weighted in this article, aggregate functions
Calculation of EMA and WMA, without recursion or modelka, only by analytics, in Oracle Database, apparently, is impossible.
But still reservations regarding moving averages:
For almost every indicator, several calculation methods will be given: CALC - calculation using PL / SQL code, SIMP - calculation by one operator or RECU - calculation by recursion, AGRF - calculation using the aggregate function, MODE - calculation by model.
There are reasons for developing several methods. Firstly, by calculating the TIR using several methods and comparing the indicators, if the indicators are the same, you can be sure that the calculations were carried out correctly (given the different methods of rounding and processing the NULL and "0" values). In this article I will compare the hashes of samples of various methods, so matching up to bits and the same processing by all algorithms is guaranteed.
I believe Oracle to begin developing TIRneed with the SIMP method - calculation by one operator. When this is done, the oracleoid has a plan and calculation algorithm in its head, and it can be easily transferred to PL / SQL or to another procedural language.
I note that the CALC calculation method for PL / SQL here turns out to be faster than the SIMP method (with one operator) if the whole calculation can be performed in one pass along the cursor. But if for the calculation you have to create temporary tables or collections, or more than 1 pass on the cursor - I think the “one-operator” method will turn out to be faster and less resource-intensive.
For all methods, including the SIMP method (“one operator”), I will put the operators in functions so that the calculation can be called with a parameter to select the optimal value.
Calculations are given for seven TIR: Intersection of the moving average (EMASIMPLE), Golden and Deadly crosses (CROSSES), Balance volume (OBV), Keltner Channel (KELTNER), Price and volume trend (PVT), Arms ease of movement indicator (EMV), Commodity channel index (CCI).
For the seven indicators of these two articles there will be one parameter “averaging window size”, and the second parameter - shift (lag). The shift says how many bars you need to postpone the execution of the BUY / SELL order - how many bars to shift the closing price (all orders are made at the closing price of the bar). It is like a “slippage”, but it is not really a “slippage”. Slippage is usually not in favor of the client, and our lag may turn out to be both not in favor of the client, and in favor. Nevertheless, the use of modeling with a lag of 1 to 5 bars for some indicators shows that slippage has a significant effect on the result. And for some indicators, lag and slippage are not so important.
The SIMP (“single statement”) and RECU (“recursion”) methods actively use the phrase
Detailed descriptions of all TIRs can be found on Wikipedia or in Robert Colby’s book, Encyclopedia of Technical Market Indicators.
The method of intersecting exponential moving averages is the simplest TIR .
The method involves: buying (opening a long position) if the price value crosses its bottom-up exponential moving average (ESA); selling (closing a long position) if the price crosses its ESS from top to bottom.
Short positions, as well as margin trading in general, are not considered in this article.
In the future, it is this indicator that can be used as a standard for comparison with others. A comparison with this TIR is better than a comparison with the Buy and Hold strategy, because this strategy is not profitable in falling markets.
The only TIR parameter is the length of the moving average.
Calculation using PL / SQL
Calculation by one recursive operator
Calculation using the phrase MODEL
Calculation using the aggregate function
Compare the calculation results with one parameter:
All hashes must match for all four methods.
If the hashes do not match, you can figure out exactly where the discrepancy formed, using this operator (substitute the names of the functions that you want to compare):
Selection of parameters
The TIR itself uses one parameter, for this and for all other TIRs I change it in the range from 1 to 200, but to calculate a three-dimensional picture for dependence and on the lag too, we will introduce a second parameter that will vary from 1 to 5.
The operator opens 200 * 5 = 1000 cursors, so Oracle OPEN_CURSORS parameter may need to be changed . The
query below performs a Cartesian product of a table with numbers from 1 to 200, with a table with numbers from 1 to 5, and Cartesian multiplies all this by calling a table function
After some further manipulations in MATLAB, we will further obtain a 200 * 5 matrix, where in the matrix cells there will be a total capital value for each value of each of the two parameters. Next in MATLAB we build a three-dimensional picture.
All calculations in this article are performed slowly, up to 20 minutes, this is due to the opening of a large number of cursors.
I also developed a faster simulation method with one cursor, without opening 1000 cursors, but it is so voluminous that it would take half of the article. Therefore, I will not bring him here.
The result of modeling the intersection of the moving average (all graphs are clickable): The second row of the graphs is the same as the first row, but the graphs are slightly rotated, the graphs with different lags are located one after another. This allows you to assess the impact of lag on the result. In general, the indicator is not very sensitive to lags. For S & P500 and NYSE markets, the TIR parameter

you need to choose the more the better. For the Brent market, it is around 25. In the other two markets, there is no correlation between profitability and the parameter.
In the implementation on Oracle, this indicator is very similar to the previous one, only here two moving averages are used, and not one. Therefore, I will give only one calculation option.
The Wiki describes the Ichimoku Indicator. This is a complex indicator. “Crosses” are one of the constituent parts. But the indicator is poorly described on the Wiki, in particular, note that the Tenkan and Kijun lines are described in completely different words, although in fact it is the same thing, but with different periods.
In the book of Robert Colby, this indicator is also not described.
Japanese analysts call the intersection of averages, when the short-term average crosses the long-term from the bottom up, the Golden Cross (Golden Cross), and the opposite situation, when the short-term moving average crosses the long-term from the top to the bottom, Dead Cross.
The author drew attention to the fact that this indicator is described in the article “Futures for American oil formed a“ deadly cross ”” and began to google its description and use.
This indicator is considered serious in the stock market, in part because it gives signals rarely.
Most commonly used are 50 and 200 period moving averages.
When modeling the performance below, we take the period of the long moving average equal to the quadruple period of the short moving average, and simulate the length of the short from 1 to 200 days (it will turn out from 4 to 800 days for the long).
Code for calculating on GitHub.

The indicator is not very sensitive to lags. For the S & P500 market, there are maximums at 48 (192 for a long SS) and 98 days (392 for a long SS). Note that the first maximum is very close to the numbers 50x200. It can be assumed that if you choose this parameter 1 and 2 less than other market participants, you can try to beat them on this indicator alone.
There are 4 highs on the NYSE. In the Brent and BTCUSD markets, the indicator does not work.
For the EURUSD market, too, the parameter must be chosen slightly less than 50 for a short SS. But the indicator does not give profit in this market. It can be used only as an additional indicator.
The OBV indicator is a cumulative moving average trading volume taken with a plus sign in the case of a growing market and with a minus sign in the case of a falling one.
Here we will use this way of interpreting the value of indicators: buy when the OBV crosses its moving average from the bottom up, sell when the OBV crosses its moving average from the top down.
More on Wiki or Colby

In the S & P500 market, the indicator is very sensitive to delays (lags), but you can try to choose a parameter on the principle of “the more the better”, some profitability is achieved. On the NYSE, profitability cannot be achieved. In the Brent market, you can select a parameter value from 20 to 100. In the BTCUSD market, there is no clear linear relationship, but choosing a parameter value less than 40 is impractical. For the EURUSD market, the value of the parameter must be chosen “the more the better”, but profitability cannot be achieved.
TIR consists of two bands above and below the moving average price, the width of which is defined as a fraction of the average price change for the period. The price is a typical price.
The midline of the indicator line is a simple moving average of the typical price.
The upper and lower lines of the indicator are separated from the midline by an amount equal to the simple moving average of the daily trading range.
In our calculations, the TIR signal will be formed as follows: Buy if the price crosses the upper line, Sell if the price crosses the lower one.

There are highs for the S & P500 and NYSE markets. In the Brent market, there is no dependence of the result on the parameter, and all trading is at a loss. There are highs in the BTCUSD market, but narrow ones, and it’s hard to get into them. In the EURUSD market, there is a dependence of the result on the parameter.
The value of the PVT indicator represents the cumulative sum of the product of the current trading volume by the given price increase relative to the previous period.
We will generate trading signals here as follows: Buy when the PVT crosses its moving average from the bottom up, Sell when the PVT crosses its moving average from the top down.
Read more on Wiki . Colby did not find. For the S & P500, the value of the parameter “the bigger the better”, there is almost no dependence on the NYSE, for Brent there is a maximum in the region of 50, on BTCUSD the indicator is effective only with minimal lags, 1-2, and with minimum parameter values, up to 50 , for EURUSD the dependence is increasing.

TIR EMV is a numerical expression of how easily a price changes in a market. The stronger the price change and the lower the turnover, the easier the market rises or falls.
Trading orders here we will form as follows: Buy when the moving average EMV rises above zero, Sell when the moving average EMV falls below zero.
More on Wiki or Colby. There are highs in the S&P and NYSE markets; in the Brent market, the indicator is effective in a wide range of parameter values. In the BTCUSD and EURUSD markets, the indicator is ineffective.

TIR CCI is an indicator based on the analysis of the current change in the price deviation from its average value for a certain period and the average absolute value of this parameter. TIR is applicable to any financial markets.
We will form the trading orders as follows: Buy when the CCI rises above 100, Sell when the CCI falls below 100.
More on Wiki or Colby. In the S & P500, NYSE, Brent markets, there is no dependence of the trading result on the value of the parameter. There is a dependence on the BTCUSD market (two clear highs), and you can try to catch it in real trading. In the EURUSD market, the indicator of results will not bring. Sources available on github

Create common objects, upload data, either mine (as I said before, all markets except the last are taken from Yahoo Finance), or your own, create functions for calculating, calculate trading performance data (as I said earlier, calculating each indicator for up to 20 minutes) .
The general conclusion regarding the TIR : the use of only one indicator for profit is impossible. Different indicators are differently effective in different markets. The possibility of making a profit using several well-tuned indicators plus additional external information is not excluded.
Additionally:
Three more indicators were analyzed that are not included in the article. But they failed to get any result. Perhaps their study will be continued.
It is very convenient to perform calculations and complex modeling of TIR and financial activities in general on Oracle Database.
The technical analysis (TA) of the markets was used as a functional area. First, a small, superficial introduction to trading in markets, then calculations.
Technical analysis - a set of tools for forecasting likely price changes based on patterns of past price changes. Theoretically, Technical Analysis is applicable in any market. But the most widespread Technical analysis received in highly liquid free markets, for example, on exchanges.
Many SQL statements, procedures, and graphs have been developed. Part - below, full code - on GitHub at the link at the bottom of the article.
Technical Market Indicators (TIR) - additional charts for price charts, formed on the basis of recalculation of values contained in the base price chart . Usually these are different types of averaging (the next point of the chart is calculated as the average value of a number of previous price values, for example, a moving average), relationships (the next point is the result of comparing a number of previous prices - their difference, derivative of a change over a period), or lags ( delays). The indicators clearly show some non-obvious information contained in the statistics of price changes, and can form recommendations on trade orders - BUY / SELL. Indicators have at least one variable parameter, from the value of which the result will change.To open real transactions, usually several indicators are used in combination, plus additional information, at the discretion of the trader.
One of the postulates of the Technical Analysis is “history repeats itself”: Market participants in similar circumstances behave in approximately the same way, forming similar dynamics of price changes. And it is natural to assume that market behavior in the future will mainly repeat the patterns that have emerged in the past. Following this statement, the investor can choose from the possible parameters of the TIR those that have proven themselves best in past periods.
This article builds a graph of trade performance when using each indicator on the value of the TIR parameter, this is in a two-dimensional representation. But in fact, I will build in a three-dimensional representation in order to evaluate also the effect of the delay in the execution of the order on the result, so the parameter will be the X axis (abscissa), the delay will be the Y axis (ordinate), the result will be the Z axis (applicate). This is some attempt to evaluate the effect of “slippage”, which, unfortunately, always happens. Instead of real “slippage” along the Y axis, I postpone the execution of the BUY / SELL order for a period of 1 to 5 periods.
If a global maximum is highlighted on this graph and the graph itself will look like a hat (in general, it is called the “normal distribution”, but it assumes strict symmetry about the vertical axis), the cone, the pyramid are also suitable - it means you can select a certain parameter value for this , which will show the highest result, and with this indicator you can try to trade. If the performance chart, depending on the parameter, resembles a “stockade”, it is impossible to select the optimal parameter value and there is no point in using this TIR in trade.
We can say that in this article I only calculate the “hit percentage” of indicators. The problem, to evaluate how much you can "earn", I did not dare.
Successful completion of the described verification is one of the necessary, but not sufficient factors for effective trading.
For information ... In contrast to Technical Analysis, Fundamental Analysis (FA) is a term for designating methods for predicting the market (exchange) value of instruments based on the analysis of financial and production performance indicators.
The “intrinsic value” of the FA in most cases does not coincide with the company's share price, which is determined by the ratio of supply and demand in the stock market. Investors using FA in their activities, primarily interested in situations where the "intrinsic value" of the company's shares exceeds the price of shares on the exchange. Such shares are considered undervalued, which means their price will rise, and they are potential investment targets.
One of the best known investors using Fundamental Analysis is Warren Buffett.
Check out the trailer: https://www.youtube.com/watch?v=SqE8fnvmV1Y
Thus, we have two diametrically opposite approaches - TA and FA .
FA usually interests long-term investors, TA - short- and medium-term and is used for transactions of a speculative nature, when the trader himself is not interested in the subject of trade.
And the objectives of this article are two ...
In addition to the above discussions about TA and FA, I wanted to explore and show the capabilities of Oracle Database to perform calculations of Technical market indicators .
I present these opportunities to the readers' judgment.
If you decide to repeat my calculations - download the code from GitHub at the link at the bottom of the article. Code verified on version 12.2.0.1.
First create shared objects. The first are the tables and view. In the same file below is a transaction modeling package.
The second step is the creation of functions that perform the calculation of TIR .
The third step is the calculations.
All functions for calculating all TIRswill return a cursor with the following fields: STOCK_NAME, ADATE, ACLOSE (closing price of the day), AACTION (sell / buy order)
The package contains three tabular modeling functions that take the cursor from the TIR calculation functions described above , offset (delay in order execution, lag), and the initial capital, by default is 1000 USD. Package functions are called like this:
select * from HABR_TRADEMODELLING_P.TRADE_LOG (cursor (select STOCK_NAME, ADATE, ACLOSE, AACTION fromtable (HABR_MARKETINDEXES_XXXXXXXX_F_CALC (10))), p_lag => 1) orderby1, 2;
select * from HABR_TRADEMODELLING_P.CALC_ACTIONS (cursor (select STOCK_NAME, ADATE, ACLOSE, AACTION fromtable (HABR_MARKETINDEXES_XXXXXXXX_F_CALC (10))), p_lag => 1);
select * from HABR_TRADEMODELLING_P.CALC_ACTIONS_TOTALS (cursor (select STOCK_NAME, ADATE, ACLOSE, AACTION fromtable (HABR_MARKETINDEXES_XXXXXXXX_F_CALC (10))), p_lag => 1);
where XXXXXXXX is the name of the TIR .
All functions calculate the result of trading subject to full reinvestment of profits, excluding transaction costs and taxes, and excluding inflation and discounting.
The first function
TRADE_LOGforms a simplified trader's transaction log. The function allows you to trace the entire chain of transactions. If at the end of the period the investor is “in securities”, to calculate the balance in the currency (financial result), the function simulates the sale of all securities at the last closing price and forms the corresponding mark in the IN_STOCK field. The second function
CALC_ACTIONSreturns the same columns as the called TIR calculation cursor , plus adds the following columns: AACTION_LAG(order with offset),BALANCE_CURRENCY(balance of the trader’s account in cash), BALANCE_STOCK(number of instruments in open positions). Depending on the value of the field, the AACTION_LAGpurchase or sale at the closing price is simulated, and accordingly the balance in the currency and the amount of open positions are changed. In the last line of each instrument, you can see the result of trading for each instrument, as well as in the previous function, if the investor is “in securities”, the sale is simulated to calculate the balance in the currency.
The third function
CALC_ACTIONS_TOTALSdoes the same as the second, but returns only the last line - the result of trading for each instrument. It will be used in modeling.Download data
Calculations are given for such markets and indices: S & P500, NYSE, Brent, BTCUSD, EURUSD.
The first 4 were downloaded from Yahoo Finance, the last from another source. Calculation results for courses from other sources may vary.
Please note that the periods of the courses of each instrument are different, namely:
- S & P500 - 03/01/1950 ... 29/01/2019, 69 years old;
- NYSE - 31/12/1965 ... 22/03/2019, 54 years old;
- Brent - 17/05/1991 ... 06/02/2019, 28 years old;
- BTCUSD - 16/07/2010 ... 29/01/2019, 9 years old;
- EURUSD - 16/02/2001 ... 27/05/2019, 18 years old.
Therefore, one cannot compare the achieved profitability of instruments with each other, but it is possible to compare the profitability of each of the instruments using different indicators.
The download file (SQL * Loader) can also be taken from GitHub at the link at the bottom of the article.
Moving averages
There are at least three main types of moving averages:
- linear (Simple Moving Average, SMA),
- Exponential Moving Average (EMA) and
- linearly weighted (Weighted Moving Average, WMA).
They differ in the weights of their constituent parts. For a linear moving average, the weights are equal, for exponential and linearly weighted weights, they decrease as the component moves farther from the right edge of the window - exponentially or linearly.
The linear moving average is the easiest to calculate. In Oracle, this is a function
avg (VALUE) over (partition by STOCK_NAME order by ADATE rows between 9 preceding and current row)- a moving average with an averaging window of 10 values. The linear moving average has drawbacks. Firstly, such averages react slowly to market reversals. Since many values are averaged, each of which is given equal weight, the average reaction often occurs several timeframes after an asset price reversal.
Also, the linear moving average is not very effective, because it responds to the signal twice: when the indicator entered the sliding window and left it. The rest react only to the input of the indicator and smoothly remove it from the calculation as you move from the right edge of the window to the left.
In calculating TIR , all three types of moving averages are used. For exponential and linearly weighted in this article, aggregate functions
EMAand WMAare developed that are used in an analytical form. In addition, these moving averages can be calculated by recursion or model (phrase MODEL). Calculation of EMA and WMA, without recursion or modelka, only by analytics, in Oracle Database, apparently, is impossible.
But still reservations regarding moving averages:
- the shorter the averaging period and the more sensitively the method reacts to turns, the more it gives false signals;
- the shorter the averaging period, the more signals are generated, the greater the transaction overhead, which can become very significant.
Technical Market Indicators
For almost every indicator, several calculation methods will be given: CALC - calculation using PL / SQL code, SIMP - calculation by one operator or RECU - calculation by recursion, AGRF - calculation using the aggregate function, MODE - calculation by model.
There are reasons for developing several methods. Firstly, by calculating the TIR using several methods and comparing the indicators, if the indicators are the same, you can be sure that the calculations were carried out correctly (given the different methods of rounding and processing the NULL and "0" values). In this article I will compare the hashes of samples of various methods, so matching up to bits and the same processing by all algorithms is guaranteed.
I believe Oracle to begin developing TIRneed with the SIMP method - calculation by one operator. When this is done, the oracleoid has a plan and calculation algorithm in its head, and it can be easily transferred to PL / SQL or to another procedural language.
I note that the CALC calculation method for PL / SQL here turns out to be faster than the SIMP method (with one operator) if the whole calculation can be performed in one pass along the cursor. But if for the calculation you have to create temporary tables or collections, or more than 1 pass on the cursor - I think the “one-operator” method will turn out to be faster and less resource-intensive.
For all methods, including the SIMP method (“one operator”), I will put the operators in functions so that the calculation can be called with a parameter to select the optimal value.
Calculations are given for seven TIR: Intersection of the moving average (EMASIMPLE), Golden and Deadly crosses (CROSSES), Balance volume (OBV), Keltner Channel (KELTNER), Price and volume trend (PVT), Arms ease of movement indicator (EMV), Commodity channel index (CCI).
For the seven indicators of these two articles there will be one parameter “averaging window size”, and the second parameter - shift (lag). The shift says how many bars you need to postpone the execution of the BUY / SELL order - how many bars to shift the closing price (all orders are made at the closing price of the bar). It is like a “slippage”, but it is not really a “slippage”. Slippage is usually not in favor of the client, and our lag may turn out to be both not in favor of the client, and in favor. Nevertheless, the use of modeling with a lag of 1 to 5 bars for some indicators shows that slippage has a significant effect on the result. And for some indicators, lag and slippage are not so important.
The SIMP (“single statement”) and RECU (“recursion”) methods actively use the phrase
MATCH_RECOGNIZE, to generate a BUY / SELL trading signal based on the entry / exit of the calculated TIR in a given range or its behavior relative to its moving average. Detailed descriptions of all TIRs can be found on Wikipedia or in Robert Colby’s book, Encyclopedia of Technical Market Indicators.
The intersection of the exponential moving average
The method of intersecting exponential moving averages is the simplest TIR .
The method involves: buying (opening a long position) if the price value crosses its bottom-up exponential moving average (ESA); selling (closing a long position) if the price crosses its ESS from top to bottom.
Short positions, as well as margin trading in general, are not considered in this article.
In the future, it is this indicator that can be used as a standard for comparison with others. A comparison with this TIR is better than a comparison with the Buy and Hold strategy, because this strategy is not profitable in falling markets.
The only TIR parameter is the length of the moving average.
Calculation using PL / SQL
createorreplacefunction HABR_MARKETINDEXES_EMASIMPLE_F_CALC (p_averaging_window_width integer)
return HABR_MARKETINDEXES_RESULT_LIST_T pipelinedis
    l_result HABR_MARKETINDEXES_RESULT_LIST_T;
    EMA number;
    prev_EMA number;
    prev_TYPICAL_PRICE number;
    retval HABR_MARKETINDEXES_RESULT_T := HABR_MARKETINDEXES_RESULT_T (null, null, null, null, null, null, null, null, null);
    prev_STOCK_NAME varchar2(256);
    l_alpha number;
begin
    l_alpha := 2 / (p_averaging_window_width + 1);
    for c1 in (select STOCK_NAME, ADATE, TYPICAL_PRICE, ACLOSE from LOAD_YAHOO_V orderby1, 2)
    loop
        retval.ADATE        := c1.ADATE;
        retval.ACLOSE       := c1.ACLOSE;
        if prev_STOCK_NAME is null or prev_STOCK_NAME <> c1.STOCK_NAME
        then
            retval.STOCK_NAME   := c1.STOCK_NAME;
            EMA                 := c1.TYPICAL_PRICE;
            prev_EMA            := null;
        else
            EMA := round (c1.TYPICAL_PRICE * l_alpha + EMA * (1 - l_alpha), 20);
        endif;
        if    prev_TYPICAL_PRICE < prev_EMA and c1.TYPICAL_PRICE > EMA then retval.AACTION := 'BUY';
        elsif prev_TYPICAL_PRICE > prev_EMA and c1.TYPICAL_PRICE < EMA then retval.AACTION := 'SELL';
        else  retval.AACTION := null;
        endif;
        retval.IND_VALUE  := EMA;
        pipe row (retval);
        prev_STOCK_NAME := c1.STOCK_NAME;
        prev_EMA := EMA;
        prev_TYPICAL_PRICE := c1.TYPICAL_PRICE;
    endloop;
end;
Calculation by one recursive operator
createorreplacefunction HABR_MARKETINDEXES_EMASIMPLE_F_RECU (p_averaging_window_width integer)
return HABR_MARKETINDEXES_RESULT_LIST_T is
    l_result HABR_MARKETINDEXES_RESULT_LIST_T;
beginwith
      T1 (STOCK_NAME, ADATE, TYPICAL_PRICE, EMA, ACLOSE, RN) as
           (select STOCK_NAME, ADATE, TYPICAL_PRICE, round (TYPICAL_PRICE, 20), ACLOSE, RN from LOAD_YAHOO_V where RN = 1union all
            select b.STOCK_NAME
                 , b.ADATE
                 , b.TYPICAL_PRICE
                 , round (b.TYPICAL_PRICE * 2 / (p_averaging_window_width + 1) + a.EMA * (1 - 2 / (p_averaging_window_width + 1)), 20)
                 , b.ACLOSE
                 , b.RN
            from T1 a, LOAD_YAHOO_V b
            where b.RN = a.RN + 1and b.STOCK_NAME = a.STOCK_NAME)
    select HABR_MARKETINDEXES_RESULT_T (STOCK_NAME, ADATE, ACLOSE, EMA, null, null, null, null, AACTION)
    bulkcollectinto l_result
    from T1 match_recognize (partitionby STOCK_NAME orderby ADATE
                             measures classifier() as AACTION
                             all rows per matchwith unmatched rows
                             pattern (BUY+ | SELL+)
                             define BUY  as (prev (TYPICAL_PRICE) < prev (EMA) and TYPICAL_PRICE > EMA)
                                  , SELL as (prev (TYPICAL_PRICE) > prev (EMA) and TYPICAL_PRICE < EMA)
                             ) MR;
    return l_result;
end;
Calculation using the phrase MODEL
Function text HABR_MARKETINDEXES_EMASIMPLE_F_MODE
createorreplacefunction HABR_MARKETINDEXES_EMASIMPLE_F_MODE (p_averaging_window_width integer)
return HABR_MARKETINDEXES_RESULT_LIST_T is
    l_result HABR_MARKETINDEXES_RESULT_LIST_T;
beginwith
      T1 as (select * from LOAD_YAHOO_V
             modeldimensionby (STOCK_NAME, RN) measures (ADATE, TYPICAL_PRICE, ACLOSE, to_number(null) as EMA)
             rules (EMA[any, any] = round (TYPICAL_PRICE [cv(), cv()] * 2 / (p_averaging_window_width     + 1) + nvl(EMA [cv(), cv() - 1], TYPICAL_PRICE [cv(), cv()]) * (1 - 2 / (p_averaging_window_width     + 1)), 20)))
    , T2 as (select STOCK_NAME, ADATE, ACLOSE
                  , TYPICAL_PRICE, LAG (TYPICAL_PRICE) over (partitionby STOCK_NAME orderby ADATE) as PREV_TYPICAL_PRICE
                  , EMA, lag (EMA) over (partitionby STOCK_NAME orderby ADATE) as PREV_EMA
             from T1)
    select HABR_MARKETINDEXES_RESULT_T (STOCK_NAME, ADATE, ACLOSE, EMA, null, null, null, null
                                      , casewhen prev_TYPICAL_PRICE < prev_EMA and TYPICAL_PRICE > EMA then'BUY'when prev_TYPICAL_PRICE > prev_EMA and TYPICAL_PRICE < EMA then'SELL'end)
    bulkcollectinto l_result
    from T2 orderby STOCK_NAME, ADATE;
    return l_result;
end;
Calculation using the aggregate function
The text of the EMA aggregate function and the HABR_MARKETINDEXES_EMASIMPLE_F_AGRF function
createorreplacetype EMA_DATA_T asobject (AVALUE number, AVERAGING_WINDOW integer);
createorreplacetype EMA_IMPL_T asobject
(
    l_window_width integer,
    l_ema  number,
    staticfunction ODCIAggregateInitialize   (sctx inout EMA_IMPL_T) returnnumber,
    memberfunction ODCIAggregateIterate      (selfinout EMA_IMPL_T, valuein EMA_DATA_T) returnnumber,
    memberfunction ODCIAggregateMerge        (selfinout EMA_IMPL_T, ctx2 in EMA_IMPL_T) returnnumber,
    memberfunction ODCIAggregateTerminate    (selfin EMA_IMPL_T, returnValue outnumber, flags innumber) returnnumber
);
createorreplacetypebody EMA_IMPL_T isstaticfunction ODCIAggregateInitialize (sctx inout EMA_IMPL_T) returnnumberisbegin
    sctx := EMA_IMPL_T (null, null);
    return ODCIConst.Success;
end;
member function ODCIAggregateIterate (self in out EMA_IMPL_T, value in EMA_DATA_T) return number is
beginif value.AVALUE isnotnullthenif l_window_width isnullthen
            l_window_width := value.AVERAGING_WINDOW;
            self.l_ema := value.AVALUE;
        else
            self.l_ema := round (value.AVALUE * 2 / (l_window_width  + 1) + self.l_ema * (1 - 2 / (l_window_width  + 1)), 20);
        endif;
    endif;
    return ODCIConst.Success;
end;
member function ODCIAggregateMerge(self in out EMA_IMPL_T, ctx2 in EMA_IMPL_T) return number is
beginreturn ODCIConst.Error;
end;
member function ODCIAggregateTerminate(self in EMA_IMPL_T, returnValue out number, flags in number) return number is
begin
    returnValue := self.l_ema;
    return ODCIConst.Success;
end;
end;
createorreplacefunction EMA (input EMA_DATA_T) returnnumberaggregateusing EMA_IMPL_T;
createorreplacefunction HABR_MARKETINDEXES_EMASIMPLE_F_AGRF (p_averaging_window_width integer)
return HABR_MARKETINDEXES_RESULT_LIST_T is
    l_result HABR_MARKETINDEXES_RESULT_LIST_T;
beginwith
      T1 as (select STOCK_NAME, ADATE, TYPICAL_PRICE, ACLOSE
                  , round (EMA (EMA_DATA_T (TYPICAL_PRICE, p_averaging_window_width)) over (partitionby STOCK_NAME orderby ADATE), 20) as EMA
             from LOAD_YAHOO_V)
    select HABR_MARKETINDEXES_RESULT_T (STOCK_NAME, ADATE, ACLOSE, EMA, null, null, null, null, AACTION)
    bulkcollectinto l_result
    from T1 match_recognize (partitionby STOCK_NAME orderby ADATE
                             measures classifier() as AACTION
                             all rows per matchwith unmatched rows
                             pattern (BUY+ | SELL+)
                             define BUY  as (prev (TYPICAL_PRICE) < prev (EMA) and TYPICAL_PRICE > EMA)
                                  , SELL as (prev (TYPICAL_PRICE) > prev (EMA) and TYPICAL_PRICE < EMA)
                             ) MR;
    return l_result;
end;
Compare the calculation results with one parameter:
selectCOLUMN_VALUEas ALG, dbms_sqlhash.gethash (COLUMN_VALUE, 2) as RECORDSET_HASH
fromtable (sys.odcivarchar2list ('select * from table (HABR_MARKETINDEXES_EMASIMPLE_F_CALC (15)) order by 1, 2'
                                , 'select * from table (HABR_MARKETINDEXES_EMASIMPLE_F_RECU (15)) order by 1, 2'
                                , 'select * from table (HABR_MARKETINDEXES_EMASIMPLE_F_MODE (15)) order by 1, 2'
                                , 'select * from table (HABR_MARKETINDEXES_EMASIMPLE_F_AGRF (15)) order by 1, 2'));
All hashes must match for all four methods.
If the hashes do not match, you can figure out exactly where the discrepancy formed, using this operator (substitute the names of the functions that you want to compare):
selectcoalesce (a.STOCK_NAME, b.STOCK_NAME) as STOCK_NAME, coalesce (a.ADATE, b.ADATE) as ADATE
     , a.ACLOSE as CALC_ACLOSE, b.ACLOSE as AGRF_CLOSE
     , a.IND_VALUE as CALC_EMA, b.IND_VALUE as AGRF_EMA
     , a.AACTION as CALC_AACTION, b.AACTION as AGRF_AACTION
fromtable (HABR_MARKETINDEXES_EMASIMPLE_F_CALC (15)) a
fullouterjointable (HABR_MARKETINDEXES_EMASIMPLE_F_AGRF (15)) b on a.STOCK_NAME = b.STOCK_NAME and a.ADATE = b.ADATE
--where sys_op_map_nonnull (a.ACLOSE) <> sys_op_map_nonnull (b.ACLOSE)--   or sys_op_map_nonnull (a.IND_VALUE) <> sys_op_map_nonnull (b.IND_VALUE)--   or sys_op_map_nonnull (a.AACTION) <> sys_op_map_nonnull (b.AACTION)orderby1, 2;
;
Selection of parameters
The TIR itself uses one parameter, for this and for all other TIRs I change it in the range from 1 to 200, but to calculate a three-dimensional picture for dependence and on the lag too, we will introduce a second parameter that will vary from 1 to 5.
The operator opens 200 * 5 = 1000 cursors, so Oracle OPEN_CURSORS parameter may need to be changed . The
query below performs a Cartesian product of a table with numbers from 1 to 200, with a table with numbers from 1 to 5, and Cartesian multiplies all this by calling a table function
HABR_TRADEMODELLING_P.CALC_ACTIONS_TOTALS.After some further manipulations in MATLAB, we will further obtain a 200 * 5 matrix, where in the matrix cells there will be a total capital value for each value of each of the two parameters. Next in MATLAB we build a three-dimensional picture.
rollback;
delete HABR_MARKETINDEXES_PARMSEL_RESULTS where INDICATOR_NAME = 'HABR_MARKETINDEXES_EMASIMPLE_F_CALC';
commit;
insertinto HABR_MARKETINDEXES_PARMSEL_RESULTS (INDICATOR_NAME, PARM1, PARM2, STOCK_NAME, ADATE_MIN, ADATE_MAX, DEALS_COUNT, BALANCE_RESULT, DEALS_PROFIT_AMOUNT, DEALS_LOSS_AMOUNT, DEALS_PROFIT_COUNT, DEALS_LOSS_COUNT, IN_STOCK)
with
  TP1 as (selectrownumas PARM1 from dual connectbylevel <= &&AVERAGING_INTERVAL)
, TP2 as (selectrownumas PARM2 from dual connectbylevel <= &&LAG_MODELLING_DEPTH)
select--+ parallel(8)'HABR_MARKETINDEXES_EMASIMPLE_F_CALC', PARM1, PARM2, STOCK_NAME, ADATE_MIN, ADATE_MAX, DEALS_COUNT, BALANCE_RESULT, DEALS_PROFIT_AMOUNT, DEALS_LOSS_AMOUNT, DEALS_PROFIT_COUNT, DEALS_LOSS_COUNT, IN_STOCK
from TP1
crossjoin TP2
crossjointable (HABR_TRADEMODELLING_P.CALC_ACTIONS_TOTALS (cursor (select STOCK_NAME, ADATE, ACLOSE, AACTION fromtable (HABR_MARKETINDEXES_EMASIMPLE_F_CALC (PARM1))), PARM2))
;
commit;
All calculations in this article are performed slowly, up to 20 minutes, this is due to the opening of a large number of cursors.
I also developed a faster simulation method with one cursor, without opening 1000 cursors, but it is so voluminous that it would take half of the article. Therefore, I will not bring him here.
The result of modeling the intersection of the moving average (all graphs are clickable): The second row of the graphs is the same as the first row, but the graphs are slightly rotated, the graphs with different lags are located one after another. This allows you to assess the impact of lag on the result. In general, the indicator is not very sensitive to lags. For S & P500 and NYSE markets, the TIR parameter
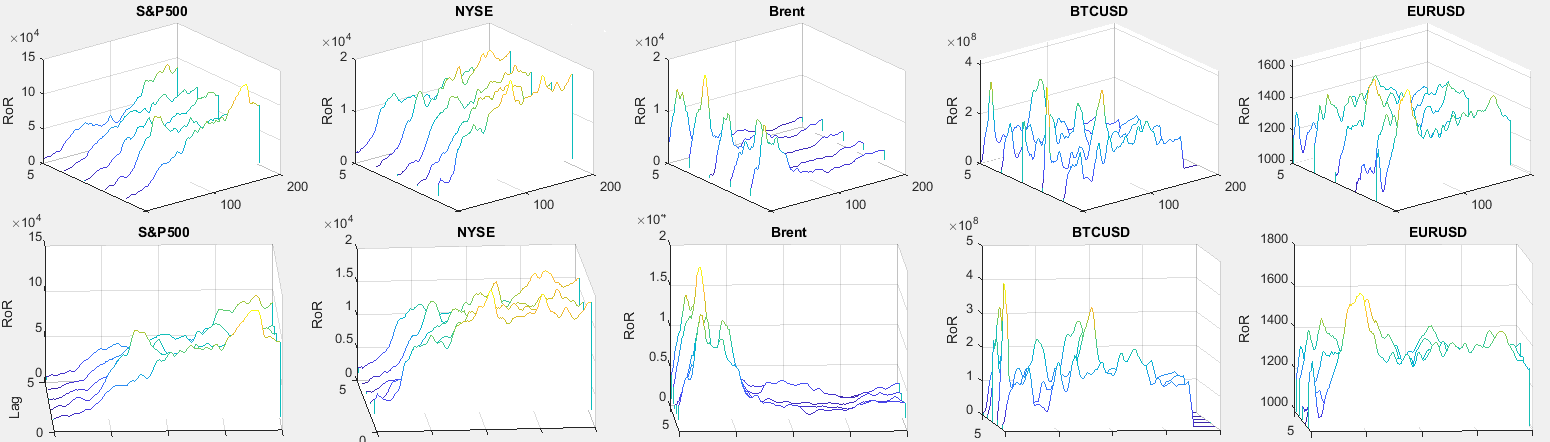
you need to choose the more the better. For the Brent market, it is around 25. In the other two markets, there is no correlation between profitability and the parameter.
Deadly and Golden Crosses
In the implementation on Oracle, this indicator is very similar to the previous one, only here two moving averages are used, and not one. Therefore, I will give only one calculation option.
The Wiki describes the Ichimoku Indicator. This is a complex indicator. “Crosses” are one of the constituent parts. But the indicator is poorly described on the Wiki, in particular, note that the Tenkan and Kijun lines are described in completely different words, although in fact it is the same thing, but with different periods.
In the book of Robert Colby, this indicator is also not described.
Japanese analysts call the intersection of averages, when the short-term average crosses the long-term from the bottom up, the Golden Cross (Golden Cross), and the opposite situation, when the short-term moving average crosses the long-term from the top to the bottom, Dead Cross.
The author drew attention to the fact that this indicator is described in the article “Futures for American oil formed a“ deadly cross ”” and began to google its description and use.
This indicator is considered serious in the stock market, in part because it gives signals rarely.
Most commonly used are 50 and 200 period moving averages.
When modeling the performance below, we take the period of the long moving average equal to the quadruple period of the short moving average, and simulate the length of the short from 1 to 200 days (it will turn out from 4 to 800 days for the long).
Code for calculating on GitHub.
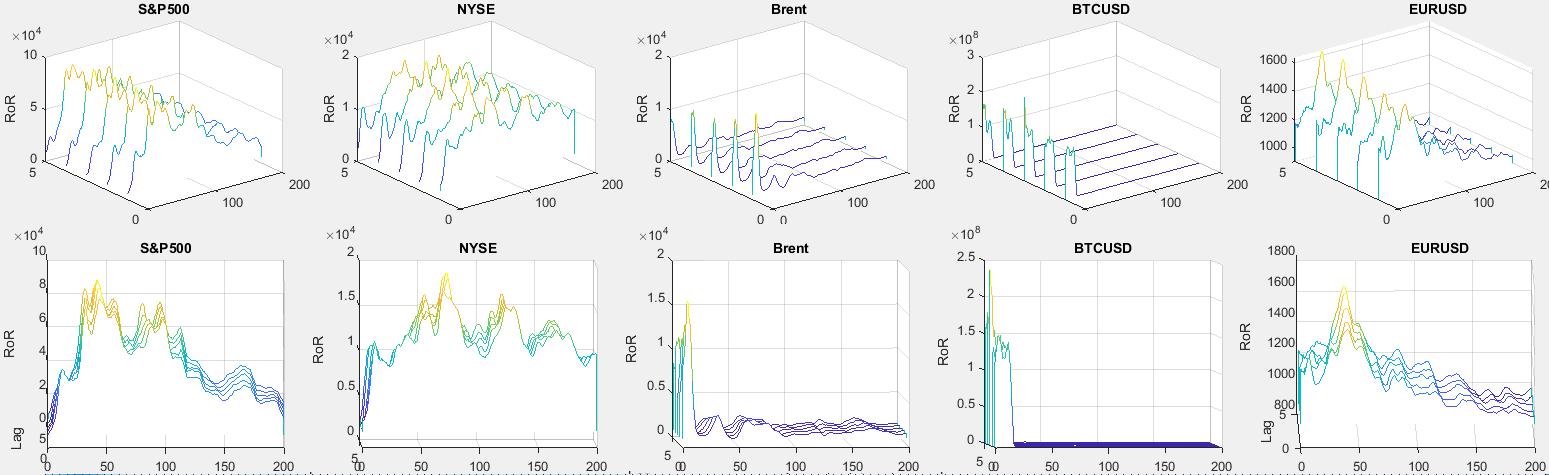
The indicator is not very sensitive to lags. For the S & P500 market, there are maximums at 48 (192 for a long SS) and 98 days (392 for a long SS). Note that the first maximum is very close to the numbers 50x200. It can be assumed that if you choose this parameter 1 and 2 less than other market participants, you can try to beat them on this indicator alone.
There are 4 highs on the NYSE. In the Brent and BTCUSD markets, the indicator does not work.
For the EURUSD market, too, the parameter must be chosen slightly less than 50 for a short SS. But the indicator does not give profit in this market. It can be used only as an additional indicator.
Balance Volume, Equilibrium Volume, On-Balance Volume (OBV)
The OBV indicator is a cumulative moving average trading volume taken with a plus sign in the case of a growing market and with a minus sign in the case of a falling one.
Here we will use this way of interpreting the value of indicators: buy when the OBV crosses its moving average from the bottom up, sell when the OBV crosses its moving average from the top down.
More on Wiki or Colby
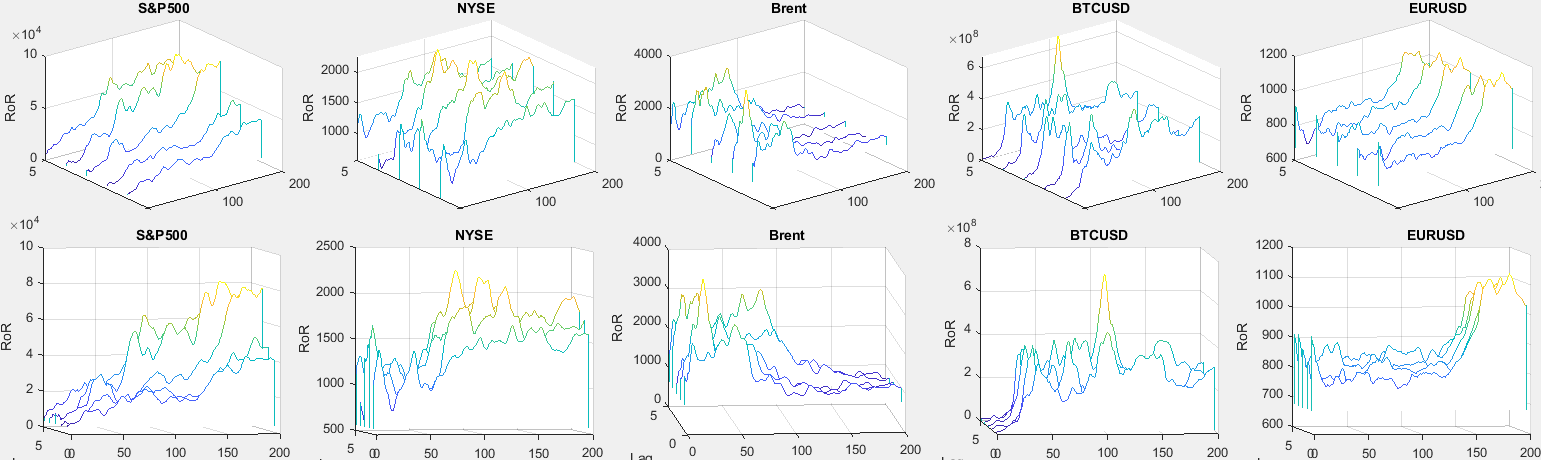
In the S & P500 market, the indicator is very sensitive to delays (lags), but you can try to choose a parameter on the principle of “the more the better”, some profitability is achieved. On the NYSE, profitability cannot be achieved. In the Brent market, you can select a parameter value from 20 to 100. In the BTCUSD market, there is no clear linear relationship, but choosing a parameter value less than 40 is impractical. For the EURUSD market, the value of the parameter must be chosen “the more the better”, but profitability cannot be achieved.
Keltner Channel
TIR consists of two bands above and below the moving average price, the width of which is defined as a fraction of the average price change for the period. The price is a typical price.
The midline of the indicator line is a simple moving average of the typical price.
The upper and lower lines of the indicator are separated from the midline by an amount equal to the simple moving average of the daily trading range.
In our calculations, the TIR signal will be formed as follows: Buy if the price crosses the upper line, Sell if the price crosses the lower one.
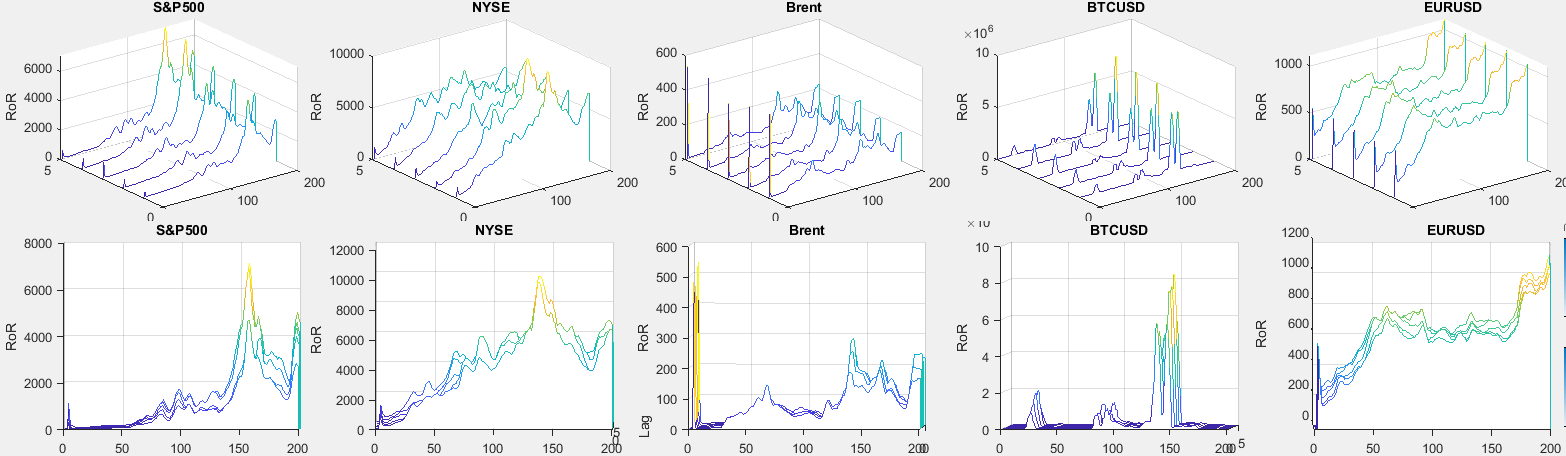
There are highs for the S & P500 and NYSE markets. In the Brent market, there is no dependence of the result on the parameter, and all trading is at a loss. There are highs in the BTCUSD market, but narrow ones, and it’s hard to get into them. In the EURUSD market, there is a dependence of the result on the parameter.
Price and volume trend, Price and volume trend, Price – Volume Trend, PVT
The value of the PVT indicator represents the cumulative sum of the product of the current trading volume by the given price increase relative to the previous period.
We will generate trading signals here as follows: Buy when the PVT crosses its moving average from the bottom up, Sell when the PVT crosses its moving average from the top down.
Read more on Wiki . Colby did not find. For the S & P500, the value of the parameter “the bigger the better”, there is almost no dependence on the NYSE, for Brent there is a maximum in the region of 50, on BTCUSD the indicator is effective only with minimal lags, 1-2, and with minimum parameter values, up to 50 , for EURUSD the dependence is increasing.
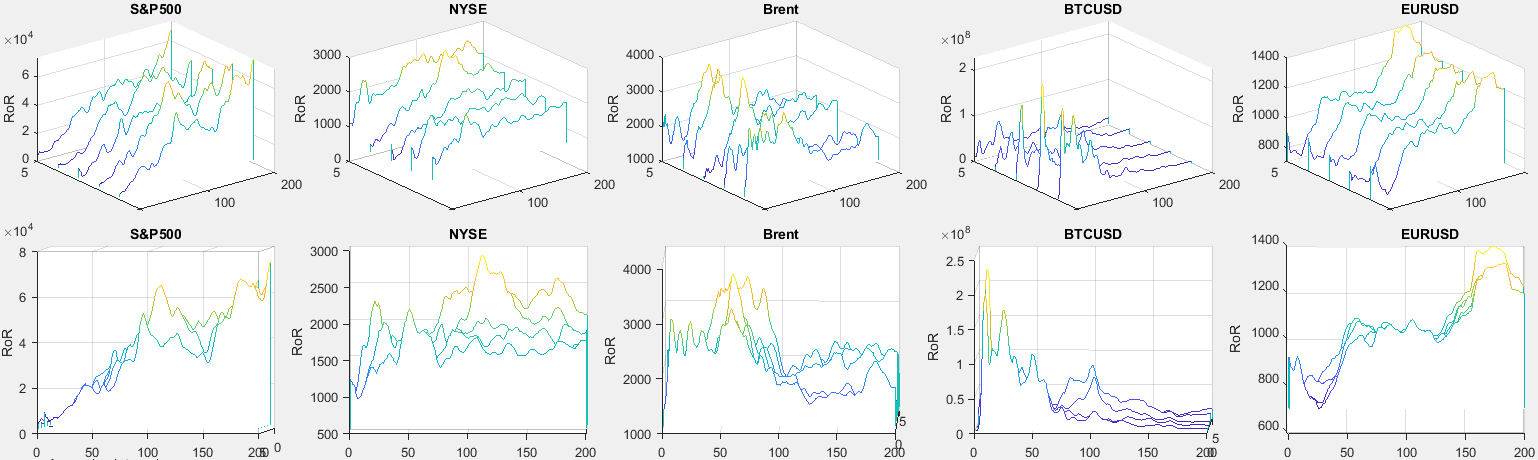
Ease of Movement, Arms' Ease of Movement Value, EMV
TIR EMV is a numerical expression of how easily a price changes in a market. The stronger the price change and the lower the turnover, the easier the market rises or falls.
Trading orders here we will form as follows: Buy when the moving average EMV rises above zero, Sell when the moving average EMV falls below zero.
More on Wiki or Colby. There are highs in the S&P and NYSE markets; in the Brent market, the indicator is effective in a wide range of parameter values. In the BTCUSD and EURUSD markets, the indicator is ineffective.
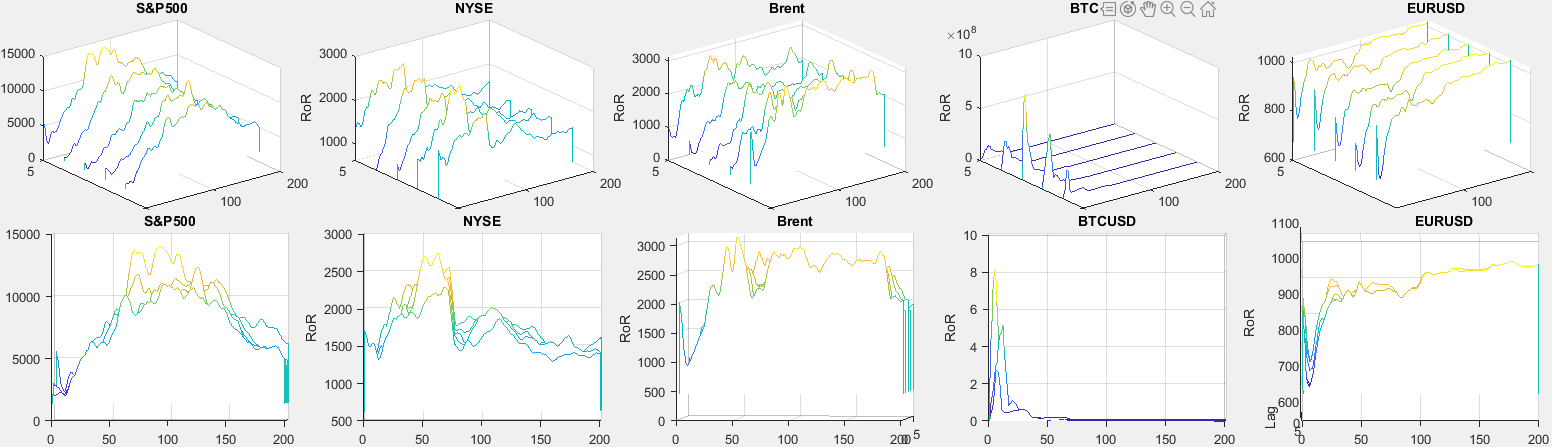
Commodity channel index, CCI
TIR CCI is an indicator based on the analysis of the current change in the price deviation from its average value for a certain period and the average absolute value of this parameter. TIR is applicable to any financial markets.
We will form the trading orders as follows: Buy when the CCI rises above 100, Sell when the CCI falls below 100.
More on Wiki or Colby. In the S & P500, NYSE, Brent markets, there is no dependence of the trading result on the value of the parameter. There is a dependence on the BTCUSD market (two clear highs), and you can try to catch it in real trading. In the EURUSD market, the indicator of results will not bring. Sources available on github

Create common objects, upload data, either mine (as I said before, all markets except the last are taken from Yahoo Finance), or your own, create functions for calculating, calculate trading performance data (as I said earlier, calculating each indicator for up to 20 minutes) .
The general conclusion regarding the TIR : the use of only one indicator for profit is impossible. Different indicators are differently effective in different markets. The possibility of making a profit using several well-tuned indicators plus additional external information is not excluded.
Additionally:
Three more indicators were analyzed that are not included in the article. But they failed to get any result. Perhaps their study will be continued.
It is very convenient to perform calculations and complex modeling of TIR and financial activities in general on Oracle Database.