How we build a system for processing, storing and analyzing data in SIBUR
In early 2018, we actively began the process of digitization of production and processes in the company. In the petrochemical sector, this is not just a fashion trend, but a new evolutionary step towards increasing efficiency and competitiveness. Taking into account the specifics of the business, which shows good economic results even without any digitalization, the “digitalisers” face a difficult task: after all, changing the established processes in the company is a rather painstaking job.
Our digitalization began with the creation of two centers and corresponding functional blocks.
This is the “Digital Technology Function”, which includes all product areas: process digitalization, IIoT and advanced analytics, as well as a data management center, which has become an independent direction.

And that's just the main task of the data office is to fully implement a culture of decision-making based on data (yes, yes, data-driven decision), as well as, in principle, streamline everything related to working with data: analytics, processing storage and reporting. The peculiarity is that all our digital tools must not only actively use their own data, that is, those that generate themselves (for example, mobile bypasses, or IIoT sensors), but also external data, with a clear understanding of where and why they are needed use.
My name is Artem Danilov, I am the head of the “Infrastructure and Technologies” department in SIBUR, in this post I will tell you how and on which we build a large data processing and storage system for the whole SIBUR. To begin, let's talk only about high-level architecture and how you can become part of our team.
Here are the areas that work in the data office includes:
1. Working with data
Here are the guys who are actively engaged in inventorying and cataloging our data. They understand the needs of a particular function, can determine what kind of analytics you may need, which metrics should be monitored for decision making and how data is used in a particular business area.
2. BI and data visualization The
direction is closely related to the first and allows you to visually present the result of the work of the guys from the first team.
3. Direction of data quality control
Here, data quality control tools are being introduced and the implementation of the entire methodology of such control is being carried out. In other words, the guys from here implement software, write various checks and tests, understand how cross-checks occur between different systems, note the functions of those employees who are responsible for the quality of the data, and also establish a common methodology.
4. NSI management.
We are a big company. We have many different kinds of reference books - and contractors, and materials, and a directory of enterprises ... In general, believe me, reference books are more than enough.
When a company actively buys something for its business, it usually has special processes for filling in these directories. Otherwise, chaos will reach such a level that it will be impossible to work from the word “absolutely”. We also have such a system (MDM).
The problem here is this. For example, in one of the regional divisions, of which we have a lot, employees sit and enter data into the system. Bring hands, with all the consequences of this method. That is, they need to enter data, verify that everything has arrived in the system in the desired form, without duplicates. However, some things, in the case of filling in some details and required fields, you have to search and google yourself. For example, you have an INN company, and you need the rest of the information — you check through special services and an Unified Statements Incorporation.
All this data, of course, already exists somewhere, so it would be right to just automatically pull them up.
Previously, in the company, in principle, there was no single position, a clear team that would deal with it. There were a lot of disparate units manually entering data. But it is usually difficult for such structures to even formulate what exactly and where exactly in the process of working with data it is necessary to change everything so that everything is excellent. Therefore, we are revising the format and management structure of the NSI.
5. Implementation of the data warehouse (data node)
That's exactly what we started to do in this area.
Let's immediately define the terms, or the phrases that I use may intersect with any other concepts. Roughly speaking, data node = data lake + data warehouse. A little further I will reveal this in more detail.
First of all, we tried to estimate with which data exactly we have to work - what systems are there, what sensors. They understood that they would be like streaming data (this is what enterprises themselves generate from all their equipment, these are IIoT, etc.) and classical systems, different CRM, ERP and the like.
Understood that the data in current systems will not be straightforward in order to quite a lot in terms of volume, but with the introduction of digital tools and IIoT there will be a lot of them. And there will be very heterogeneous data from the classical accounting systems. Therefore, they invented the architecture of such a plan.

Further details on the blocks.
This is the main core of our platform. What is used to process and store data. The task is to load data from more than 60 different systems when they start delivering them. That is, there is generally all the data that may be useful for making some decisions.
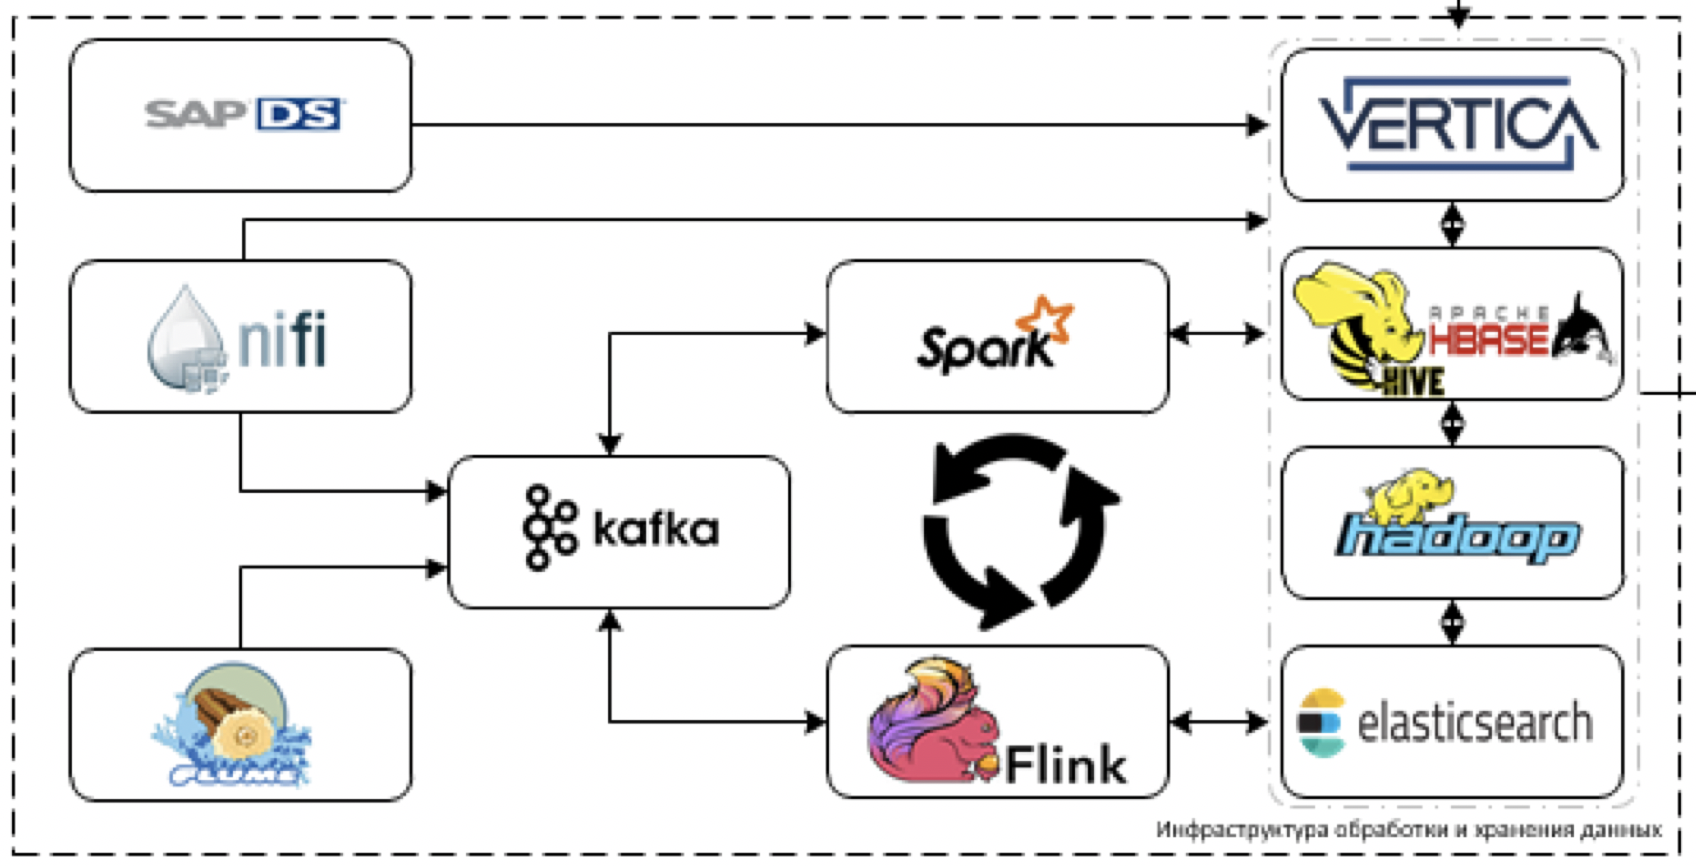
Let's start with the extraction and processing of data. For these purposes, we plan to use the NiFi ETL tool for streaming and packet data, as well as streaming processing tools: Flume for initial data reception and decoding, Kafka for buffering, Flink and Spark Streaming as the main tools for processing data streams.
The most difficult to work with systems stack SAP. You need to extract data from SAP using a separate ETL tool - SAP Data Services.
As storage tools, we plan to use the Cloudera Hadoop platform (HDFS, HBASE, Hive, Impala itself), the analytical DBMS Vertica, and, for individual cases, elasticsearch.
In principle, we use the most modern stack. Yes, you can try to shower us with tomatoes and make fun of what we call the most modern stack, but in reality - it is.
We are not limited to legacy development, but we cannot use the bleeding edge in an industrial solution due to the obvious enterprise orientation of our platform. Therefore, maybe we are not dragging Horton, but confine ourselves to Clouder, wherever possible, we are definitely trying to drag a newer tool.

For data quality control, SAS Data Quality is used, and Airflow to manage all this good. Monitoring of the entire platform is done through the ELK stack. For the most part, we are planning to do visualization on Tableau, some completely static reports on SAP BO.
We already understand that some of the tasks cannot be implemented through standard BI solutions, since it requires a completely sophisticated real-time visualization with a lot of cardboard controls. Therefore, we will write our own visualization framework that could be embedded in the developed digital products.
If you look a little wider, now we are building a single digital platform with colleagues from the function of digital technologies, whose task is to quickly develop our own applications.
Data Lake is one of the elements of this platform.
As part of this activity, we understand that we will need to implement a convenient interface for accessing analytical data. Therefore, we plan to implement the Data API and the production object model for more convenient access to production data.
In addition to storing and processing data, all machine learning will work on our platform, as well as the IIoT framework. The lake will act both as a source of data for training and model work, and as power for model work. Now an ML framework is ready that will work on top of the platform.

Right now the team has me, a couple of architects and 6 developers, so we are actively looking for new people (I need data architects and data engineers ) who will help us with the development of the platform. There is no need to poke around at the legacy (the legacy here is only at the entrance from the systems), the stack is fresh.
That's where the subtleties will be - it's in the integrations. Connecting the old with the new, so that it all works fine and solves the problem is a challenge. In addition, it will be necessary to invent, work out and hang a bunch of very different metrics.
Data collection is carried out from all major systems - 1C, SAP and a lot of everything else. On the basis of the data collected here, all analytics, all prediction, all digital reporting will be built.
Briefly enough, we want to make you work with data really cool. For example, marketing and sales - they have people who collect all the statistics by hand. That is, they sit and pump out disparate data from different formats from 5 different systems, load them from 5 different programs, then unload themselves into an Excel file for all this to be considered. Then they bring information into a single Excel table, somehow trying to do visualization.
In general, the time it takes the car to all this. We want to solve similar problems with our platform. And in the following posts we will describe in detail how we linked the elements together and set up the correct operation of the system.
By the way, besides the architects and data engineers in this team, we will be happy to see:
Our digitalization began with the creation of two centers and corresponding functional blocks.
This is the “Digital Technology Function”, which includes all product areas: process digitalization, IIoT and advanced analytics, as well as a data management center, which has become an independent direction.
And that's just the main task of the data office is to fully implement a culture of decision-making based on data (yes, yes, data-driven decision), as well as, in principle, streamline everything related to working with data: analytics, processing storage and reporting. The peculiarity is that all our digital tools must not only actively use their own data, that is, those that generate themselves (for example, mobile bypasses, or IIoT sensors), but also external data, with a clear understanding of where and why they are needed use.
My name is Artem Danilov, I am the head of the “Infrastructure and Technologies” department in SIBUR, in this post I will tell you how and on which we build a large data processing and storage system for the whole SIBUR. To begin, let's talk only about high-level architecture and how you can become part of our team.
Here are the areas that work in the data office includes:
1. Working with data
Here are the guys who are actively engaged in inventorying and cataloging our data. They understand the needs of a particular function, can determine what kind of analytics you may need, which metrics should be monitored for decision making and how data is used in a particular business area.
2. BI and data visualization The
direction is closely related to the first and allows you to visually present the result of the work of the guys from the first team.
3. Direction of data quality control
Here, data quality control tools are being introduced and the implementation of the entire methodology of such control is being carried out. In other words, the guys from here implement software, write various checks and tests, understand how cross-checks occur between different systems, note the functions of those employees who are responsible for the quality of the data, and also establish a common methodology.
4. NSI management.
We are a big company. We have many different kinds of reference books - and contractors, and materials, and a directory of enterprises ... In general, believe me, reference books are more than enough.
When a company actively buys something for its business, it usually has special processes for filling in these directories. Otherwise, chaos will reach such a level that it will be impossible to work from the word “absolutely”. We also have such a system (MDM).
The problem here is this. For example, in one of the regional divisions, of which we have a lot, employees sit and enter data into the system. Bring hands, with all the consequences of this method. That is, they need to enter data, verify that everything has arrived in the system in the desired form, without duplicates. However, some things, in the case of filling in some details and required fields, you have to search and google yourself. For example, you have an INN company, and you need the rest of the information — you check through special services and an Unified Statements Incorporation.
All this data, of course, already exists somewhere, so it would be right to just automatically pull them up.
Previously, in the company, in principle, there was no single position, a clear team that would deal with it. There were a lot of disparate units manually entering data. But it is usually difficult for such structures to even formulate what exactly and where exactly in the process of working with data it is necessary to change everything so that everything is excellent. Therefore, we are revising the format and management structure of the NSI.
5. Implementation of the data warehouse (data node)
That's exactly what we started to do in this area.
Let's immediately define the terms, or the phrases that I use may intersect with any other concepts. Roughly speaking, data node = data lake + data warehouse. A little further I will reveal this in more detail.
Architecture
First of all, we tried to estimate with which data exactly we have to work - what systems are there, what sensors. They understood that they would be like streaming data (this is what enterprises themselves generate from all their equipment, these are IIoT, etc.) and classical systems, different CRM, ERP and the like.
Understood that the data in current systems will not be straightforward in order to quite a lot in terms of volume, but with the introduction of digital tools and IIoT there will be a lot of them. And there will be very heterogeneous data from the classical accounting systems. Therefore, they invented the architecture of such a plan.
Further details on the blocks.
Storage
This is the main core of our platform. What is used to process and store data. The task is to load data from more than 60 different systems when they start delivering them. That is, there is generally all the data that may be useful for making some decisions.
Let's start with the extraction and processing of data. For these purposes, we plan to use the NiFi ETL tool for streaming and packet data, as well as streaming processing tools: Flume for initial data reception and decoding, Kafka for buffering, Flink and Spark Streaming as the main tools for processing data streams.
The most difficult to work with systems stack SAP. You need to extract data from SAP using a separate ETL tool - SAP Data Services.
As storage tools, we plan to use the Cloudera Hadoop platform (HDFS, HBASE, Hive, Impala itself), the analytical DBMS Vertica, and, for individual cases, elasticsearch.
In principle, we use the most modern stack. Yes, you can try to shower us with tomatoes and make fun of what we call the most modern stack, but in reality - it is.
We are not limited to legacy development, but we cannot use the bleeding edge in an industrial solution due to the obvious enterprise orientation of our platform. Therefore, maybe we are not dragging Horton, but confine ourselves to Clouder, wherever possible, we are definitely trying to drag a newer tool.
For data quality control, SAS Data Quality is used, and Airflow to manage all this good. Monitoring of the entire platform is done through the ELK stack. For the most part, we are planning to do visualization on Tableau, some completely static reports on SAP BO.
We already understand that some of the tasks cannot be implemented through standard BI solutions, since it requires a completely sophisticated real-time visualization with a lot of cardboard controls. Therefore, we will write our own visualization framework that could be embedded in the developed digital products.
Pro Digital Platform
If you look a little wider, now we are building a single digital platform with colleagues from the function of digital technologies, whose task is to quickly develop our own applications.
Data Lake is one of the elements of this platform.
As part of this activity, we understand that we will need to implement a convenient interface for accessing analytical data. Therefore, we plan to implement the Data API and the production object model for more convenient access to production data.
What else do we do and who do we need
In addition to storing and processing data, all machine learning will work on our platform, as well as the IIoT framework. The lake will act both as a source of data for training and model work, and as power for model work. Now an ML framework is ready that will work on top of the platform.
Right now the team has me, a couple of architects and 6 developers, so we are actively looking for new people (I need data architects and data engineers ) who will help us with the development of the platform. There is no need to poke around at the legacy (the legacy here is only at the entrance from the systems), the stack is fresh.
That's where the subtleties will be - it's in the integrations. Connecting the old with the new, so that it all works fine and solves the problem is a challenge. In addition, it will be necessary to invent, work out and hang a bunch of very different metrics.
Data collection is carried out from all major systems - 1C, SAP and a lot of everything else. On the basis of the data collected here, all analytics, all prediction, all digital reporting will be built.
Briefly enough, we want to make you work with data really cool. For example, marketing and sales - they have people who collect all the statistics by hand. That is, they sit and pump out disparate data from different formats from 5 different systems, load them from 5 different programs, then unload themselves into an Excel file for all this to be considered. Then they bring information into a single Excel table, somehow trying to do visualization.
In general, the time it takes the car to all this. We want to solve similar problems with our platform. And in the following posts we will describe in detail how we linked the elements together and set up the correct operation of the system.
By the way, besides the architects and data engineers in this team, we will be happy to see: