About memory leak in one server application

After reading this note, you will find out what you had to go through after an unexpected memory leak in the server application in FreeBSD. What modern means of detecting such problems exist in this environment and why the most powerful of them can be completely useless
One fine afternoon of Thursday, 5 out of 50 servers Zabbix sent notifications of running out of space on the swap section. The graph on the CPDV (free memory) clearly demonstrates the scale of the problem (the mounds on the right are the freeing up of memory due to the crowding out in swap). Fortunately, Friday is ahead, and you can calmly fix everything over the weekend. At that moment, no one had yet imagined that it would take more than 6 days to find and eliminate the cause.
About the servers.Typical servers of the generation of the tenth to eleventh years with 8GB of memory (almost completely identical and even of the same brand). Servers are divided into groups to serve different sets of user accounts.
About the application. Ad-server, HTTP (libh2o) with C \ C ++ logic, a bunch of third-party libraries and bicycles like standard C ++ containers in shared memory, etc. It accepts an incoming request, redirects to several upstream servers, holds an auction for responses and returns a response to the client. Everything turns on FreeBSD 11.0 \ 11.1.
Who's guilty?
The last changes in the code base were about ten days ago, all these days nothing remarkable happened to the memory. A cursory analysis gave such a list of the most probable reasons:
- qualitative or quantitative characteristics of incoming / outgoing requests have changed, which led to errors in allocating / freeing memory;
- bicycles with containers in shared memory. They always arouse suspicion if something goes wrong;
- there is no leak, it just got more data and now they have stopped interrupting;
- the result of updating the kernel of the OS \ libraries. But there are no default auto-updates, it’s not some kind of Windows which, God forgive me, can roll up updates whenever it wants and, in addition, restart the machine. A couple of months ago, many services on a neighboring project collapsed.
- someone conducts a targeted network attack causing an overflow;
- Meltdown \ Specter. Yes! Surely. I don’t remember that we rolled any updates, fearing a slowdown, but such a point today simply must have a place to be in any emergency situation;
But the characteristics of the requests / responses have not changed (at least in all metrics collected). There is no more data, the network is in order, a lot of free resources, the server responds quickly ... Has the external environment changed?
What to do?
A couple of years ago something similar surfaced, but almost all the tools that helped solve the problem then managed to be forgotten. I just wanted to get rid of it as soon as possible in a couple of hours, so the first naive attempt was to find an answer to StackOverflow ... Basically, people recommend Valgrind and some unknown crafts (apparently the authors themselves), or plugins for VisualStudio (not relevant). Crafts fell almost everything, without even starting to work properly (memleax, ElectricFence, etc.), we will not dwell on them in detail.
Along the way, we recall all the recently released features, fortunately, there have been few changes over the last month, of the main ones - screwing up the GeoIP bases, and so, in detail ...
We are trying to disconnect clients and higher-level servers one by one (this method was tried one of the first, but for some reason did not give any result, the leak manifested itself in all combinations with different degrees of intensity, only a linear dependence on incoming requests was observed).
Right away, attempts were made to roll back to the old versions, right up to the audit two months ago. Memory continued to leak there. Rollback to even earlier versions was not possible due to incompatibility with other components.
The main question is why these 5 servers? All machines are almost identical (except for the difference in OS version 11 \ 11.1). The problem occurs only on a certain group of accounts. There is no hint of such behavior on the others, which means that it must be exactly dependent on incoming requests ...
Lyrical digression
Repeatedly encountering leaks in different projects, I happened to hear a lot of terrible stories about the most popular and effective method of treatment - to periodically restart a flawed application. Yes, yes, it turns out that this has worked for years in very reputable companies. It always seemed like a complete game to me, and that I would never stoop to it in my life, no matter how big the problem would be. However, already on the second day I had to register a shameful restart in cron, as restarting the application once every few hours was a rather tedious task (especially at night).
For some reason, I wanted to do everything beautifully, namely, to find a leak point by universal means. Perhaps this was one of the main mistakes made at an early stage.
So, what universal remedies for solving the described problem exist today? Basically, these are third-party libraries that wrap calls to malloc \ free and monitor all memory operations.
valgrind
A great way to detect problems. Indeed, it catches almost all types (double release, crossing borders, leaks, etc.). This whole story would have ended before it began. But with valgrind there is one problem - the almost complete uselessness for highly loaded applications. It looks something like this: the program starts 20-50 times longer than usual, then it also works, while most of the requests, of course, do not have time to work out and end in timeouts. CPU cores are loaded at 100%, while the application does not perform any useful actions, spending all resources on the valgrind virtual machine. In the logs you will find a miserable fraction of a percent of all requests that go through normally. After pressing Ctrl + C, if you're lucky, a log will appear in a few minutes, or everything will fall (I often had the second, or almost empty log). In general, it did not take off.
tcmalloc
The library is accessible from google-perftools port. According to the developers :
This is the heap profiler we use at Google.Like most such tools, it is connected either using the environment variable (LD_PRELOAD) or by compiling the library itself (-ltcmalloc). Neither method worked. Another process was discovered in the process - calling the static method HeapLeakChecker :: NoGlobalLeaks () from the code. But for some reason it was not exported to any of the library versions. Later it turns out :
[on FreeBSD] libtcmalloc.so successfully builds, and the "advanced" tcmalloc functionality all works except for the leak-checker, which has Linux-specific code.:( Let's go further.
libumem
Available from umem port. A smart way to detect memory problems. Especially in combination with MDB . Unfortunately, all this is available only in the Solaris OS, and it would be nice to port it to FreeBSD MDB . The application could not be launched with it. At startup, before calling main, a calloc is called from libthr.so, which is already intercepted by libumem. In turn, libumem tries to initialize the work with threads in its code. Recursion-s. In general, the stack, long before the main call, looks something like this:
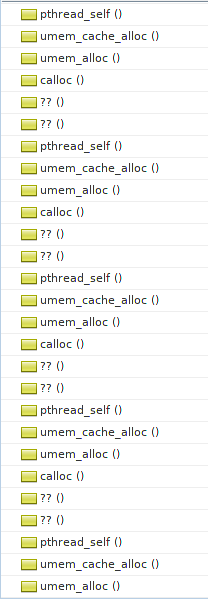
A typical egg and chicken problem, which is not clear how to get around. It was decided to postpone the idea of cutting multi-threading (fortunately, we only use it somewhere in boost dependencies and in the wrapper over getaddrinfo). Well, write to the developers (if you still havelive ) in a similar ticket opened by someone and let's go further.
dmalloc
Available from the port of the same name. It has good documentation. The stack on start-up surprisingly resembles the previous case:
(gdb) bt
#0  0x0000000802c8783e in dmalloc_malloc ()
   from /usr/local/lib/libdmallocthcxx.so.1
#1  0x0000000802c88623 in calloc () from /usr/local/lib/libdmallocthcxx.so.1
#2  0x00000008038a8594 in ?? () from /lib/libthr.so.3
#3  0x00000008038a98d4 in ?? () from /lib/libthr.so.3
#4  0x00000008038a58fa in pthread_mutex_lock () from /lib/libthr.so.3
#5  0x0000000802c87641 in ?? () from /usr/local/lib/libdmallocthcxx.so.1
#6  0x0000000802c87bb3 in ?? () from /usr/local/lib/libdmallocthcxx.so.1
#7  0x0000000802c8787a in dmalloc_malloc ()
   from /usr/local/lib/libdmallocthcxx.so.1
#8  0x0000000802c88623 in calloc () from /usr/local/lib/libdmallocthcxx.so.1
#9  0x00000008038a8594 in ?? () from /lib/libthr.so.3
#10 0x00000008038a98d4 in ?? () from /lib/libthr.so.3
#11 0x00000008038a58fa in pthread_mutex_lock () from /lib/libthr.so.3
#12 0x0000000802c87641 in ?? () from /usr/local/lib/libdmallocthcxx.so.1
#13 0x0000000802c87bb3 in ?? () from /usr/local/lib/libdmallocthcxx.so.1
#14 0x0000000802c8787a in dmalloc_malloc ()
But here the author is aware of the problem and has provided an original workaround: at startup, set the number of malloc calls that should be ignored (in order to avoid recursion):
You know its too low if your program immediately core dumps and too high if the dmalloc library says its gone recursive although with low values, you might get either problem.Cute. Picking up the cherished number, tagging between core-dumps and recursion, it was decided to anathematize this whole undertaking.
Meanwhile, the memory on the servers began to run out even faster. If before it was 5-6 hours before complete eating, now memory is completely gone in an hour. I had to tweak cron :( In addition, the set of servers prone to the problem began to grow. True, the memory on the new set of servers ran out within 24 hours. At the same time, on most machines until now there were no visible memory problems at all.
At the same time, engineers at the DC asked for additional memory on one of the servers in order to test the theory that “this data has become more” (the last, desperate attempt to make sure that this is not a leak). The DC very quickly provided an additional 8GB, which were safely eaten during the night. No one doubted the presence of a leak.
dtrace
In the process of ruthless gugglezh, mysterious scripts in the no less mysterious D language began to come across more and more. It turned out that they were all designed for an incredibly cool system utility - dtrace, a kind of IDDQD in the analysis and debugging of almost any code. I heard a lot about him, but could not be used in battle.
Those. you can ask to save all calls to certain libc functions, for example, malloc \ free, putting probes on them, collecting general statistics along the way, and even building distribution diagrams , all in a few lines of code! For example, like this:
sudo dtrace -n 'pid$target::malloc:entry { @ = quantize(arg0); }' -p 15034- you can find out the distribution of allocated blocks in any running process (in the example - pid = 15034). Here is what the distribution looks like in our application in a few seconds of monitoring:
value  ------------- Distribution ------------- count
               2 |                                         0
               4 |                                         1407
               8 |                                         455
              16 |@@                                       35592
              32 |@@@@@@@@@@@@@@@@                         239205
              64 |@@@@@@@                                  112358
             128 |@@@@                                     55813
             256 |@@@@@@                                   91368
             512 |@                                        17204
            1024 |@                                        19751
            2048 |@@                                       33310
            4096 |                                         2082
            8192 |                                         554
           16384 |                                         15
           32768 |                                         0
           65536 |                                         3960
          131072 |                                         0
Cool, right? All this on the fly, without recompilation! We must be somewhere very close to unraveling all the secrets.
You can also collect any statistics for any function exported from your application! True, with the compilation options -O1 and higher, most of the interesting functions can simply disappear from the export, the compiler will "inline" them into the code and you will not put "samples" on anything.
Brendan Gregg, an apologist for dtrace, has become a teacher and mentor for all these crazy days:
In some cases, this [dtrace] isn't a better tool - it's the only tool.He declared.
Here is something similar to what we need, but Brendan left a comment:
FreeBSD: DTrace can be used as with Solaris. I'll share examples when I get a chance.Until today, the case, unfortunately, has not happened to him. But in fact, everything is the same there as in Solaris, only mmap \ munmap is called instead of sbrk.
I had to delve into the wisdom of the D language. Many areas, for example, casting, especially aggregated values, could not be defeated.
At first, I decided to try a slightly redone script from here :
The code
#!/usr/sbin/dtrace -s
/*#pragma D option quiet*/
/*#pragma D option cleanrate=5000hz*/
pid$1::mmap:entry
{
    self->addr = arg0;
    self->size = arg1;
}
pid$1::mmap:return
/self->size/
{
   addresses_mmap[arg1] = 1;
   printf("<__%i,%Y,mmap(0x%lx,%d)->0x%lx\n", i++, walltimestamp, self->addr, self->size, arg1);
   /*ustack(2);*/
   printf("__>\n\n");
   @mem_mmap[arg1] = sum(1);
   self->size=0;
}
pid$1::munmap:entry
/addresses_mmap[arg0]/
{
   @mem_mmap[arg0] = sum(-1);
   printf("<__%i,%Y,munmap(0x%lx,%d)__>\n", i++, walltimestamp, arg0, arg1);
}
pid$1::malloc:entry
{
    self->size = arg0;
}
pid$1::malloc:return
/self->size > 0/
{
   addresses_malloc[arg1] = 1;
   /*
   printf("<__%i,%Y,malloc(%d)->0x%lx\n", i++, walltimestamp, self->size, arg1);
   ustack(2);
   printf("__>\n\n");
   */
   @mem_malloc[arg1] = sum(1);
   self->size=0;
}
pid$1::free:entry
/addresses_malloc[arg0]/
{
   @mem_malloc[arg0] = sum(-1);
   /*printf("<__%i,%Y,free(0x%lx)__>\n", i++, walltimestamp, arg0);*/
}
END
{
   printf("== REPORT ==\n\n");
   printf("== MMAP ==\n\n");
   printa("0x%x => %@u\n",@mem_mmap);
   printf("== MALLOC ==\n\n");
   printa("0x%x => %@u\n",@mem_malloc);
}
It looks quite simple: we save all calls to malloc \ free, as well as the places of their calls. On malloc - increase the counter at the address, on free - decrease. Then we study the received log and find a leak (addresses with counters> 0). The whole problem is that at ~ 150K mallocs per second, the ustack () function (saving the stack, i.e. the place of the call) begins to literally bury the whole process with its weight (similar to the case with valgrind). I tried to remove the stack from the output and simply collect the addresses and counters to them, as a result, for some reason, many counters were deeply in the minuses (was it really a spoiled heap and double releases?), And there were practically no addresses with positive counter values ... At the same time, dtrace often spitting errors like:
dtrace: 3507 dynamic variable drops with non-empty dirty list
dtrace: 2133 dynamic variable drops
dtrace: 120 dynamic variable drops with non-empty dirty list
dtrace: 993 dynamic variable drops
dtrace: 176 dynamic variable drops with non-empty dirty list
dtrace: 1617 dynamic variable drops
dtrace: 539 dynamic variable drops with non-empty dirty list
dtrace: 10252 dynamic variable drops
dtrace: 3830 dynamic variable drops with non-empty dirty list
dtrace: 17048 dynamic variable drops
dtrace: 39483 dynamic variable drops
dtrace: 1121 dynamic variable drops with non-empty dirty list
dtrace: 35067 dynamic variable drops
dtrace: 32592 dynamic variable drops
dtrace: 10081 dynamic variable drops with non-empty dirty list
Also, messages about broken addresses on the stack often flickered.
This suggested that he simply did not have time to correctly process all the events, so the counters go to the minus ... Or this is a problem with the heap / stack. In addition, there were 1.5 times more calls for free than mallocs (does it mean, double releases?)
I decided to ask the dtrace mailing list for help .

Judging by the archive, the once-busy newsletter was going through hard times. To my great amazement, the answer came in the first minutes, although only two participants reacted. One suggested using an argument specifying the number of stack frames to save: ustack (nframes). This did not help, even ustack (1) killed the whole process. They also advised me to use libumem (probably believing that I crawled with Solaris).
Then went unsystematic attempts, such as: collecting statistics on the sizes allocated by mallocs, and trying to filter out only certain sizes, well, in order to somehow reduce the frequency of the sensors. To no avail, it feels like ustack () is designed for the most minimal loads, say, up to 100 calls per second. Or you need to be able to cook it correctly, saving the result in some infinite internal buffer, without spinning the stack on each request. But, unfortunately, this did not come to this.
I tried to approach the task from the other side - to start counting the calls of the designers and destructors of all objects in the code, then I actually do not need to save the stack. This also did not produce results. No discrepancies were revealed, although, of course, I was too lazy to “test” all the objects in the code, and I limited myself to just suspicious ones.
About demangle
To install sensors in the calls of their functions, it is required to produce the so-called demangle of names. Here, as if it were evil, FreeBSD threw another surprise . Plain:
crashes the utility. The bug is still not fixed in 11.1. I had to run demangle-ing on one of the servers with version 11.0.
echo _ZZN7simlib318SIMLIB_create_nameEPKczE1s | /usr/bin/c++filtcrashes the utility. The bug is still not fixed in 11.1. I had to run demangle-ing on one of the servers with version 11.0.
Everything began to resemble a fight with windmills.
In general, the output of dtrace claimed that it was not a leak, but a corrupted heap / double release. If this is true, then everything is very bad, without specials. libraries are not enough.
But all this turned out to be complete nonsense and only led away from the target to the side for several days.
jemalloc
It is noteworthy that FreeBSD itself uses a very cool and advanced memory manager, even with shaggy version 7. Rather, I just completely forgot about it ... By the number of settings and options, all other wrapper libraries did not even lie nearby. Having tinkered with the docks, I managed to launch the application with the option:
setenv MALLOC_CONF utrace:trueThen, following the instructions from here, collect (ktrace) and generate (kdump) a log of all memory operations. Among them were reallocs that didn’t work in the script from the article, and the second version of the script from the comments (correctly processing reallocs) led to a non-existent page (and even the Wayback Machine could not find anything). I had to add support for reallocs, but in fact it only gave a bunch of pointers where a leak might be happening, without any hint of where and by whom they were allocated.
By skimming through nearby trace output, we may be able to understand a bit more about the location of the leak in the source too :-)- joked the author of the article.
In order for other jemalloc options to work (for example: detecting double releases, going out of arrays, extended statistics on accessing memory, etc.), either the whole core with extra was required. options, or CURRENT OS assembly (what we managed to understand from man). However, it was the sixth day of the search, and further digging into jemalloc was decided to be suspended, although the topic is very interesting and I hope to return to it (I hope not in similar circumstances).
What ultimately helped to find the leak
Disabling each module and application subsystem and their combinations in turn. I would go this way at the very beginning - and the problem would be solved within a day, but how many new and interesting things I would have to miss!
In every sad story, there must be positive aspects.
Notes of positive
- in the process of searching for a needle, a number of small (and not so) bugs were fixed, mainly memory allocation, where you can do without them;
- removed ARC ZFS (why is it needed on an HTTP server that does not write anything to disk, only memory eats, and very significantly );
- articles on virtual destructors and other tricky pieces from the world of C ++ were studied;
- written with a dozen scripts in D, an uncountable number of tutorials have been viewed (by dtrace);
- Immersion in different malloc \ free implementations, familiarity with the concepts of arenas and slabs;
- studied all known bugs related to memory in all third-party libs used in the project;
- Learned the history and drama that unfolded around the Solaris OS in the last years of its existence;
- GDB skills upgraded / restored.
Madness that you should not fall into even in moments of complete despair
- send everything away and move to Linux. I think this thought has repeatedly visited any ardent supporter of FreeBSD, caused by the lack of full Google Chrome, Skype, or cool self-written system utilities . Do not panic, sooner or later all problems will be solved and you will return to your favorite OS again;
- attempts to crawl the hex-viewer into the swap partition (why? see what is being pushed out of memory and try to guess where the leak is, haha);
- to cut out all multithreading from the application so that most of the funds earned higher;
- hire a professional freelancer to fix everything quickly.
conclusions
- Thoroughly logging all changes in releases. In almost all cases, a leak will be associated with one of the most recent commits. If you are extremely unlucky, then with a commit over the last couple of months. Try to roll back all changes, one at a time and in combinations, double-check everything several times. The slightest mistake - and you will be carried away for several days / weeks in the wrong direction;
- If time is too expensive for you - do not try to use universal leak detection tools, especially in high-load projects;
- The dtrace's virtuosity was not enough and one could manage to handle only a small percentage of all requests. But here in post-mortem processing you need to correctly filter out false positives, etc. Unfortunately, there was not enough time and energy to master this approach.
I think the ending of this story is a big luck. It was fortunate that the leak was stably reproduced throughout the search. That there was an opportunity to restart the rebuilt application on one of the release servers as many times as needed without much harm to users. That from the release of the bug to the occurrence of the problem it took only a few days, and not half a year, when the chances of finding a problem would be vanishingly small ...
Questions and answers
So what, after all, was the cause of the leak?
As mentioned above, the server holds an auction among the responses of the higher servers. If the answers come above the maximum value, then they are "clipped" (top N results are taken).
The top is stored in std :: list, where the elements are pointers to bid objects. One of the commits introduced such wonderful code to crop the top: list.resize (max_results). As you might have guessed, list.resize does not call delete on pointer elements. You need to go around and use the handles to free the memory of all the extra pointers before calling resize.
Why hasn't the leak been felt for such a long time after the release of the bug version?
Server responses always got into top N results and nothing was cut off. It’s just that at some point certain users had more answers and they stopped interfering with the top.
Why did not rollback to previous versions help to immediately identify the problem?
The human factor played here. The fact is that at the start, the application begins to actively eat up memory, slowing down the intensity for several hours. Probably, in the heat of the search, this was perceived as an ongoing leak, and the problem spot could not be identified.
Why did the problem appear only on a certain part of the servers?
Due to the accounts serviced on this group of servers. Some of them in the auction began to return a huge number of bids that do not fit into the top. For other accounts served by other servers, all responses were included in the top auction, or rarely exceeded max. list size.
Tell your stories of dealing with leaks, especially in Java. Is the “restart the application every N minutes” method really so popular as a universal solution? Is it all so sad in Linux or “tcmalloc and co.” Really help “find and neutralize” right away?
UPD1 : While preparing this text, I accidentally stumbled upon the possibility of detecting leaks using clang , it would be interesting to try ...
Thanks to everyone who read to the end!