December 23, 2017 at 07:51
POWA-like PostgreSQL monitoring with Prometheus
- Tutorial
Background
For collecting and conveniently viewing data on how PostgreSQL works (overall server performance, slowest queries, most frequent queries), we have long used the excellent POWA utility . However, this solution was far from ideal and we managed to find a better option, moreover, fully integrated with our main monitoring system.
POWA minimally satisfied most of our needs:
- Easy to install and operate (install the extension for Postgres, install the web-face, use it);
- It has a web interface (the developers here do not have access to the production server, but I want to see how the database behaves);
- Collects the minimum necessary metrics for us.
However, there were unpleasant cons:
- Inconvenient to watch data from multiple servers;
- The interface does not customize;
- There is no way to fasten (without pain) a centralized authorization;
- There is no way to add your own metrics;
- No integration with our monitoring system (we use Prometheus to collect metrics and Grafana to visualize them).
A couple of POWA screenshots for example:

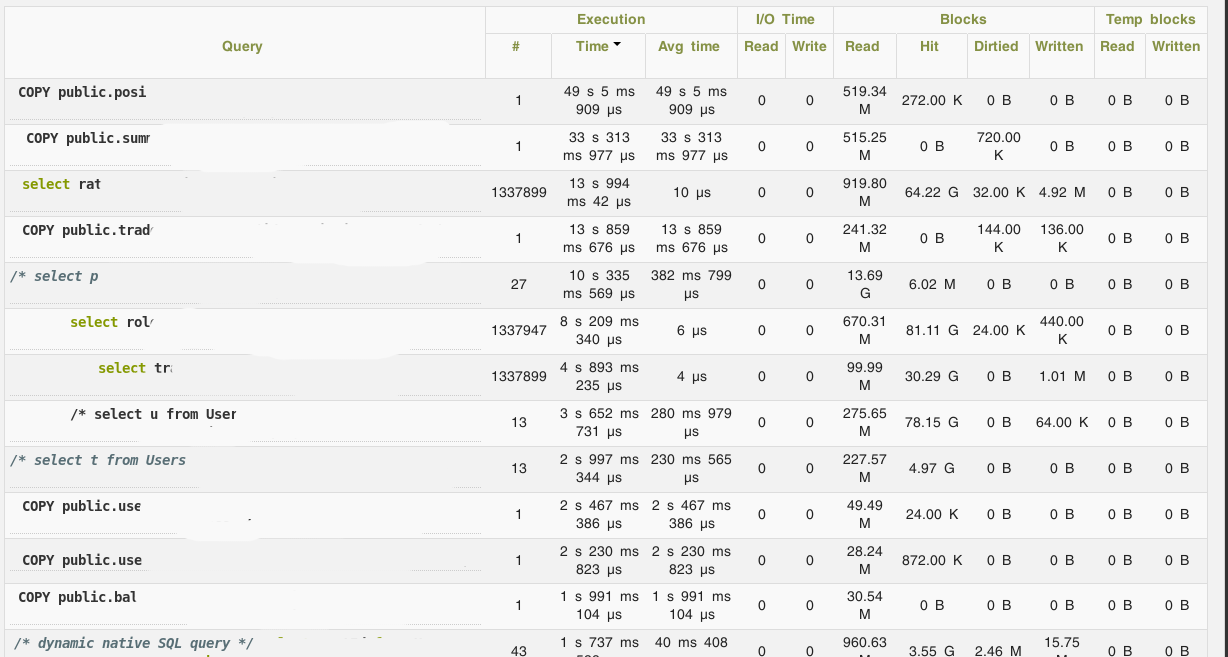
In this regard, it was decided to try to collect metrics with PostgreSQL using postgres_exporter for Prometheus.
Installation
TL; DR: here is the role for Ansible, it was written under CentOS 7, but after minimal changes (replacing firewalld with iptables) it should work on any systemd systemd - https://github.com/UnitedTraders/ansible-postgresql-exporter
Solution Architecture
I will not talk in detail about Prometheus itself, there are enough materials about it, but I will go through the general architecture and exporter.
Prometheus uses the pull metric collection model: it has a list of exporters and it polls them over HTTP, collecting a list of metrics from them and putting them in its repository.
An exporter is an agent that collects metrics directly from an entity (the server as a whole, or a specific application) that needs to be monitored. Prometheus has rich opportunities for instrumentation, therefore exporters are available for most popular applications, and writing your own in case of need is not difficult.
postgres_exporter works as follows: it connects to PostgreSQL, executes queries to service tables, and exposes the results in a special format using an internal HTTP server for collection by Prometheus. An important point: in addition to a large set of default queries, you can define your own and collect any data that can be obtained using SQL, including some business metrics.
Thus, setting up postgres_exporter reduces itself to three actions:
- Install postgres_exporter on the server we want to monitor;
- Write requests (if necessary) to monitor your parameters;
- Show the Prometheus server where to get the metrics from.
Exporter Installation
The exporter is written in Go, so everything is trite:
- Download the desired binary from https://github.com/wrouesnel/postgres_exporter/releases
- Define the environment variable in the env file
DATA_SOURCE_NAME="postgresql://postgres@localhost:5432/?sslmode=disable" - Create a systemd unit, such as this:
[Unit]
Description=Prometheus exporter for Postgresql (https://github.com/wrouesnel/postgres_exporter)
[Service]
WorkingDirectory=/opt/postgres_exporter
EnvironmentFile=/opt/postgres_exporter/env
ExecStart=/opt/postgres_exporter/postgres_exporter_v0.4.1_linux-amd64/postgres_exporter --extend.query-path=/opt/postgres_exporter/metrics.yaml --web.listen-address=:9187
User=pg_exporter
[Install]
WantedBy=multi-user.target- We create a file with custom requests for our metrics (see below);
- We start the service.
Customize Your Metrics
By default, postgres_exporter is not able to collect data on requests. But PostgreSQL has a very useful extension pg_stat_statementsthat does just that. Setting pg_stat_statements comes down to three simple steps:
- Install contrib modules for PostgreSQL;
- Add parameter to postgresql.conf
shared_preload_libraries = 'pg_stat_statements'; - Create an extension in Postgres:
CREATE EXTENSION pg_stat_statements.
Because It was important for us to collect the query execution time in the first place, then the metric file turned out like this:
pg_database:
  query: " SELECT pg_database.datname, pg_database_size(pg_database.datname) as size FROM pg_database"
  metrics:
    - datname:
        usage: "LABEL"
        description: "Name of the database"
    - size:
        usage: "GAUGE"
        description: "Disk space used by the database"
pg_stat_statements:
  query: "SELECT queryid, datname, left(query, 100) as short_query, sum(calls) as calls, sum(total_time) as total_time, min(min_time) as min_time, max(max_time) as max_time, sum(mean_time*calls)/sum(calls) as mean_time FROM pg_stat_statements JOIN pg_database ON pg_stat_statements.dbid = pg_database.oid group by queryid, short_query, datname"
  metrics:
    - queryid:
        usage: "LABEL"
        description: "Query ID"
    - datname:
        usage: "LABEL"
        description: "Database name"
    - short_query:
        usage: "LABEL"
        description: "Query limited to 100 symbols"
    - calls:
        usage: "COUNTER"
        description: "Number of times executed"
    - total_time:
        usage: "COUNTER"
        description: "Total time spent in the statement, in milliseconds"
    - min_time:
        usage: "GAUGE"
        description: "Minimum time spent in the statement, in milliseconds"
    - max_time:
        usage: "GAUGE"
        description: "Maximum time spent in the statement, in milliseconds"
    - mean_time:
        usage: "GAUGE"
       description: "Mean time spent in the statement, in milliseconds"
There is one pitfall: records from pg_stat_statements need to be aggregated, because In this table, there may be several records with the same combination of query id, database id and query. The presence of such records leads to a fall in postgres_exporter, because it forms the names of metrics based on these data, and they must be unique.
To simplify, I did not add read / write metrics (shared_blks_written, etc., they are added by analogy). Also, I repeat, such queries can be made to any table, and not just to pg_stat_statements.
Prometheus Query Examples
With the above config, the exporter will generate a significant number of metrics - 5 pieces for each type of request. We will aggregate them on the side of Prometheus.
Examples of queries (immediately with graphan variables for templating):
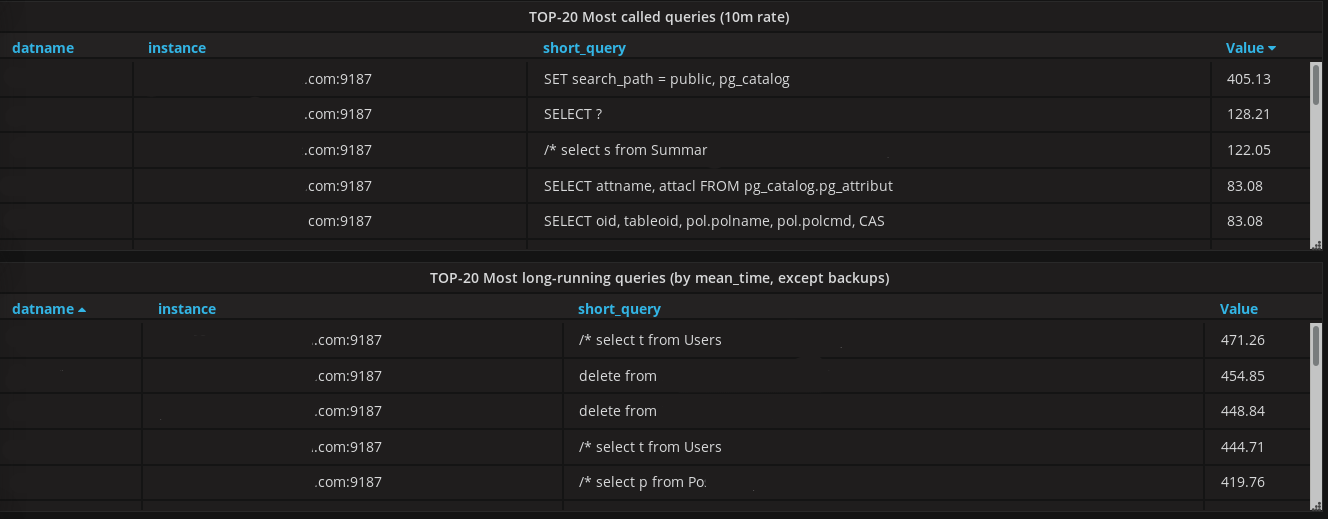
sum(rate(pg_stat_statements_mean_time{datname!~"template.*", datname!~"postgres", instance=~"$server"}[1m])) by (instance)- average request time for the last minute across the serversum(rate(pg_stat_statements_mean_time{datname!~"template.*", datname!~"postgres", instance=~"$server", datname=~"$database"}[1m])) by (datname)- average query time for the last minute for the selected databasesum(increase(pg_stat_statements_calls{datname!~"template.*", datname!~"postgres", instance=~"$server", datname=~"$database"}[1m])) by (datname)- the number of requests per minute to the databasetopk(20, increase(pg_stat_statements_calls{instance=~"$server", datname=~"$database"}[10m]))- top-20 most frequent database queries in the last 10 minutestopk(20, pg_stat_statements_mean_time{instance=~"$server", datname=~"$database"})- top-20 longest database queries
In graphan, it looks something like this ( link to json):