Monitoring as a Service: A Modular System for Microservice Architecture
Today, in addition to the monolithic code, dozens of microservices operate on our project. Each of them requires that it be monitored. To do this in such volumes by DevOps engineers is problematic. We have developed a monitoring system that works as a service for developers. They can independently write metrics into the monitoring system, use them, build dashboards on their basis, and fasten alerts to them, which will be triggered when threshold values are reached. With DevOps engineers, only infrastructure and documentation.
This post is a transcript of my presentation from our section.on RIT ++. Many asked us to make text versions of reports from there. If you were at a conference or watched a video, you won’t find anything new. And to everyone else - welcome to cat. I’ll tell you how we came to such a system, how it works and how we plan to update it.

How did we arrive at the existing monitoring system? In order to answer this question, you need to go to 2015. Here's how it looked then:
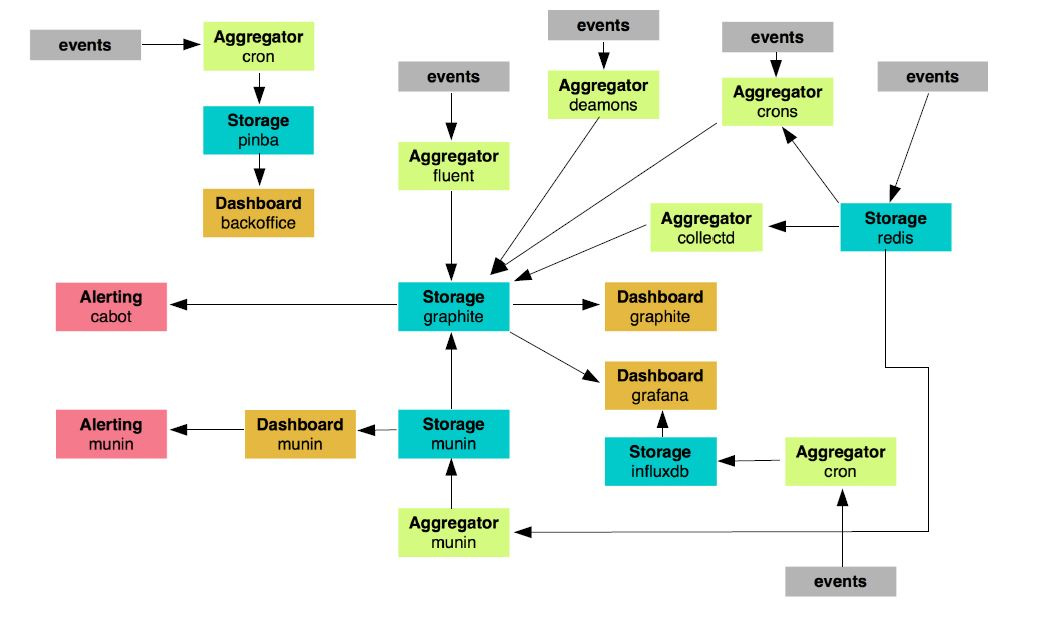
We had about 24 nodes that were responsible for monitoring. Here there is a whole bunch of different crowns, scripts, demons that monitor something somewhere, send messages, and perform functions. We thought that the further, the less such a system would be viable. It makes no sense to develop it: too cumbersome.
We decided to choose those monitoring elements that we will leave and will develop, and those that we will refuse. There were 19. There were only graphites, aggregators and Grafana left as a dashboard. But what will the new system look like? Like this:
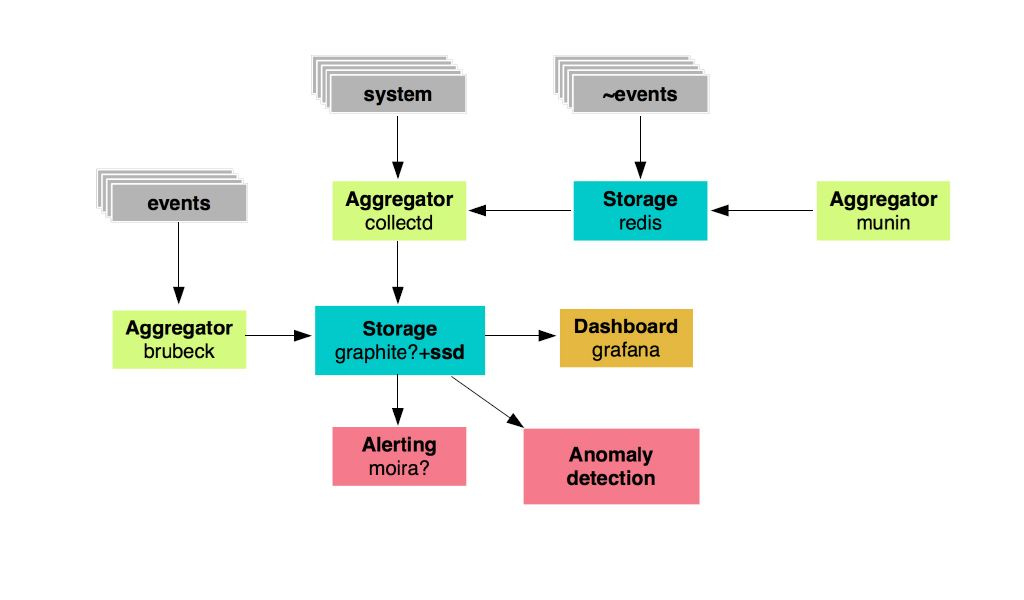
We have a repository of metrics: these are graphites that will be based on fast SSDs, these are certain aggregators for metrics. Next - Grafana to display dashboards and Moira as an alert. We also wanted to develop a system for searching for anomalies.
This is how the plans looked in 2015. But we had to prepare not only the infrastructure and the service itself, but also the documentation for it. We have developed a corporate standard for ourselves, which we called monitoring 2.0. What were the system requirements?
We needed UDP, because we have a large flow of traffic and events that generate metrics. If all of them are immediately written in graphite, the repository will fall. We also selected the first level prefixes for all metrics.
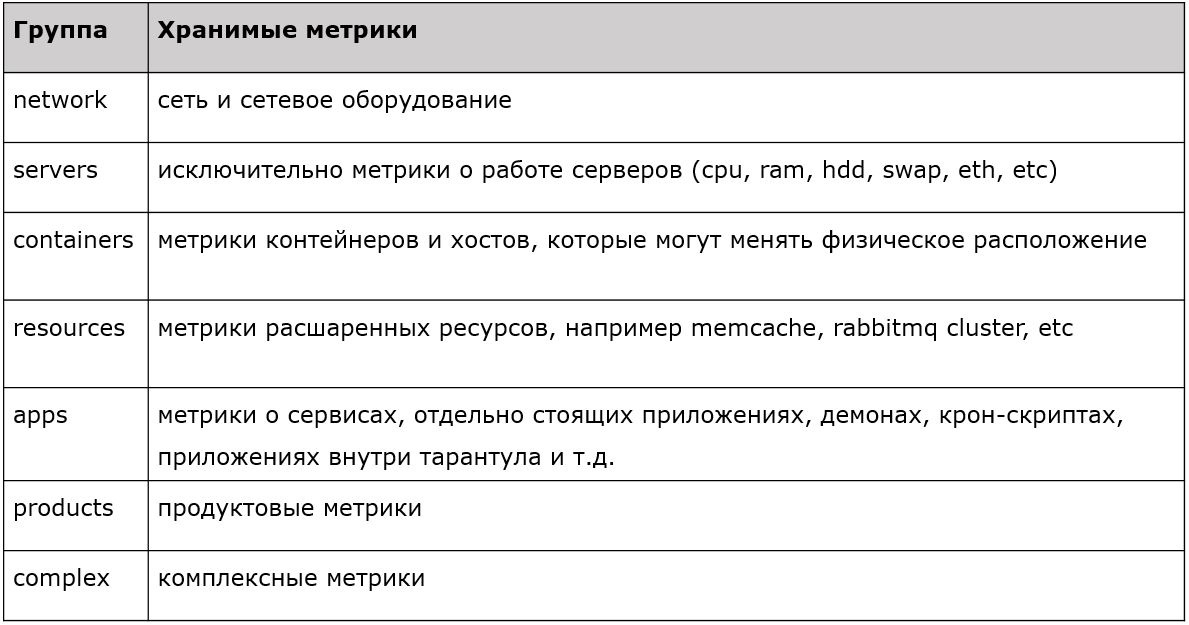
Each of the prefixes has some property. There are metrics for servers, networks, containers, resources, applications, and so on. A clear, strict, typed filtering is implemented, where we accept first-level metrics, and the rest we just drop. This is how we planned this system in 2015. What in the present?
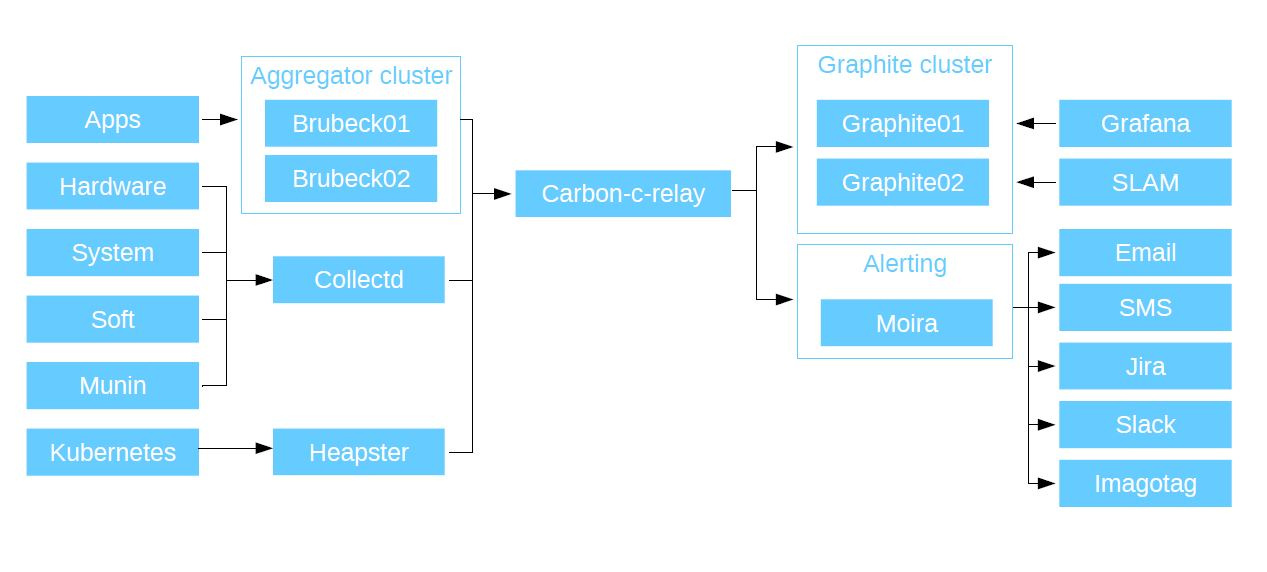
First of all, we monitor applications: our PHP code, applications and microservices - in a word, everything that our developers write. All applications via UDP send metrics to the Brubeck aggregator (statsd, rewritten in C). It turned out to be the fastest according to the results of synthetic tests. And it sends the already aggregated metrics to Graphite via TCP.
He has such a type of metrics as timers. This is a very convenient thing. For example, for each user connection to the service, you send a response time metric to Brubeck. A million answers came, and the aggregator returned only 10 metrics. You have the number of people who came, the maximum, minimum and average response time, median and 4 percentiles. Then the data is transferred to Graphite and we see them all live.
We also have aggregation for hardware metrics, software, system metrics and our old Munin monitoring system (it worked with us until 2015). We collect all this through the C'ish daemon CollectD (a whole bunch of different plugins are sewn into it, it can interrogate all the resources of the host system on which it is installed, just specify in the configuration where to write the data) and write the data through it to Graphite. It also supports python plugins and shell scripts, so you can write your own custom solutions: CollectD will collect this data from a local or remote host (suppose there is Curl) and send it to Graphite.
Then we send all the metrics that we collected to Carbon-c-relay. This is Graphite's Carbon Relay solution, finalized in C. This is a router that collects all the metrics that we send from our aggregators and routes them by nodes. Also at the routing stage, it checks the validity of the metrics. They, firstly, must correspond to the scheme with prefixes that I showed earlier and, secondly, are valid for graphite. Otherwise they drop.
Carbon-c-relay then sends the metrics to the Graphite cluster. We use Carbon-cache metrics rewritten in Go as the main repository. Go-carbon, because of its multithreading, is far superior in performance to Carbon-cache. It takes data into itself and writes it to disks using the whisper package (standard, written in python). In order to read data from our storages, we use the Graphite API. It works much faster than the standard Graphite WEB. What happens to the data next?
They go to Grafana. As the main data source, we use our graphite clusters, plus we have Grafana as a web interface for displaying metrics and building dashboards. For each of their services, developers start their own dashboards. Then they build on them graphs that display the metrics that they write from their applications. In addition to Grafana, we also have SLAM. This is a pit demon that counts SLAs based on data from graphite. As I said, we have several dozen microservices, each of which has its own requirements. With the help of SLAM, we go to the documentation and compare it with what is in Graphite and compare how the requirements correspond to the availability of our services.
We go further: alert. It is organized using a strong system - Moira. It is independent because it has its own Graphite under the hood. Developed by the guys from SKB "Kontur", written in python and Go, fully open source. Moira receives all the same stream that goes into graphite. If for some reason your store dies, then your alert will work.
We deployed Moira in Kubernetes, and it uses a cluster of Redis servers as the main database. The result was a fail-safe system. It compares the metric stream with a list of triggers: if it has no references, it drops the metric. So she is able to digest gigabytes of metrics per minute.
We also screwed corporate LDAP to it, with the help of which each user of the corporate system can create notifications for himself on existing (or newly created) triggers. Since Moira contains Graphite, it supports all its functions. So you first take a line and copy it into Grafana. See how data is displayed on graphs. And then take the same line and copy it to Moira. You weight it with limits and get an alert at the exit. To do all this, you do not need any specific knowledge. Moira can alert by SMS, email, in Jira, Slack ... It also supports the execution of custom scripts. When she has a trigger, and she is subscribed to a custom script or binary, she launches it and gives JSON to stdin on this binary. Accordingly, your program should parse it. What you will do with this JSON is up to you. If you want, send it to Telegram; if you want, open tasks in Jira, do whatever.
We also use our own development for alerts - Imagotag. We adapted the panel, which is usually used for electronic price tags in stores, for our tasks. We brought triggers from Moira to it. It indicates in what condition they are when they occurred. Some of the guys from the development refused notifications in Slack and in the mail in favor of this panel.

Well, since we are a progressive company, we also monitored Kubernetes in this system. We included it in the system using the Heapster, which we installed in the cluster, it collects data and sends it to Graphite. As a result, the circuit looks like this:
Here is a list of links to the components that we used for this task. All of them are open source.
github.com/grobian/carbon-c-relay
github.com/github/brubeck
collectd.org
github.com/moira-alert
grafana.com
github.com/kubernetes/heapster
And here are some numbers on how the system works with us.
Number of metrics: ~ 300,000 / sec.
Interval for sending metrics to Graphite: 30 sec.
Utilization of server resources: ~ 6% CPU (we are talking about full-fledged servers); ~ 1Gb RAM; ~ 3 Mbps LAN
Number of metrics: ~ 1,600,000 / min
Metric update interval: 30 sec
Metrics storage scheme: 30sec 35d, 5min 90d, 10min 365d (gives an understanding of what happens with the service for a long period of time)
Server resources use: ~ 10% CPU; ~ 20Gb RAM; ~ 30 Mbps LAN
At Avito, we greatly value the flexibility of our monitoring service. Why did he actually turn out like this? Firstly, its components are interchangeable: both the components themselves and their versions. Secondly, supportability. Since the whole project is built on open source, you yourself can edit the code, make changes, you can implement functions that are not available out of the box. Rather common stacks are used, mainly Go and Python, so this is done quite simply.
Here is an example of a real problem. Graphite metric is a file. He has a name. File Name = Metric Name. And there is a way to it. Linux file names are limited to 255 characters. And we have (as “internal customers”) guys from the database department. They tell us: “We want to monitor our SQL queries. And they are not 255 characters, but 8 MB each. We want to display them in Grafana, see the parameters for this request, and even better, we want to see the top of such requests. It will be great if it will be displayed in real time. And it would be really cool to push them into alert. ”
An example of a SQL query is taken as an example from the site postgrespro.ru
We raise the Redis server with our Collectd plugins that go to Postgres and take all the data from there, send the metrics to Graphite. But we replace the metric name with hashes. The same hash is simultaneously sent to Redis as a key, and the entire SQL query as a value. We just have to make Grafana able to go to Redis and take this information. We open the Graphite API, because this is the main interface for the interaction of all monitoring components with graphite, and we add a new function there, called aliasByHash () - from Grafana we get the metric name, and use it in the Redis query as the key, in response we get the key value, which is our “SQL query " Thus, we brought to Grafana the display of the SQL query, which, in theory, could not be displayed there, along with statistics on it (calls, rows, total_time, ...).
Availability. Our monitoring service is available 24 to 7 from any application and any code. If you have access to the repositories, you can write data to the service. Language is unimportant, decisions are not important. You only need to know how to open the socket, drop the metric there and close the socket.
Reliability. All components are fault tolerant and handle our loads well.
Low entry threshold. In order to use this system, you do not need to learn programming languages and queries in Grafana. Just open your application, enter a socket in it that will send metrics to Graphite, close it, open Grafana, create dashboards there and look at the behavior of your metrics, receiving notifications via Moira.
Independence.All this can be done by yourself, without the help of DevOps engineers. And this is an overfix, because you can monitor your project right now, you don’t need to ask anyone - neither to start work, nor to change.
All of the following is not just abstract thoughts, but something to which at least the first steps have been taken.
Thanks for attention! Ask your questions on the topic, I will try to answer here or in the following posts. Perhaps someone has experience building such a monitoring system or switching to Clickhouse in a similar situation - share it in the comments.
This post is a transcript of my presentation from our section.on RIT ++. Many asked us to make text versions of reports from there. If you were at a conference or watched a video, you won’t find anything new. And to everyone else - welcome to cat. I’ll tell you how we came to such a system, how it works and how we plan to update it.
The past: schemes and plans
How did we arrive at the existing monitoring system? In order to answer this question, you need to go to 2015. Here's how it looked then:
We had about 24 nodes that were responsible for monitoring. Here there is a whole bunch of different crowns, scripts, demons that monitor something somewhere, send messages, and perform functions. We thought that the further, the less such a system would be viable. It makes no sense to develop it: too cumbersome.
We decided to choose those monitoring elements that we will leave and will develop, and those that we will refuse. There were 19. There were only graphites, aggregators and Grafana left as a dashboard. But what will the new system look like? Like this:
We have a repository of metrics: these are graphites that will be based on fast SSDs, these are certain aggregators for metrics. Next - Grafana to display dashboards and Moira as an alert. We also wanted to develop a system for searching for anomalies.
Standard: Monitoring 2.0
This is how the plans looked in 2015. But we had to prepare not only the infrastructure and the service itself, but also the documentation for it. We have developed a corporate standard for ourselves, which we called monitoring 2.0. What were the system requirements?
- permanent availability;
- metrics storage interval = 10 seconds;
- structured storage of metrics and dashboards;
- SLA> 99.99%
- collection of event metrics over UDP (!).
We needed UDP, because we have a large flow of traffic and events that generate metrics. If all of them are immediately written in graphite, the repository will fall. We also selected the first level prefixes for all metrics.
Each of the prefixes has some property. There are metrics for servers, networks, containers, resources, applications, and so on. A clear, strict, typed filtering is implemented, where we accept first-level metrics, and the rest we just drop. This is how we planned this system in 2015. What in the present?
Present: monitoring components interaction scheme
First of all, we monitor applications: our PHP code, applications and microservices - in a word, everything that our developers write. All applications via UDP send metrics to the Brubeck aggregator (statsd, rewritten in C). It turned out to be the fastest according to the results of synthetic tests. And it sends the already aggregated metrics to Graphite via TCP.
He has such a type of metrics as timers. This is a very convenient thing. For example, for each user connection to the service, you send a response time metric to Brubeck. A million answers came, and the aggregator returned only 10 metrics. You have the number of people who came, the maximum, minimum and average response time, median and 4 percentiles. Then the data is transferred to Graphite and we see them all live.
We also have aggregation for hardware metrics, software, system metrics and our old Munin monitoring system (it worked with us until 2015). We collect all this through the C'ish daemon CollectD (a whole bunch of different plugins are sewn into it, it can interrogate all the resources of the host system on which it is installed, just specify in the configuration where to write the data) and write the data through it to Graphite. It also supports python plugins and shell scripts, so you can write your own custom solutions: CollectD will collect this data from a local or remote host (suppose there is Curl) and send it to Graphite.
Then we send all the metrics that we collected to Carbon-c-relay. This is Graphite's Carbon Relay solution, finalized in C. This is a router that collects all the metrics that we send from our aggregators and routes them by nodes. Also at the routing stage, it checks the validity of the metrics. They, firstly, must correspond to the scheme with prefixes that I showed earlier and, secondly, are valid for graphite. Otherwise they drop.
Carbon-c-relay then sends the metrics to the Graphite cluster. We use Carbon-cache metrics rewritten in Go as the main repository. Go-carbon, because of its multithreading, is far superior in performance to Carbon-cache. It takes data into itself and writes it to disks using the whisper package (standard, written in python). In order to read data from our storages, we use the Graphite API. It works much faster than the standard Graphite WEB. What happens to the data next?
They go to Grafana. As the main data source, we use our graphite clusters, plus we have Grafana as a web interface for displaying metrics and building dashboards. For each of their services, developers start their own dashboards. Then they build on them graphs that display the metrics that they write from their applications. In addition to Grafana, we also have SLAM. This is a pit demon that counts SLAs based on data from graphite. As I said, we have several dozen microservices, each of which has its own requirements. With the help of SLAM, we go to the documentation and compare it with what is in Graphite and compare how the requirements correspond to the availability of our services.
We go further: alert. It is organized using a strong system - Moira. It is independent because it has its own Graphite under the hood. Developed by the guys from SKB "Kontur", written in python and Go, fully open source. Moira receives all the same stream that goes into graphite. If for some reason your store dies, then your alert will work.
We deployed Moira in Kubernetes, and it uses a cluster of Redis servers as the main database. The result was a fail-safe system. It compares the metric stream with a list of triggers: if it has no references, it drops the metric. So she is able to digest gigabytes of metrics per minute.
We also screwed corporate LDAP to it, with the help of which each user of the corporate system can create notifications for himself on existing (or newly created) triggers. Since Moira contains Graphite, it supports all its functions. So you first take a line and copy it into Grafana. See how data is displayed on graphs. And then take the same line and copy it to Moira. You weight it with limits and get an alert at the exit. To do all this, you do not need any specific knowledge. Moira can alert by SMS, email, in Jira, Slack ... It also supports the execution of custom scripts. When she has a trigger, and she is subscribed to a custom script or binary, she launches it and gives JSON to stdin on this binary. Accordingly, your program should parse it. What you will do with this JSON is up to you. If you want, send it to Telegram; if you want, open tasks in Jira, do whatever.
We also use our own development for alerts - Imagotag. We adapted the panel, which is usually used for electronic price tags in stores, for our tasks. We brought triggers from Moira to it. It indicates in what condition they are when they occurred. Some of the guys from the development refused notifications in Slack and in the mail in favor of this panel.
Well, since we are a progressive company, we also monitored Kubernetes in this system. We included it in the system using the Heapster, which we installed in the cluster, it collects data and sends it to Graphite. As a result, the circuit looks like this:
Monitoring components
Here is a list of links to the components that we used for this task. All of them are open source.
Graphite:
- go-carbon: github.com/lomik/go-carbon
- whisper: github.com/graphite-project/whisper
- graphite-api: github.com/brutasse/graphite-api
Carbon-c-relay:
github.com/grobian/carbon-c-relay
Brubeck:
github.com/github/brubeck
Collectd:
collectd.org
Moira:
github.com/moira-alert
Grafana:
grafana.com
Heapster:
github.com/kubernetes/heapster
Statistics
And here are some numbers on how the system works with us.
Aggregator (brubeck)
Number of metrics: ~ 300,000 / sec.
Interval for sending metrics to Graphite: 30 sec.
Utilization of server resources: ~ 6% CPU (we are talking about full-fledged servers); ~ 1Gb RAM; ~ 3 Mbps LAN
Graphite (go-carbon)
Number of metrics: ~ 1,600,000 / min
Metric update interval: 30 sec
Metrics storage scheme: 30sec 35d, 5min 90d, 10min 365d (gives an understanding of what happens with the service for a long period of time)
Server resources use: ~ 10% CPU; ~ 20Gb RAM; ~ 30 Mbps LAN
Flexibility
At Avito, we greatly value the flexibility of our monitoring service. Why did he actually turn out like this? Firstly, its components are interchangeable: both the components themselves and their versions. Secondly, supportability. Since the whole project is built on open source, you yourself can edit the code, make changes, you can implement functions that are not available out of the box. Rather common stacks are used, mainly Go and Python, so this is done quite simply.
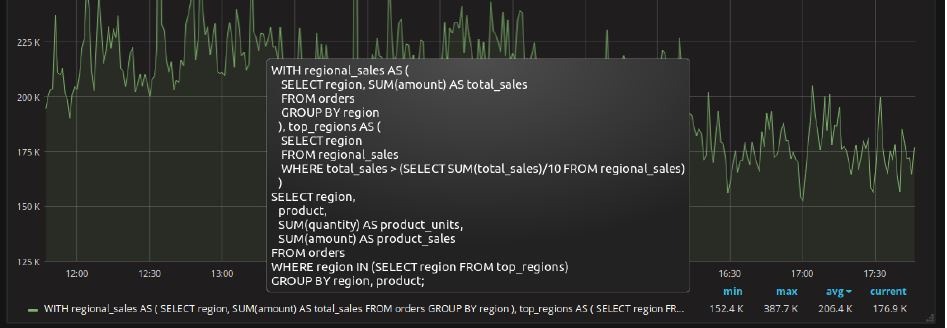
Here is an example of a real problem. Graphite metric is a file. He has a name. File Name = Metric Name. And there is a way to it. Linux file names are limited to 255 characters. And we have (as “internal customers”) guys from the database department. They tell us: “We want to monitor our SQL queries. And they are not 255 characters, but 8 MB each. We want to display them in Grafana, see the parameters for this request, and even better, we want to see the top of such requests. It will be great if it will be displayed in real time. And it would be really cool to push them into alert. ”
An example of a SQL query is taken as an example from the site postgrespro.ru
We raise the Redis server with our Collectd plugins that go to Postgres and take all the data from there, send the metrics to Graphite. But we replace the metric name with hashes. The same hash is simultaneously sent to Redis as a key, and the entire SQL query as a value. We just have to make Grafana able to go to Redis and take this information. We open the Graphite API, because this is the main interface for the interaction of all monitoring components with graphite, and we add a new function there, called aliasByHash () - from Grafana we get the metric name, and use it in the Redis query as the key, in response we get the key value, which is our “SQL query " Thus, we brought to Grafana the display of the SQL query, which, in theory, could not be displayed there, along with statistics on it (calls, rows, total_time, ...).
Summary
Availability. Our monitoring service is available 24 to 7 from any application and any code. If you have access to the repositories, you can write data to the service. Language is unimportant, decisions are not important. You only need to know how to open the socket, drop the metric there and close the socket.
Reliability. All components are fault tolerant and handle our loads well.
Low entry threshold. In order to use this system, you do not need to learn programming languages and queries in Grafana. Just open your application, enter a socket in it that will send metrics to Graphite, close it, open Grafana, create dashboards there and look at the behavior of your metrics, receiving notifications via Moira.
Independence.All this can be done by yourself, without the help of DevOps engineers. And this is an overfix, because you can monitor your project right now, you don’t need to ask anyone - neither to start work, nor to change.
What are we striving for?
All of the following is not just abstract thoughts, but something to which at least the first steps have been taken.
- Anomaly Detector. We want to gash a service that will go to our Graphite repositories and check each metric using various algorithms. Already there are algorithms that we want to view, there is data, we can work with them.
- Metadata We have many services, they change over time, as do the people who work with them. Manual documentation is not an option. Therefore, metadata is now embedded in our microservices. It says who developed it, the languages with which it interacts, SLA requirements, where and to whom to send notifications. When the service is deployed, all entity data is created independently. As a result, you get two links - one to triggers, the other to dashboards in Grafana.
- Monitoring in every home. We believe that such a system should be used by all developers. In this case, you always understand where your traffic is, what happens to it, where it falls, where it has weaknesses. If, for example, something comes and fills your service, then you will learn about this not during a call from the manager, but from an alert, and you can immediately open fresh logs and see what happened there.
- High performance. Our project is constantly growing, and today it processes about 2,000,000 metric values per minute. A year ago, this figure was 500,000. And growth continues, and this means that after some time Graphite (whisper) will begin to very heavily load the disk subsystem. As I already said, this monitoring system is quite universal due to the interchangeability of components. Someone specially under Graphite maintains and constantly expands their infrastructure, but we decided to go the other way: use ClickHouseas a repository of our metrics. This transition is almost completed, and very soon I will tell you in more detail how it was done: what difficulties were and how they were overcome, how the migration process went, I will describe the components selected as a binding and their configurations.
Thanks for attention! Ask your questions on the topic, I will try to answer here or in the following posts. Perhaps someone has experience building such a monitoring system or switching to Clickhouse in a similar situation - share it in the comments.