August 14, 2017 at 10:28
Free network security audit with Fortinet. Part 2
- Tutorial
In a previous article, we touched on the topic of network security auditing using Fortinet ( Part 1 ). We discussed the main features and reviewed an example report. Now we will look directly at the installation and configuration. We agreed that we will use FortiGate VM and FortiAnalyzer virtual solutions for auditing . Those. First you need to request these images and demo licenses. Unfortunately we can not provide a direct link to the images (licensing restrictions). The implementation scheme looks pretty simple:
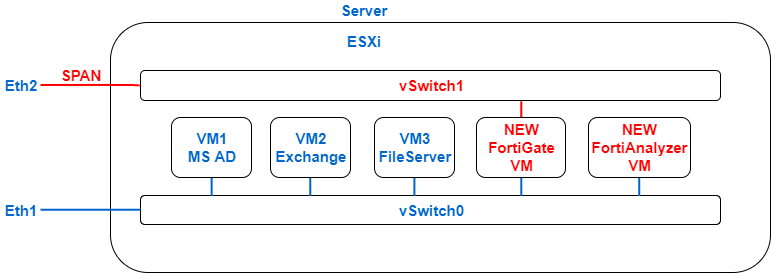
Those. on the existing virtualization server, two virtual machines "rise". In our case, we will use ESXi, but there is support for Hyper-V and KVM. FortiGate VM connects to a single network with one adapter (vSwitch0). This link will be used to control and access the Internet. The second interface connects to another vSwitch1, which in turn is connected to the server’s free physical port (eth2). It is on this port that traffic for analysis should be mirrored. Note that Promiscuous mode (Accept) must be enabled for the vSwitch1 switch. More details can be read here .
Nearby, FortiAnalyzer is also installed, which is enough to connect only one interface to your network (vSwitch0).
As you understand, the first thing you need to import images. They are delivered in the form of ovf, so no problems should arise.
Import FortiGate VM:

Now you need to select the file. There are several of them in the archive, but we need FortiGate-VM64.ovf :

Next, when configuring the interfaces, select VM Network for the first adapter (which corresponds to network management - vSwitch0), and for the second - VM Network 2 (which corresponds to SPAN port - vSwitch1 ) Other ports can be left by default:

By default, 1 GB of RAM and 1 core are set in the properties of the virtual machine. Do not try to change these parameters, otherwise the trial license will not be activated and you will not be able to connect to this device. We’ll fix it later.
The FortiAnalyzer virtual machine is imported the same way. You must select the FortiAnalyzer-VM64.ovf file :

When setting up the network, it is enough to enable the first interface in VM Network (i.e. network management):

This virtual machine already has 4GB of RAM and 2 cores by default. As a rule, these parameters are always enough.
After successfully importing the images, you can start both “machines”. First of all, we need to configure the ip-address and default route so that we can connect to devices through the web-based interface.
Administrator is used as a login, and the password is empty (just press enter):

The ip address is configured using the following commands: Setting the default gateway: You can use the following commands to check the settings: show system interface (output of port settings) show router static (output of router settings) The settings for FortiAnalyzer are similar: Gateway settings are slightly different:

After configuring the interfaces, it is very important to verify that the Internet has appeared on the devices, otherwise the licenses will not be activated. To verify, use the execute ping command

After setting up, we can connect via the web interface and activate the licenses that the partner must provide you. Let's start with FortiAnalyzer:

Username admin and a blank password. After entering, the start page opens:
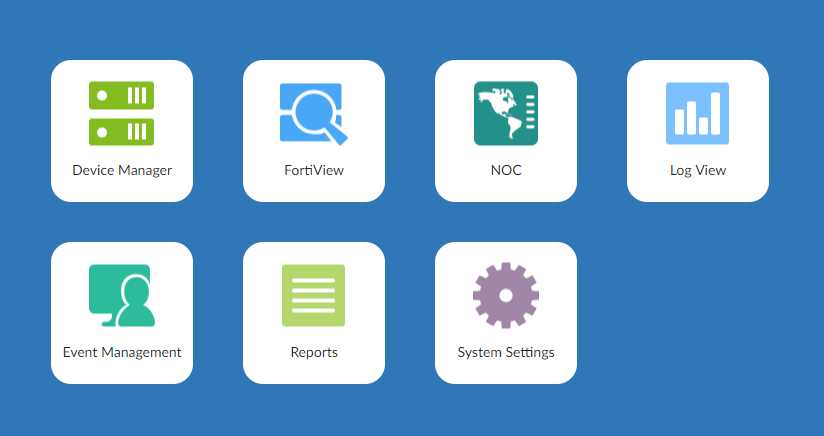
We are interested in System Settings:
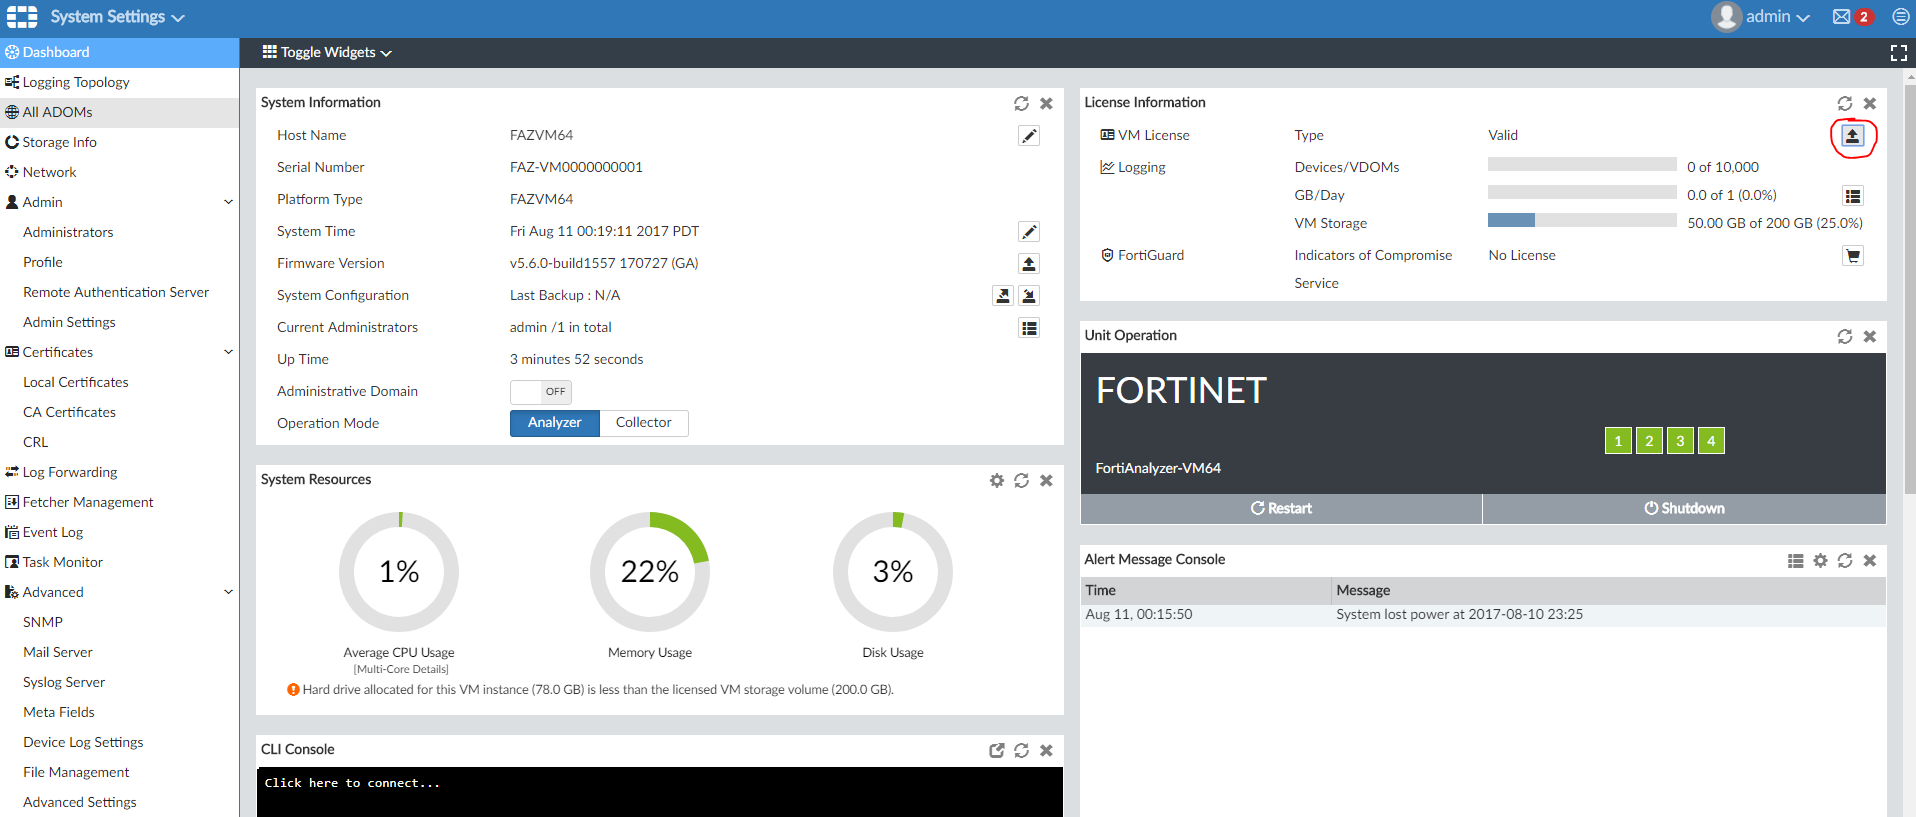
In the upper right corner we will see information about the license. The trial is currently active, but we will “throw” a new one by clicking on the Upload License. After that, the device will reboot already with a new license.
For FortiGate, a similar procedure. When connecting, please note that the http version of the portal will open, and if you try to connect via https, the browser will throw an error ERR_SSL_VERSION_OR_CIPHER_MISMATCH. This is a normal situation due to the trial regime. After activating the license, we will be able to connect via HTTPS. The login window is as follows:

Login is admin , password is empty. After logging in, we will see the FortiGate main page: You

need to activate the license by clicking on the FGVMEV License and then throw a new one:

After that, the process of activating the license will begin, which may take some time:

After activation, the gateway will reboot. Now for the virtual machine, you can set 2 cores and 4 GB of RAM (depending on the license that you generated). As a result, you should see something like the following:
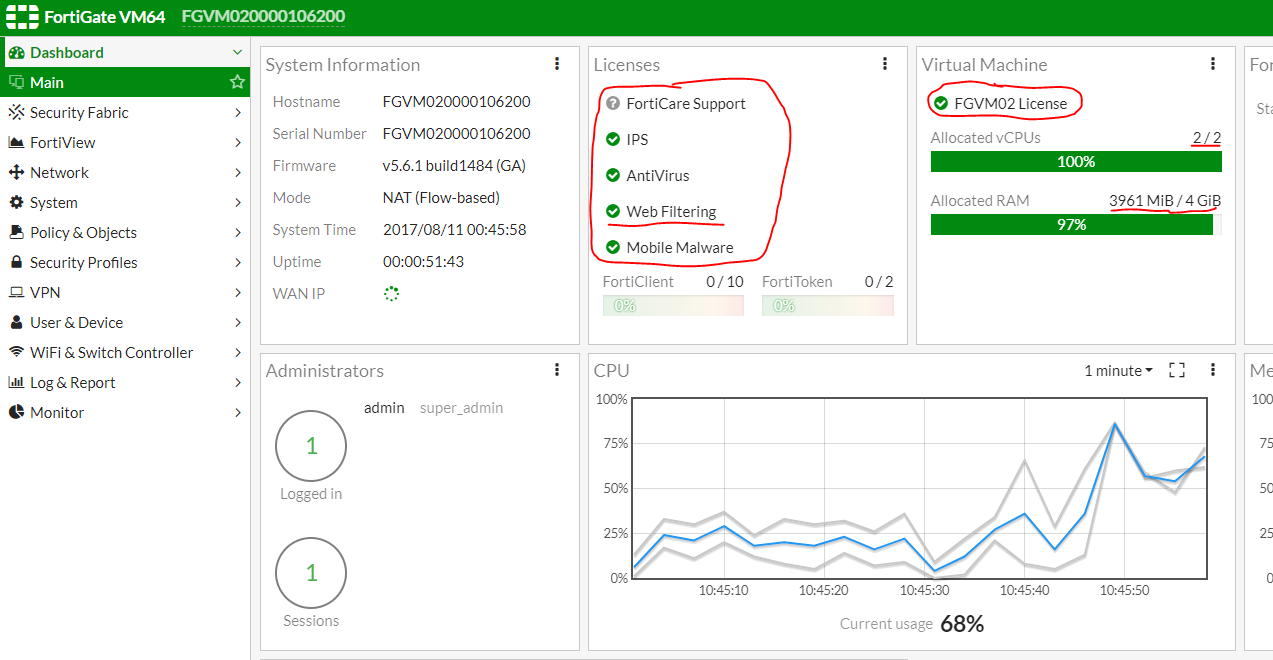
Please note that IPS, Anti-Virus, Web-filtering services may not be activated immediately, but after a while.
Now you can proceed directly to setting up One-Arm Sniffer. To do this, open the interface settings:
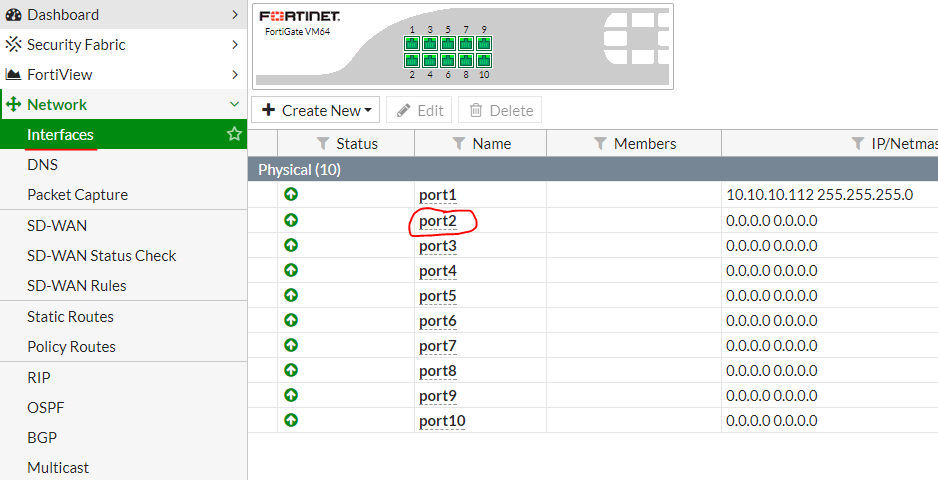
We are interested in port2 , because it is he who is connected to the SPAN port. Double-click on its properties and set the settings as in the picture below:
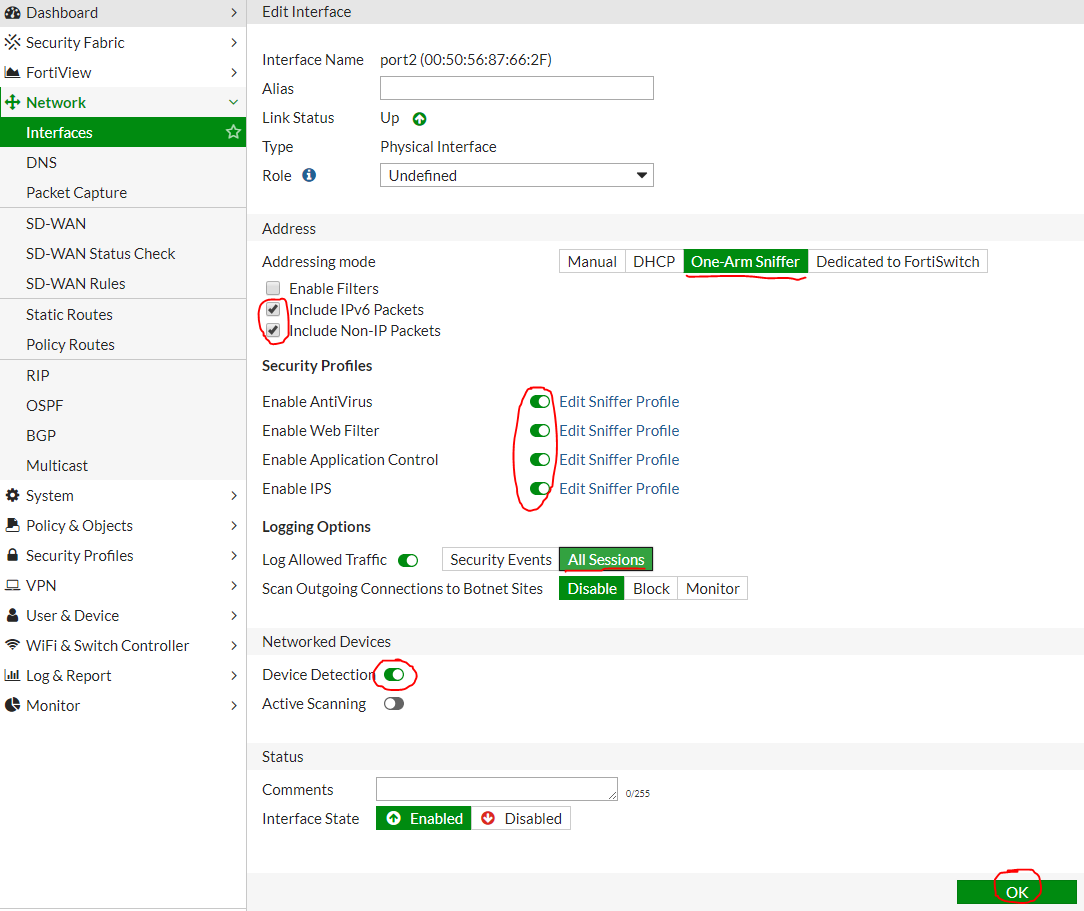
It is important not to forget to click OK to apply the settings. After that, you need to go again to the port2 settings , and in turn open the settings of the AntiVirus, Web Filter, Application Control and IPS profiles.
Let's start with AntiVirus ( Edit Sniffer Profile ). The settings should look like this:
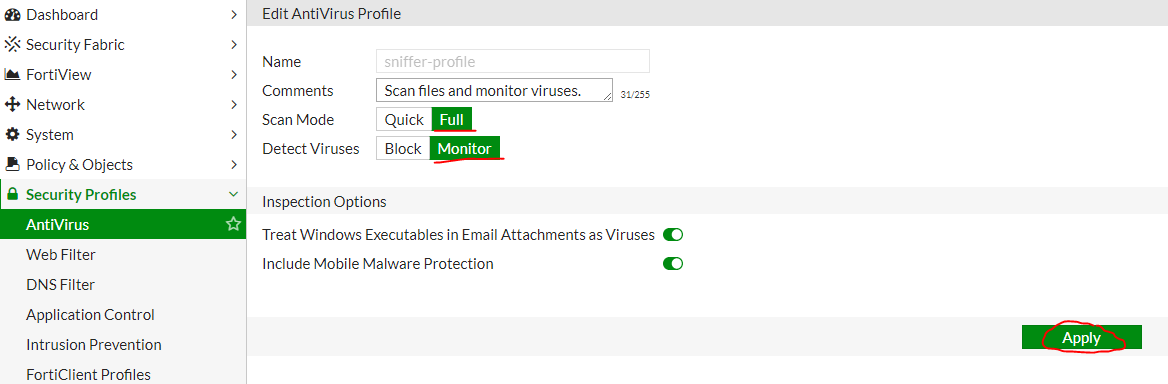
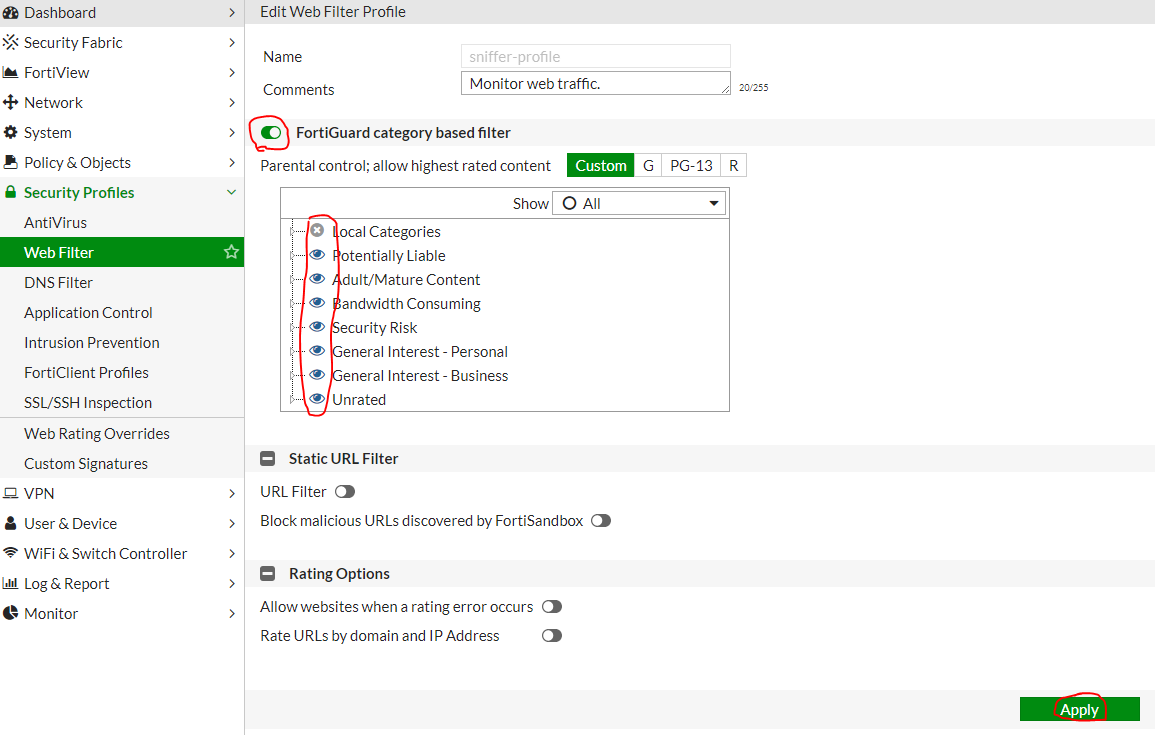
Remember to click Apply . Web Filter Settings (Edit Sniffer Profile ): Application Control
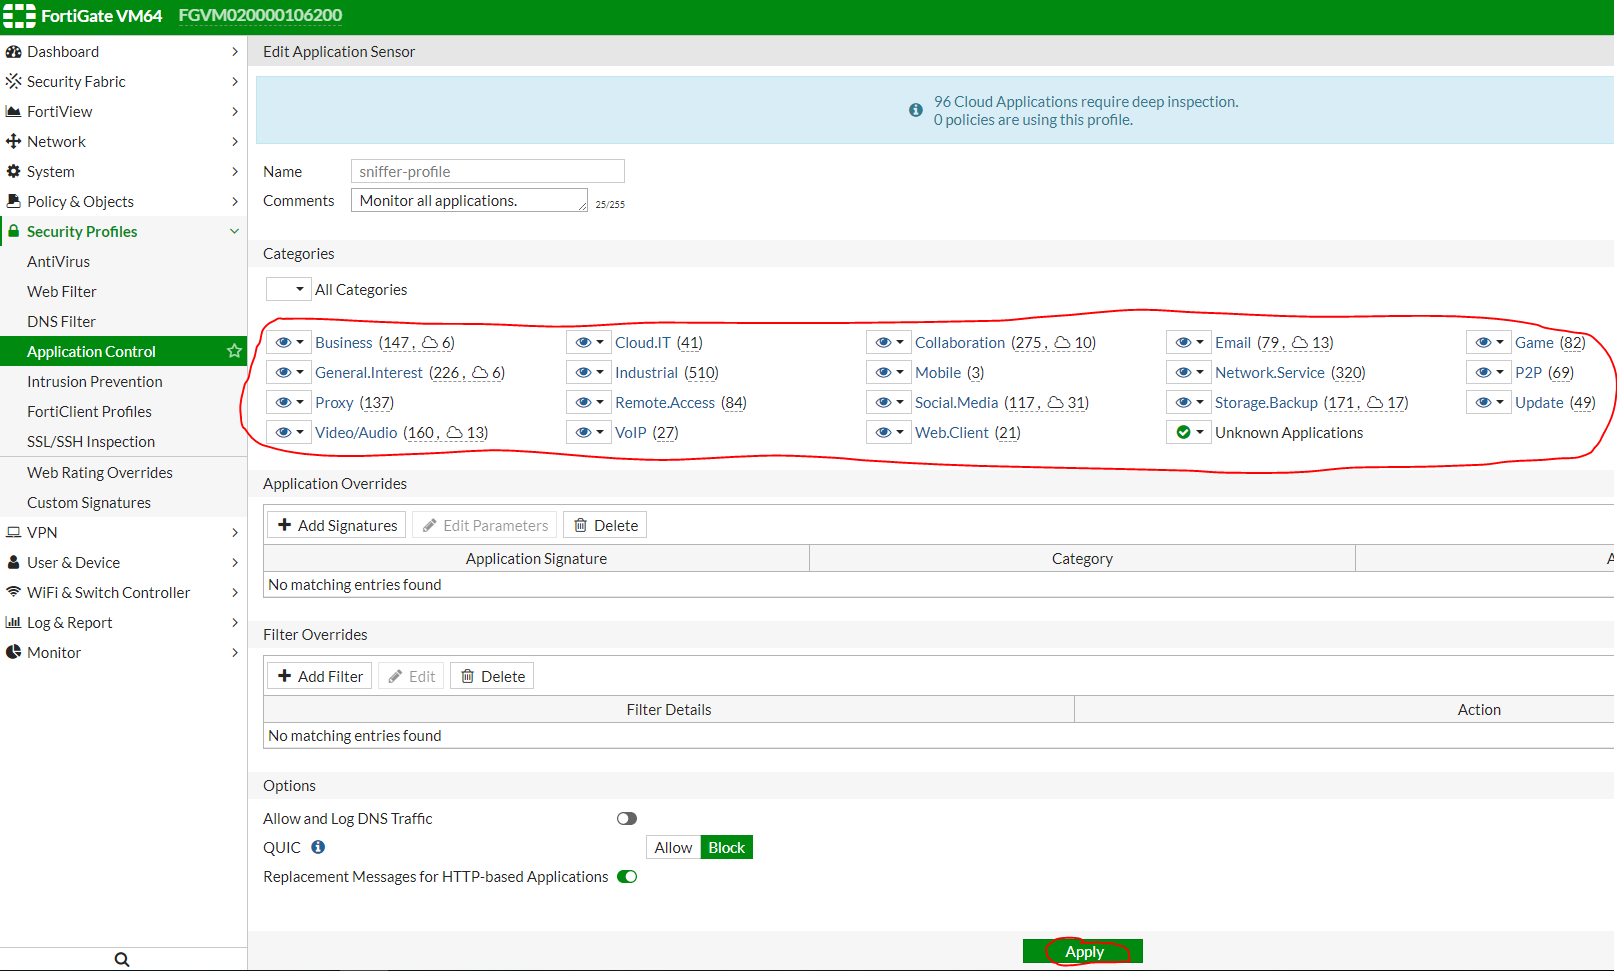
Settings ( Edit Sniffer Profile ): IPS Settings ( Edit Sniffer Profile ): As you can see, by default, signatures with a Critical and High severity level are included in the profile . It is necessary to add Medium : Also for this profile, you need to install Monitor as an action : Do not forget to save the settings by clicking Apply . This completes the setup of One-Arm Sniffer, and then you need to configure integration with FortiAnalyzer.


To integrate with FortiAnalyzer, you need to configure logging correctly. Go to Log Settings :
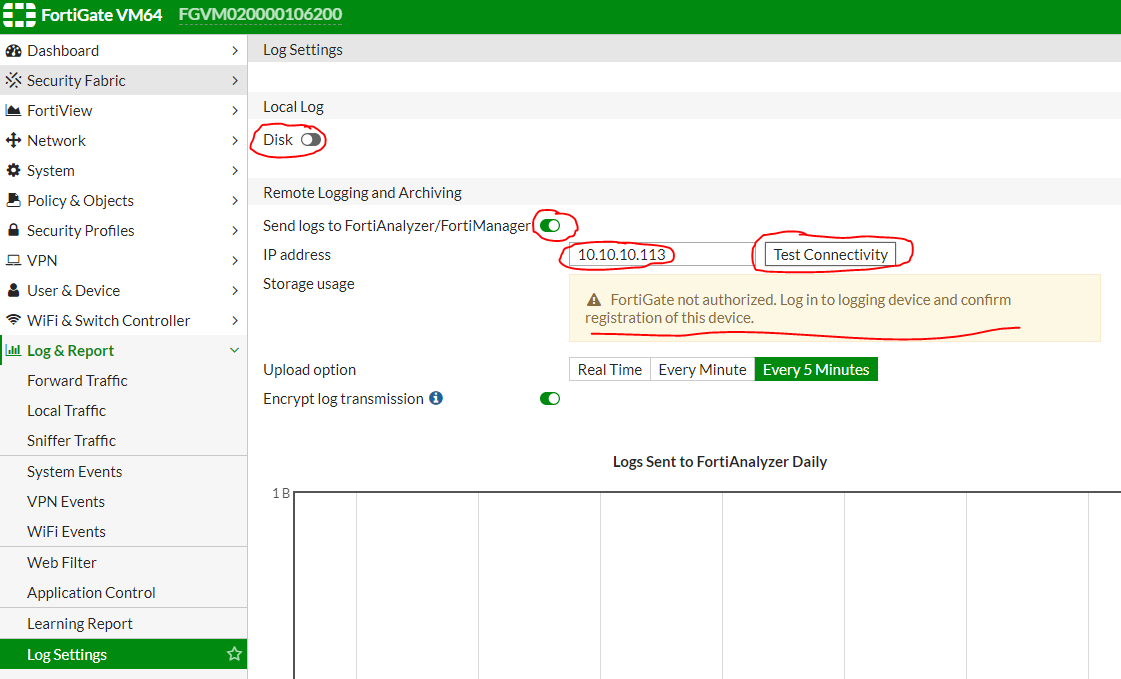
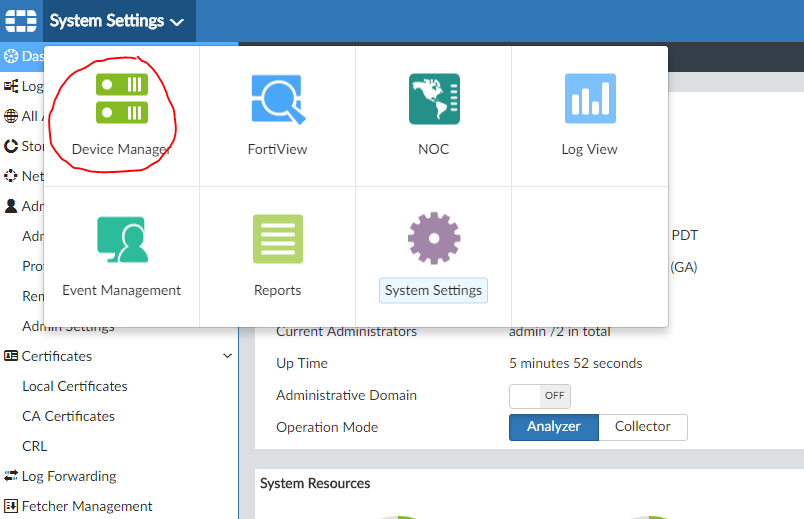
Logging to Disk can be turned off and the ip-address of our FortiAnalyzer can be specified, as in the figure above. Clicking on Test Connectivity, we see that the device must be registered on FortiAnalyzer. Click Apply and go to the FortiAnalyzer settings in the Device Manager section :
Go to the Unregistered section :
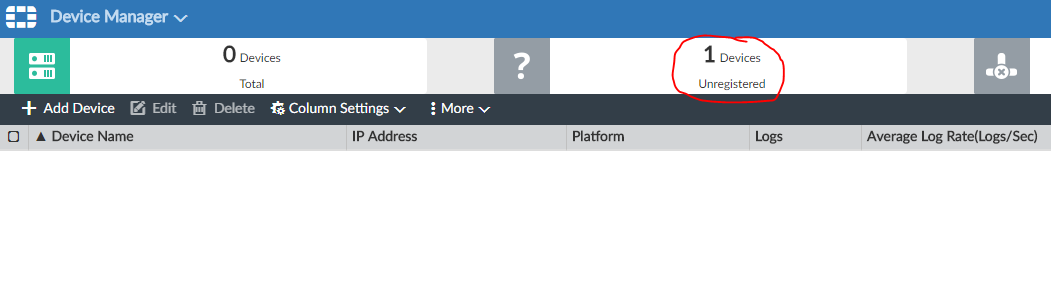
Here we will see our FortiGate. Select it and click Add :

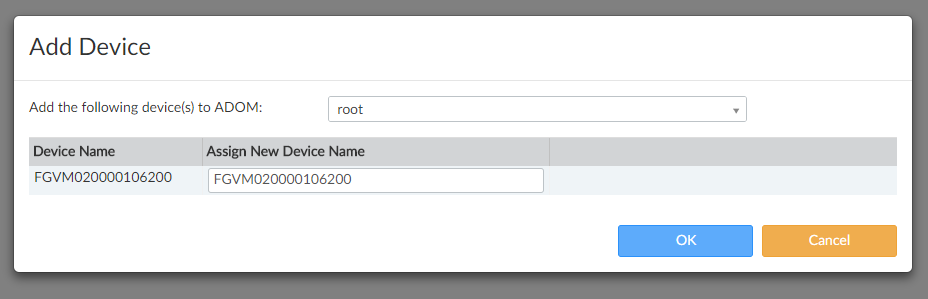
Click OK :
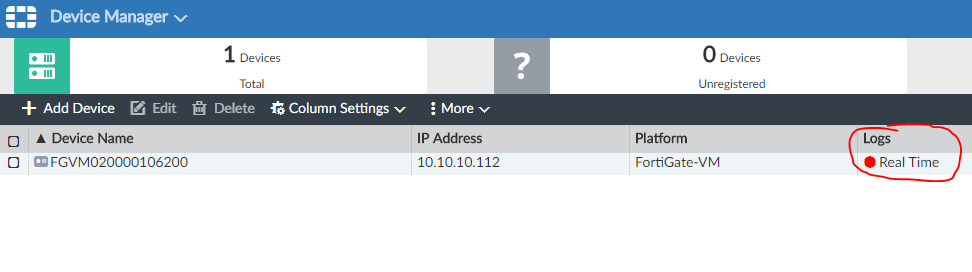
From now on FortiGate is registered:
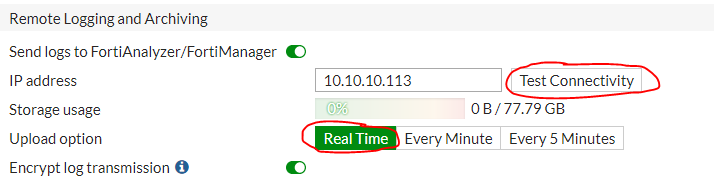
Go back to FortiGate settings inLog Settings . Once again, check Test Connectivity and set the Upload option in Real Time :
for Event Logging, set All , and in the Display Logs field set FortiAnalyzer :
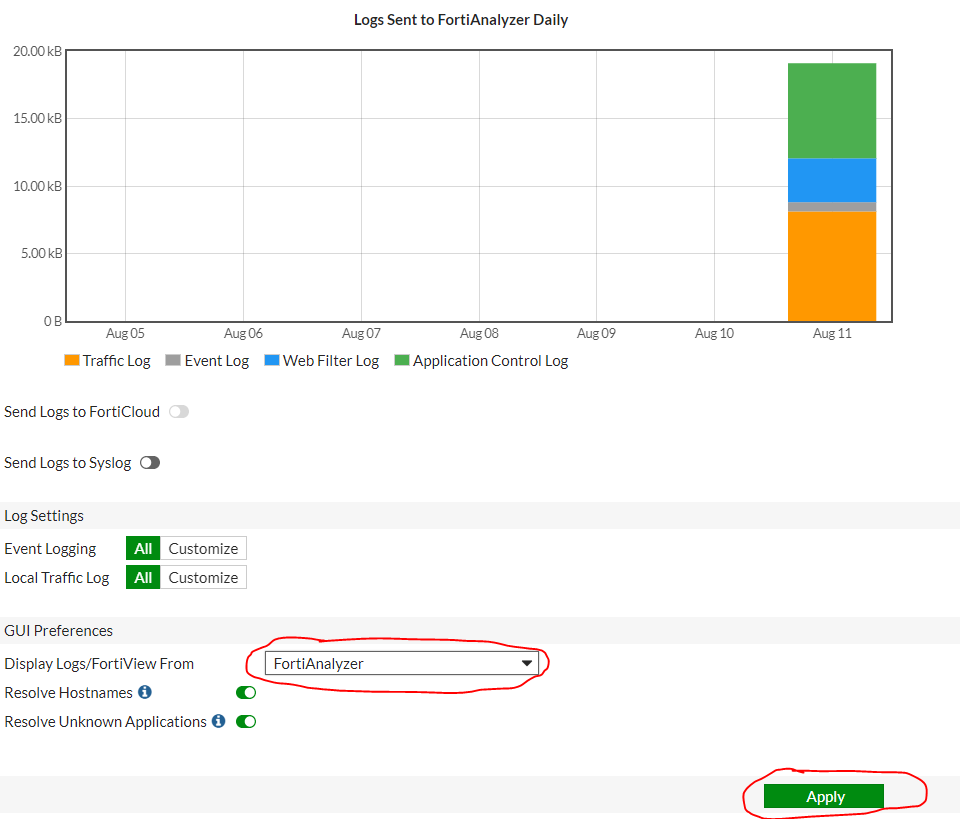
Do not forget to apply the ( Apply ) setting . But this is the complete setup of FortiGate and FortiAnalyzer.
Before generating a report, you need to make sure that the logs really come to FortiAnalyzer. To do this, go to the Log View section :
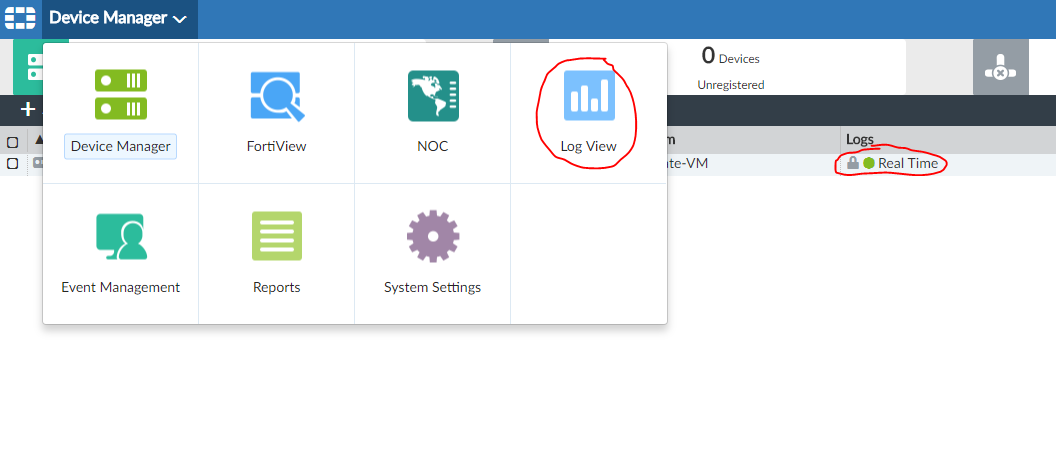
You should see the FortiGate logs:
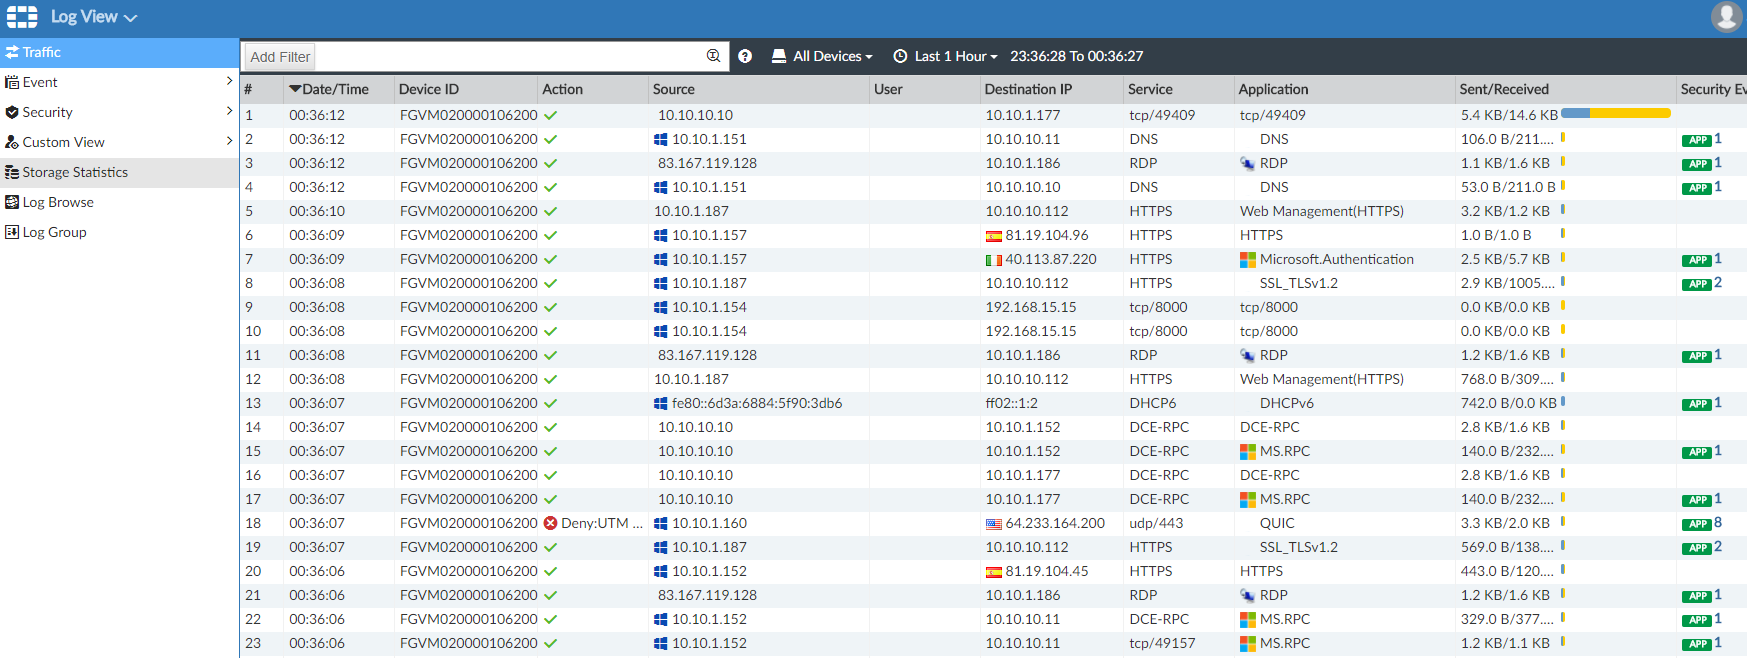
Logs come. Now, it takes a long time to collect statistics ( preferably 2-4 weeks ). However, you can generate reports at any time. To do this, go to the Reports section:
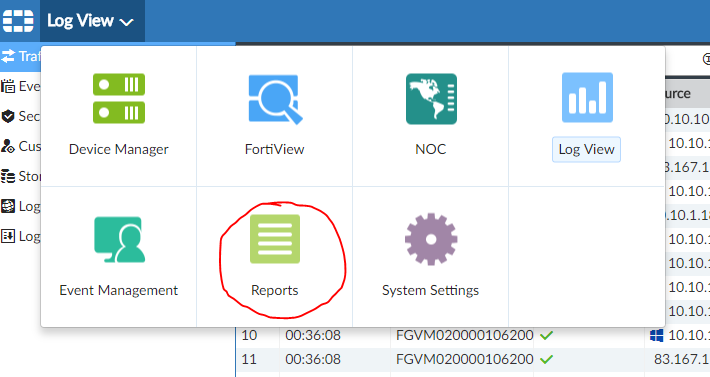
A large number of types of reports are available here, but it is Cyber Threat Assessment that interests us . Select it and click Run Report : The

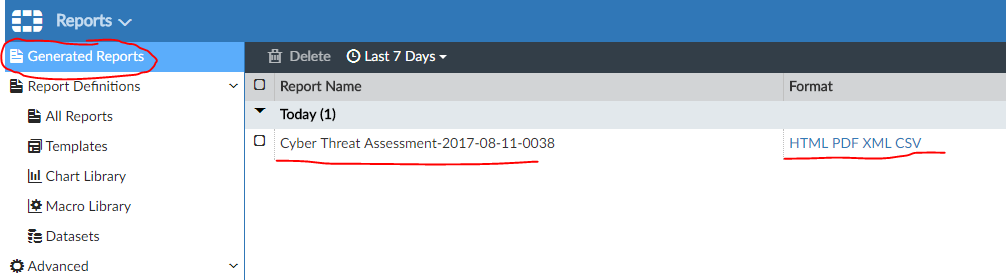
finished report can be found in the Generated Reports section :
Before generating a report, it is recommended to wait at least one hour so that at least some statistics can be collected. An example report can be found here .
Although the procedure is simple (takes a maximum of 30 minutes of time), quite a few pictures have turned out. Perhaps somewhere our actions are not quite obvious. That is why in the near future we will publish small video tutorials where, step by step , we will go through the entire setup procedure.
As we already wrote in the first part , this audit is a good opportunity to analyze the current state of your network. The reports are very detailed and informative. And given the simplicity of the whole process, everyone can do it.
More information on Fortinet can be found here .
If you are interested in such a "pilot" project, you can feel free to contact usfor licenses and images, or just for help on Fortinet products. Thanks.
PS I would like to thank Yuri Zakharov (Fortinet systems engineer) for help in preparing this article.
Those. on the existing virtualization server, two virtual machines "rise". In our case, we will use ESXi, but there is support for Hyper-V and KVM. FortiGate VM connects to a single network with one adapter (vSwitch0). This link will be used to control and access the Internet. The second interface connects to another vSwitch1, which in turn is connected to the server’s free physical port (eth2). It is on this port that traffic for analysis should be mirrored. Note that Promiscuous mode (Accept) must be enabled for the vSwitch1 switch. More details can be read here .
Nearby, FortiAnalyzer is also installed, which is enough to connect only one interface to your network (vSwitch0).
Import Images
As you understand, the first thing you need to import images. They are delivered in the form of ovf, so no problems should arise.
Import FortiGate VM:
Now you need to select the file. There are several of them in the archive, but we need FortiGate-VM64.ovf :
Next, when configuring the interfaces, select VM Network for the first adapter (which corresponds to network management - vSwitch0), and for the second - VM Network 2 (which corresponds to SPAN port - vSwitch1 ) Other ports can be left by default:
By default, 1 GB of RAM and 1 core are set in the properties of the virtual machine. Do not try to change these parameters, otherwise the trial license will not be activated and you will not be able to connect to this device. We’ll fix it later.
The FortiAnalyzer virtual machine is imported the same way. You must select the FortiAnalyzer-VM64.ovf file :
When setting up the network, it is enough to enable the first interface in VM Network (i.e. network management):
This virtual machine already has 4GB of RAM and 2 cores by default. As a rule, these parameters are always enough.
Launch and initial setup
After successfully importing the images, you can start both “machines”. First of all, we need to configure the ip-address and default route so that we can connect to devices through the web-based interface.
Administrator is used as a login, and the password is empty (just press enter):
The ip address is configured using the following commands: Setting the default gateway: You can use the following commands to check the settings: show system interface (output of port settings) show router static (output of router settings) The settings for FortiAnalyzer are similar: Gateway settings are slightly different:
config system interface
edit port1 //имя сетевого интерфейса
set ip 10.10.10.112/24 //IP адрес и маска сети
end
config router static
edit 1 //номер маршрута в списке
set gateway 10.10.10.254
set device port1
endconfig system interface
edit port1 //имя сетевого интерфейса
set ip 10.10.10.113/24 //IP адрес и маска сети
endconfig system route
edit 1 //номер маршрута в списке
set gateway 10.10.10.254
set device port1
endAfter configuring the interfaces, it is very important to verify that the Internet has appeared on the devices, otherwise the licenses will not be activated. To verify, use the execute ping command
License activation and activation
After setting up, we can connect via the web interface and activate the licenses that the partner must provide you. Let's start with FortiAnalyzer:
Username admin and a blank password. After entering, the start page opens:
We are interested in System Settings:
In the upper right corner we will see information about the license. The trial is currently active, but we will “throw” a new one by clicking on the Upload License. After that, the device will reboot already with a new license.
For FortiGate, a similar procedure. When connecting, please note that the http version of the portal will open, and if you try to connect via https, the browser will throw an error ERR_SSL_VERSION_OR_CIPHER_MISMATCH. This is a normal situation due to the trial regime. After activating the license, we will be able to connect via HTTPS. The login window is as follows:
Login is admin , password is empty. After logging in, we will see the FortiGate main page: You
need to activate the license by clicking on the FGVMEV License and then throw a new one:
After that, the process of activating the license will begin, which may take some time:
After activation, the gateway will reboot. Now for the virtual machine, you can set 2 cores and 4 GB of RAM (depending on the license that you generated). As a result, you should see something like the following:
Please note that IPS, Anti-Virus, Web-filtering services may not be activated immediately, but after a while.
Setting Up One-Arm Sniffer
Now you can proceed directly to setting up One-Arm Sniffer. To do this, open the interface settings:
We are interested in port2 , because it is he who is connected to the SPAN port. Double-click on its properties and set the settings as in the picture below:
It is important not to forget to click OK to apply the settings. After that, you need to go again to the port2 settings , and in turn open the settings of the AntiVirus, Web Filter, Application Control and IPS profiles.
Let's start with AntiVirus ( Edit Sniffer Profile ). The settings should look like this:
Remember to click Apply . Web Filter Settings (Edit Sniffer Profile ): Application Control
Settings ( Edit Sniffer Profile ): IPS Settings ( Edit Sniffer Profile ): As you can see, by default, signatures with a Critical and High severity level are included in the profile . It is necessary to add Medium : Also for this profile, you need to install Monitor as an action : Do not forget to save the settings by clicking Apply . This completes the setup of One-Arm Sniffer, and then you need to configure integration with FortiAnalyzer.
Integration with FortiAnalyzer
To integrate with FortiAnalyzer, you need to configure logging correctly. Go to Log Settings :
Logging to Disk can be turned off and the ip-address of our FortiAnalyzer can be specified, as in the figure above. Clicking on Test Connectivity, we see that the device must be registered on FortiAnalyzer. Click Apply and go to the FortiAnalyzer settings in the Device Manager section :
Go to the Unregistered section :
Here we will see our FortiGate. Select it and click Add :
Click OK :
From now on FortiGate is registered:
Go back to FortiGate settings inLog Settings . Once again, check Test Connectivity and set the Upload option in Real Time :
for Event Logging, set All , and in the Display Logs field set FortiAnalyzer :
Do not forget to apply the ( Apply ) setting . But this is the complete setup of FortiGate and FortiAnalyzer.
Report Generation
Before generating a report, you need to make sure that the logs really come to FortiAnalyzer. To do this, go to the Log View section :
You should see the FortiGate logs:
Logs come. Now, it takes a long time to collect statistics ( preferably 2-4 weeks ). However, you can generate reports at any time. To do this, go to the Reports section:
A large number of types of reports are available here, but it is Cyber Threat Assessment that interests us . Select it and click Run Report : The
finished report can be found in the Generated Reports section :
Before generating a report, it is recommended to wait at least one hour so that at least some statistics can be collected. An example report can be found here .
Conclusion
Although the procedure is simple (takes a maximum of 30 minutes of time), quite a few pictures have turned out. Perhaps somewhere our actions are not quite obvious. That is why in the near future we will publish small video tutorials where, step by step , we will go through the entire setup procedure.
As we already wrote in the first part , this audit is a good opportunity to analyze the current state of your network. The reports are very detailed and informative. And given the simplicity of the whole process, everyone can do it.
More information on Fortinet can be found here .
If you are interested in such a "pilot" project, you can feel free to contact usfor licenses and images, or just for help on Fortinet products. Thanks.
PS I would like to thank Yuri Zakharov (Fortinet systems engineer) for help in preparing this article.