January 17, 2017 at 14:46
Weather station from Arduino and Orienteer
On New Year's Eve, a desire comes to me to develop something non-standard. This time I decided to start collecting and processing weather data near my home. And, of course, I chose Arduino as the hardware, but Orienteer, the business application designer mentioned recently at Habrahabr, as the storage and viewing and analysis tool . What happened, I will share in this article.
Why exactly this bunch, because you can do it without Arduino on a bare Atmel microcontroller and use the PHP / MySQL bunch as storage? It's simple: I didn’t want to bother with LUT , because there was no laser printer at hand, and PHP was tired of it. And most importantly - I wanted to try this very Orienteer in combat conditions, and not poke buttons indemo application .
The principle of operation is simple: we interrogate sensors, form and send a REST request to Orienteer.
Due to the small amount of iron under Arduino, the following iron bundle was selected in my arsenal:
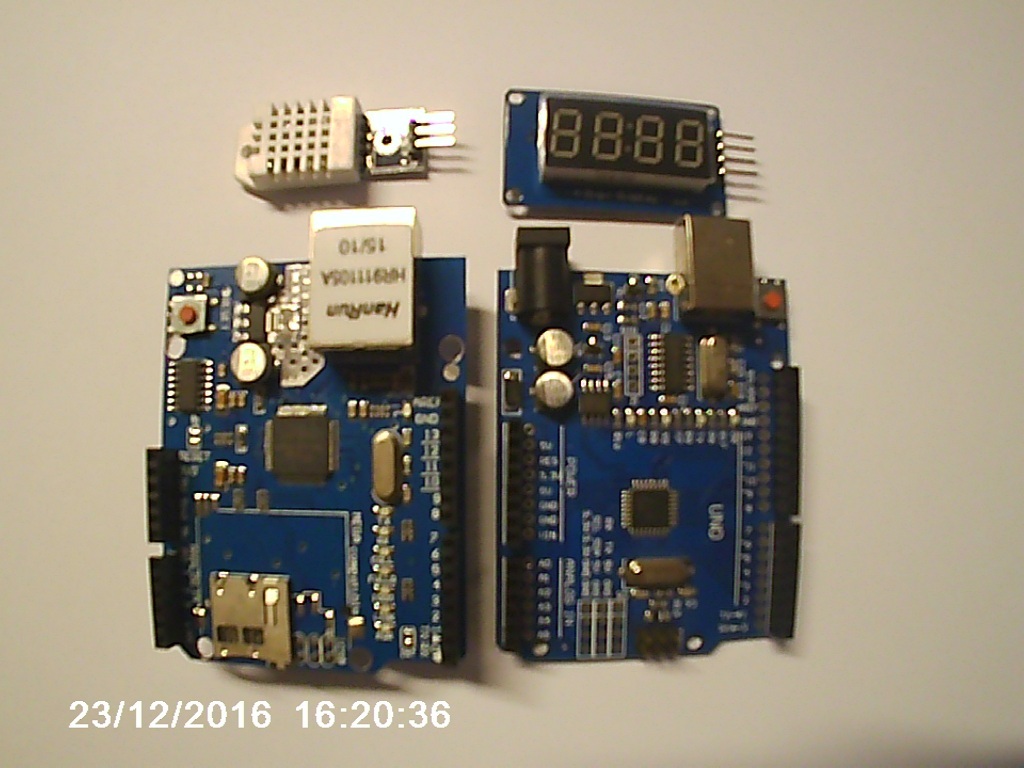
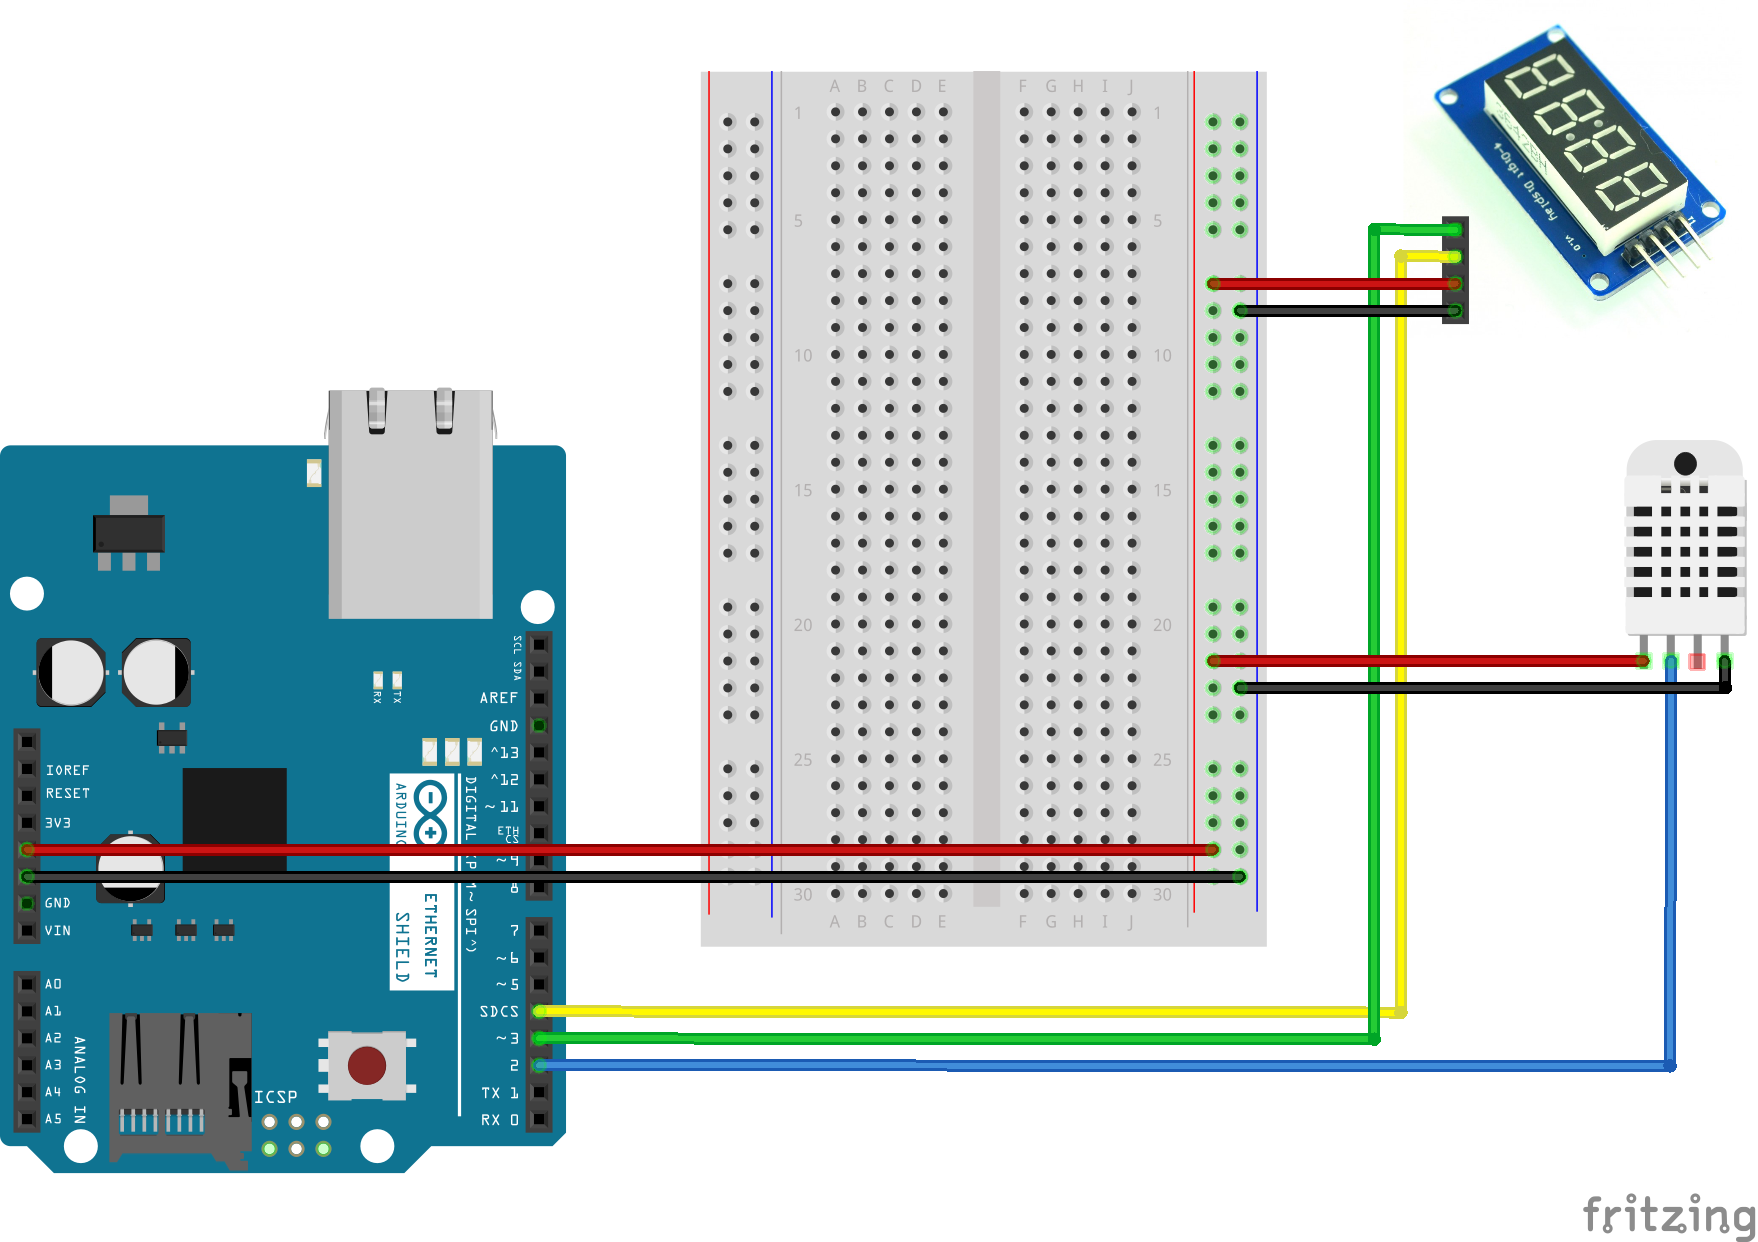
As you can see, the connection diagram is very simple, no strapping for the sensor is required. We take Arduino, connect the Ethernet shield, connect the sensor. I used the DHT22 sensor, it measures the temperature and the percentage of humidity, you can use any that you have on hand.
Let's move on to the sketch code for Arduino. At the very beginning, everything is standard: the necessary libraries are connected. In my case, I needed: Adafruit Unified Sensor Driver and Adafruit DHT Humidity & Temperature Unified Sensor Library , as well as libraries for working with Ethernet.
Further, constants for quick editing are declared, the names speak for themselves, but for beginners in Arduino I will explain:
Then everything is also standard - initialization of the sensor, Ehternet shield. To send REST data to Orienteer, you need to prepare JSON with information - class and data. I made the code for sending the request in a separate function. It is worth paying attention to sending a POST request and basic authorization if you are recently learning Arduino.
JSON generation for sending data is generated using the sprintf () function :
The interval for sending is implemented using the millis () function . In case of an error, we swear at the serial interface.
So we approached the server side. Run and configure the Orienteer platform to receive data and display graphs.
You can launch the platform from the source , or you can also use the Docker container (for more details, see the official documentation ). Thanks to the authors for packing this whole thing in a container, a very convenient way to deliver the application. For deployment, suppose you have Docker installed and have minimal skills to work with it, such as starting and stopping the container. If this is not so, then to you here and here .
To get started, download a fresh image of the container with the application, I worked on the Ubuntu OS:
You will see the following:
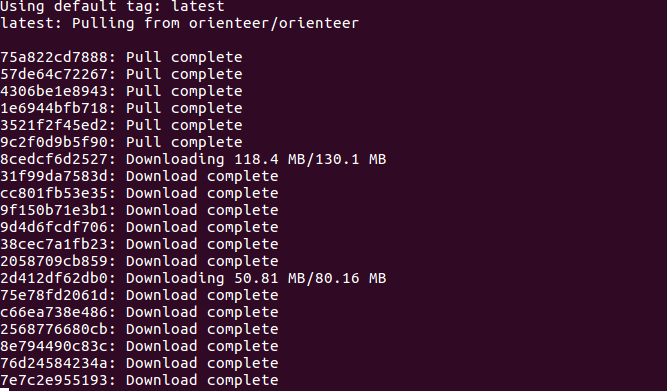
After waiting a bit, the image is downloaded and it can be launched:
We go to the localhost: 8080 address in the browser, enter with a pair of username and password: admin / admin . Choose Schema → Classes → + Create from the menu to create a data model class and specify the class name - Weather . Do not forget to save the new class:

Now create the class properties. We need to save: temperature, percentage of humidity, device name and device access time. On the class properties page ( localhost: 8080 / class / Weather ), add the properties:

For the dateTime property, we will specify the sysdate () function as the default value to get the current time at the time the data arrives from the device. An error of even a few seconds is not critical in our case.
Done, check - come our data? Everything is fine, there is contact!

But, as we can see, the data is not presented to us in a very convenient form. It doesn’t matter, Orienteer has wonderful Pivot Table, HTML / JS widgets, and you can even create your own page for display, but let's focus on widgets. We need to display the latest data: temperature, percentage of humidity, time of the last update; daily average.
To add a widget, go to Schema → Weather → Browse Class and click on the gear icon in the upper right corner. Click Add widget and add the Html Js Pane widget . Save the state of the widget by clicking Save . Next, we’ll go to the widget’s settings by Actions → Settings, click the Edit button .
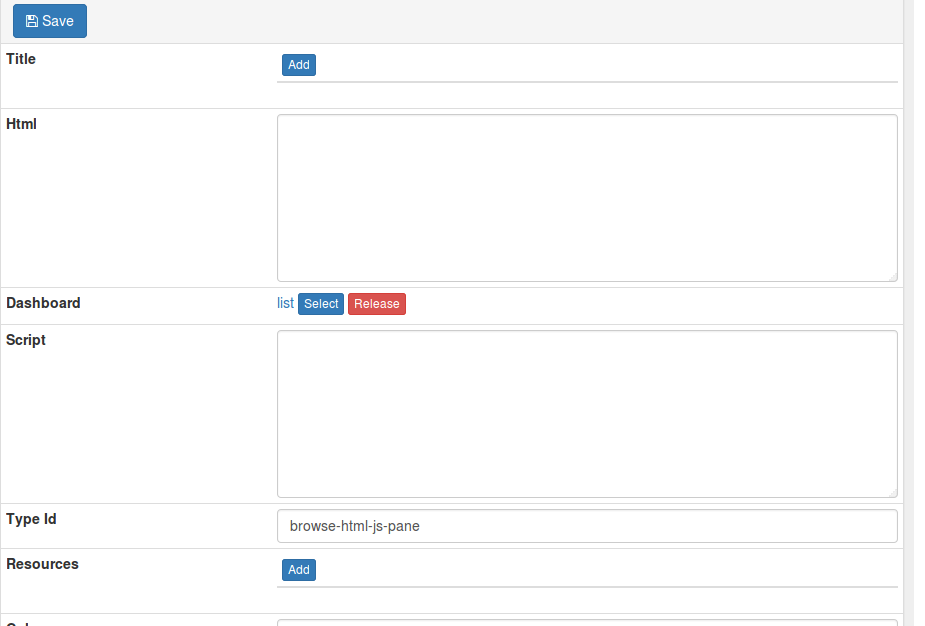
Add a resource for displaying - Weather (this means that this widget will be shown only if we are on the page for viewing objects of this class), we indicate the HTML and JS codes of the widget.
And save - click Save .
In the same way we add Pivot Table widgets to display graphs. In one, to display the average temperature per day in the settings, we specify the SQL query for the average temperature:
In the widget editing mode, we will configure the graph:
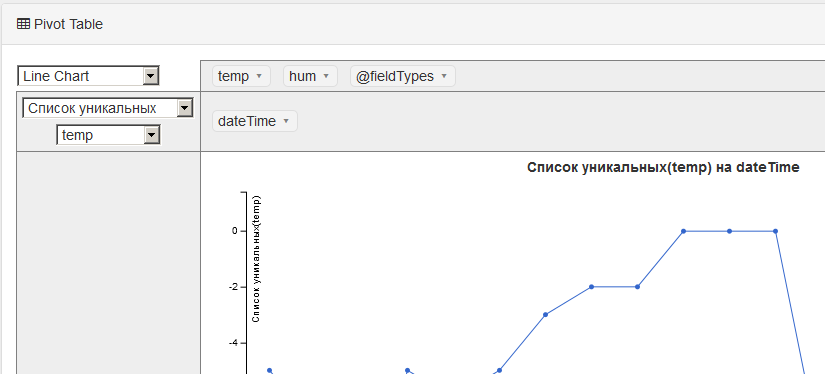
And in the second widget, to display the average percentage of humidity per day, the following SQL:
But in the graph configuration, we indicate the hum value from the result of the SQL query:
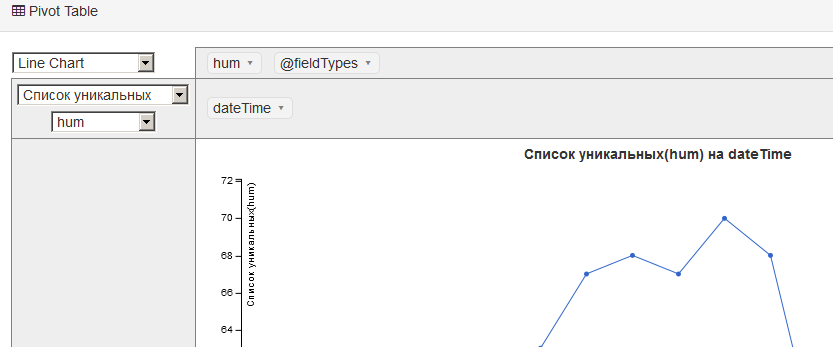
And in the end we got an excellent system for collecting and displaying weather data.
In the plans:
All updates will be on GitHub . Meanwhile, I climbed onto Aliexpress to order hardware to improve my system. I would also like to try Orienteer as a backend application for AngularJS or Android application, but this is the topic of a separate article.
Why exactly this bunch, because you can do it without Arduino on a bare Atmel microcontroller and use the PHP / MySQL bunch as storage? It's simple: I didn’t want to bother with LUT , because there was no laser printer at hand, and PHP was tired of it. And most importantly - I wanted to try this very Orienteer in combat conditions, and not poke buttons indemo application .
The principle of operation is simple: we interrogate sensors, form and send a REST request to Orienteer.
Due to the small amount of iron under Arduino, the following iron bundle was selected in my arsenal:
- Arduino UNO R3 (more precisely, its Chinese clone with CH340)
- Temperature and humidity sensor DHT22
- Ethernet shield
- Connecting wires
Hardware
As you can see, the connection diagram is very simple, no strapping for the sensor is required. We take Arduino, connect the Ethernet shield, connect the sensor. I used the DHT22 sensor, it measures the temperature and the percentage of humidity, you can use any that you have on hand.
Let's move on to the sketch code for Arduino. At the very beginning, everything is standard: the necessary libraries are connected. In my case, I needed: Adafruit Unified Sensor Driver and Adafruit DHT Humidity & Temperature Unified Sensor Library , as well as libraries for working with Ethernet.
Code with connecting the necessary libraries
#include
#include
#include
#include
#include
Further, constants for quick editing are declared, the names speak for themselves, but for beginners in Arduino I will explain:
- DHTPIN - Arduino connector to which the sensor is connected
- DHTTYPE - type of sensor used by the Adafruit library
- DELAY_MILLIS - interval for sending data, the default value is 30000UL , which means 30 seconds
- REST - part of the URL address for the REST protocol
- SERVER_NAME - IP address or host of the server where Orienteer is running
- SERVER_PORT - server port
- AUTH_BASE64 - BASE64 -encoded login: password string for Basic HTTP authentication (in our case, admin: admin)
- DEVICE_ID - identifier of the data collection device, that is, our Arduino, it is supposed to collect from several points (for example: house / street)
Then everything is also standard - initialization of the sensor, Ehternet shield. To send REST data to Orienteer, you need to prepare JSON with information - class and data. I made the code for sending the request in a separate function. It is worth paying attention to sending a POST request and basic authorization if you are recently learning Arduino.
Sending HTTP headers
sprintf(outBuf,"POST %s HTTP/1.1",page);
client.println(outBuf);
sprintf(outBuf,"Authorization: Basic %s", AUTH_BASE64);
client.println(outBuf);
sprintf(outBuf,"Host: %s",domainBuffer);
client.println(outBuf);
client.println(F("Connection: close\r\nContent-Type: application/x-www-form-urlencoded"));
JSON generation for sending data is generated using the sprintf () function :
sprintf(params,"{'@class':'Weather', 'temperature':%i, 'humidity':%i, 'device':'%s'}", temperature, humidity, DEVICE_ID);The interval for sending is implemented using the millis () function . In case of an error, we swear at the serial interface.
Orienteer and its setup
So we approached the server side. Run and configure the Orienteer platform to receive data and display graphs.
You can launch the platform from the source , or you can also use the Docker container (for more details, see the official documentation ). Thanks to the authors for packing this whole thing in a container, a very convenient way to deliver the application. For deployment, suppose you have Docker installed and have minimal skills to work with it, such as starting and stopping the container. If this is not so, then to you here and here .
To get started, download a fresh image of the container with the application, I worked on the Ubuntu OS:
sudo docker pull orienteer/orienteerYou will see the following:
After waiting a bit, the image is downloaded and it can be launched:
sudo docker run -p 8080:8080 orienteer/orienteerWe go to the localhost: 8080 address in the browser, enter with a pair of username and password: admin / admin . Choose Schema → Classes → + Create from the menu to create a data model class and specify the class name - Weather . Do not forget to save the new class:
Now create the class properties. We need to save: temperature, percentage of humidity, device name and device access time. On the class properties page ( localhost: 8080 / class / Weather ), add the properties:
For the dateTime property, we will specify the sysdate () function as the default value to get the current time at the time the data arrives from the device. An error of even a few seconds is not critical in our case.
Done, check - come our data? Everything is fine, there is contact!
But, as we can see, the data is not presented to us in a very convenient form. It doesn’t matter, Orienteer has wonderful Pivot Table, HTML / JS widgets, and you can even create your own page for display, but let's focus on widgets. We need to display the latest data: temperature, percentage of humidity, time of the last update; daily average.
To add a widget, go to Schema → Weather → Browse Class and click on the gear icon in the upper right corner. Click Add widget and add the Html Js Pane widget . Save the state of the widget by clicking Save . Next, we’ll go to the widget’s settings by Actions → Settings, click the Edit button .
Add a resource for displaying - Weather (this means that this widget will be shown only if we are on the page for viewing objects of this class), we indicate the HTML and JS codes of the widget.
HTML
Update...
Update...
Javascript
function getWeather(){
var url = "/orientdb/query/db/sql/SELECT temperature, humidity, dateTime.format('dd.MM.yyyy HH:mm') AS dt FROM Weather ORDER BY dateTime.asLong() DESC LIMIT 1/1?rnd="+Math.random();
$.getJSON( url, {})
.done(function( data ) {
$('#last-temp').html(data.result[0].temperature + '°');
$('#last-hum').html(data.result[0].humidity+ '%');
$('#last-datetime').html(data.result[0].dt);
});
}
(function() {
getWeather();
})();
And save - click Save .
In the same way we add Pivot Table widgets to display graphs. In one, to display the average temperature per day in the settings, we specify the SQL query for the average temperature:
SELECT dateTime, AVG(temperature) AS temp FROM Weather LET $day = dateTime.format('yyyy-MM-dd') GROUP BY $dayIn the widget editing mode, we will configure the graph:
And in the second widget, to display the average percentage of humidity per day, the following SQL:
SELECT dateTime, AVG(humidity) AS hum FROM Weather LET $day = dateTime.format('yyyy-MM-dd') GROUP BY $dayBut in the graph configuration, we indicate the hum value from the result of the SQL query:
And in the end we got an excellent system for collecting and displaying weather data.
Long screenshot
In the plans:
- Add additional sensors: pressure, CO2 , light level
- Add real-time clock (correct implementation, when we have the read time, and not the time of data acquisition)
- Pre-caching to an SD memory card for uploading a data slice
- Displaying weather data and sensor error messages or communication problems
widget settings
All updates will be on GitHub . Meanwhile, I climbed onto Aliexpress to order hardware to improve my system. I would also like to try Orienteer as a backend application for AngularJS or Android application, but this is the topic of a separate article.