November 30, 2015 at 10:12
An example of express analysis of storage performance using the free Mitrend service

The study of performance problems and the search for solutions are familiar to many firsthand. There are many visualization and parsing tools for I / O statistics. Currently, automation of mining based on Internet services is gaining momentum.
In this post I want to share an example of analyzing the problem with storage performance based on one of these services (Mitrend) and propose ways to solve it. In my opinion, this example is an interesting study, which, I think, may be useful to a wide range of IT readers.
So, the customer asked EMC to see the performance of the VNX5500 hybrid storage system deployed in his SAN. VMware servers are connected to the storage system, on which "everything" is spinning: from infrastructure tasks to file balls and database servers. The reason for this rapid assessment was complaints about the freezing of applications deployed on servers connected to VNX.
For pre-processing, I used the freely available Mitrend service .
A detailed description of this service is not the purpose of this post, so I invite everyone to learn more about it - go to its website and see for yourself.
Mitrend receives input files with I / O statistics from the system under study and prepares graphs for the most frequently requested parameters, as well as makes preliminary analytics, the results of which will be used later.

One example of such analytics is a heat map showing how busy the various components of the system are at different points in time. In fact, this is a schematic representation of the system and its components, within each of which a graph of its loading is built. A general look at it allows you to see potentially problematic places. In this case, it can be seen that the write cache is the problem. Here is this graph: The

disposal of the write cache is at a high level, from where regular “backache” to the red zone (above 90%) comes from.
This is a typical symptom of performance problems. A kind of "high temperature." In this case, we have to study what exactly leads to such a situation and outline solutions.
Disks, processors, input-output ports, disk bus are not loaded. And this is a bit strange, amid the fact that the record cache is “clogged”.



Let's now take a look at the disks in more detail. For clarity, I circled various types of discs with colorful lines and signed the legend below. In the analysis file itself, this is visible without a legend.
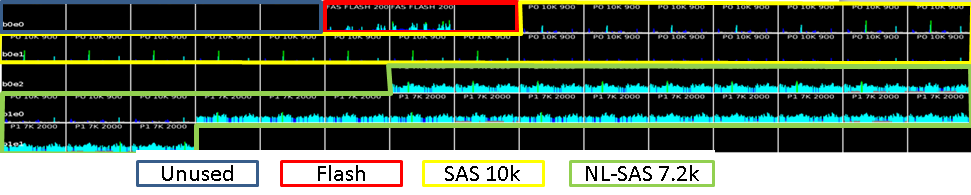
Let's take a closer look at what the disk system in general is: three 200GB flash drives, two of which are configured in FAST Cache with a usable capacity of 183GB, and the third is in hot standby. Those. very reliable mirrored cache on flash drives with hot standby. The effectiveness of its work can be seen in the graph below:

The system has 5 900 GB disks that are not used at all. Since these are system disks, and out of habit, they try not to touch them, because there is an opinion that this causes performance problems. My opinion on this subject is that they can be used if you do it meaningfully. Performance problems are usually for completely different reasons.
Usually, different types of disks are combined into hybrid pools, so that the system itself determines where it is better to place data (using FAST VP). But in this case, the specialists performing the implementation did not entrust her with this important matter and rigidly divided the data by type of drive. Therefore, the disks are divided into 2 separate groups - Pool 0 and Pool 1. They did this in order to isolate them in terms of performance, and so that non-critical applications do not affect those that need speed.
Pool 0 (RAID5) is designed for critical application servers and consists of SAS 10k drives.
Pool 1 (RAID6) - these are user "balls" and all sorts of undemanding performance environments. It consists of NL SAS 7.2k drives.
Examining the summary of disk groups shows that FAST Cache is disabled on pool group 1.

The conversation with the customer made it clear that this was done in order to increase the priority of resources for performance critical Pool 0.
It is interesting to note that despite this, complaints come from applications using Pool 0, whose disks are almost not loaded. Moreover - 80% of all read operations and 91% of all write operations of this pool are served by FAST Cache.

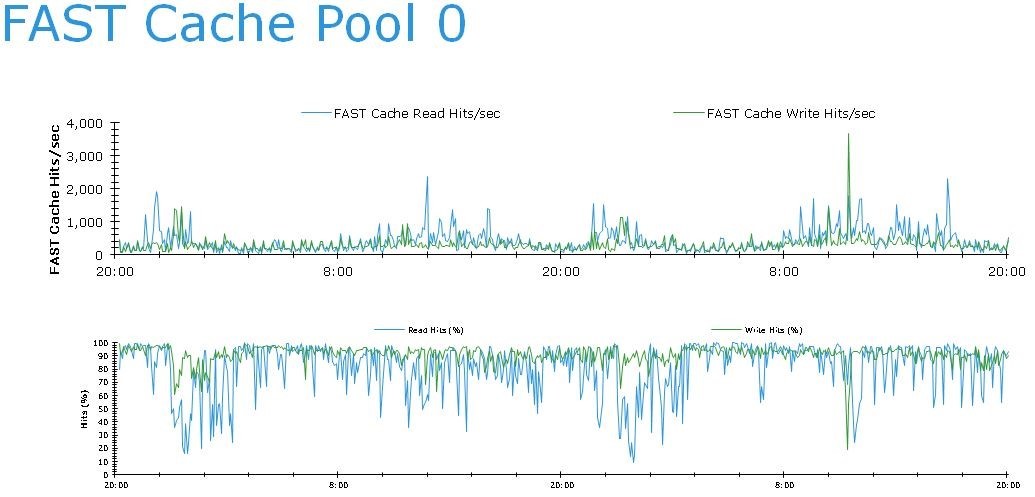
That is, despite the amazing effectiveness of FAST Cache applications are experiencing problems. Why? To move on, let's look at the LUNs and the load distribution among them.
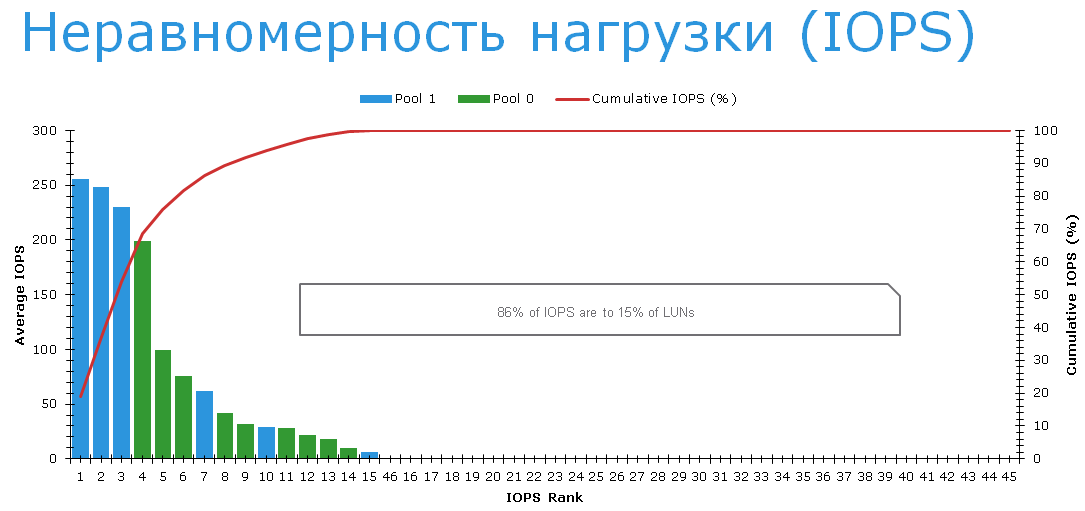
It turns out that the three most loaded LUNs are located exactly on the slow NL-SAS disks in RAID6. There are just no complaints about them. A conversation with users showed that they were extremely pleased with how quickly their file servers started working after switching to VNX.
There are complaints about the LUNs on Pool 0 (green on the graph above). Specifically, we are talking about LUNs with numbers 0 through 8, which are listed in the table below.

Now if you look at the degree of utilization of LUNs, it can be seen that the LUNs from Pool 0 are rather poorly utilized. The graph below shows the horizontal numbers of LUNs, so it’s easy to identify which LUNs are “ours”. The most “loaded” of them is only 40% busy.
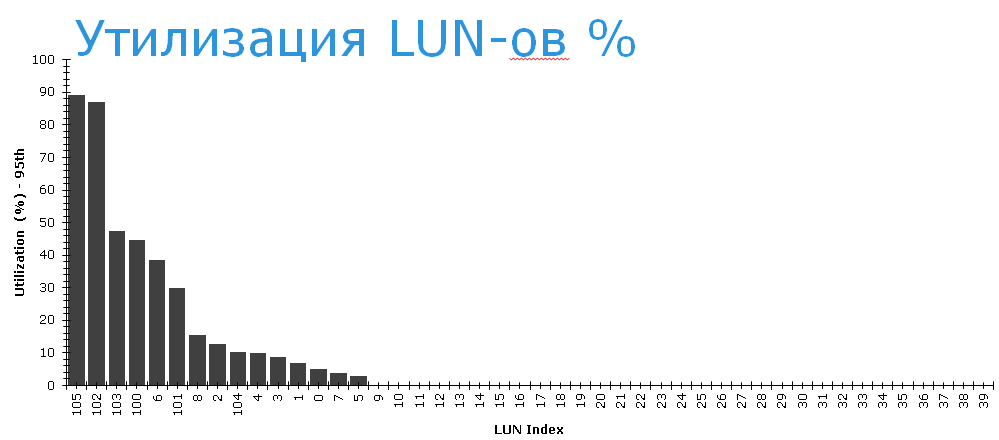
The system works "average good." The average response time of volumes within 10 ms. This is the average temperature in the hospital.
Against the background of the fact that the load on problem LUNs is low, we can conclude that the problem is their competition for some common resource.

Let's see how the system cache works. Reading from the cache is very efficient.

Analysis of the operation of the write cache shows that its load is kept within the specified frames of 60-80% with periodic bursts of up to 90% or more. It's not very good.

Let's see how often the system has to resort to extreme measures in order to clear the cache to an acceptable level.
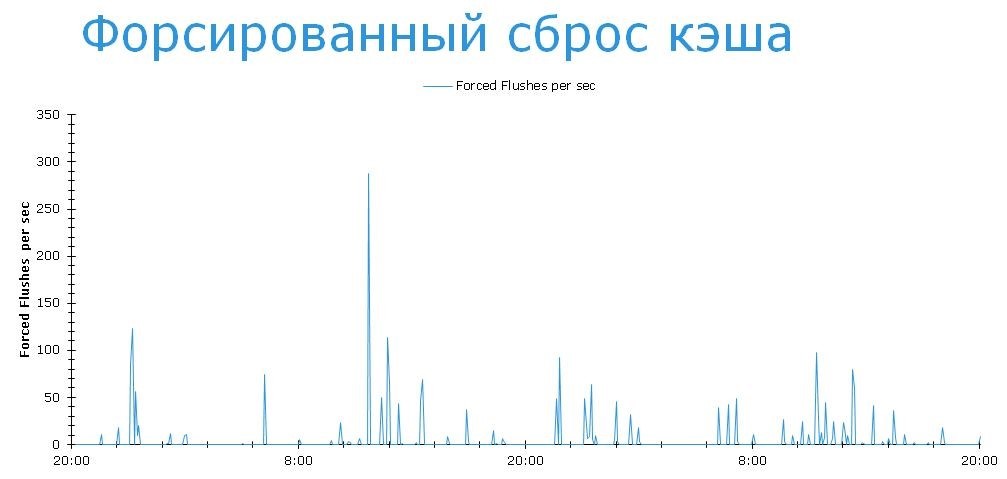
This means that the system does not have time to work out bursts of recording. But the system settings can be changed by moving the upper and lower boundaries to more comfortable levels. 30-50%, for example. But this is the same as knocking down a patient’s temperature. To do this, you must first make a diagnosis and the root cause. Now let's look at the pools and try to understand what exactly causes forced cache flushes.
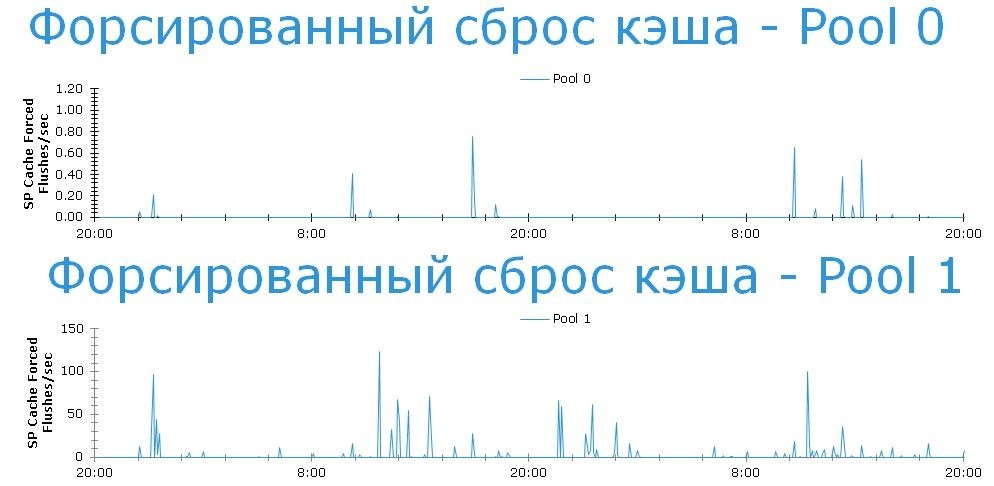
We see that on both disk pools regular forced drops occur. Moreover, if this happens extremely rarely on Pool 0 (isolated cases), then on Pool 1 this situation is very difficult (tens and hundreds of events per hour). But we are interested in exactly Pool 0. Everything is fine there, isn't it?
We came close to a solution. But to move on - a digression, because you need to explain the logic of managing the fullness of the write cache in VNX. It is demonstrated below.
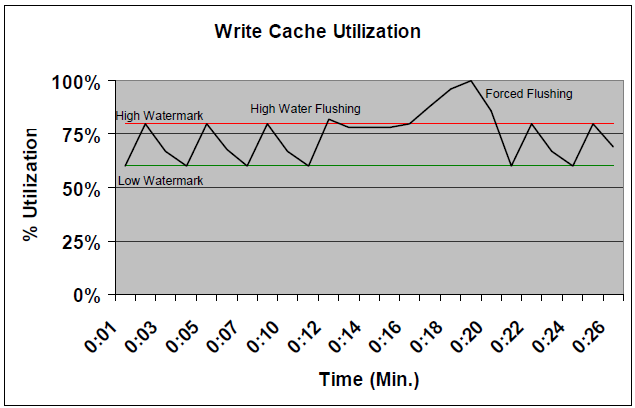
In normal mode, the system maintains a cache between two borders - High and Low watermarks.
The lower limit is the threshold below which the write cache is not flushed, because the data that it contains may be needed to read, or be overwritten. In addition, the VNX write cache by its nature holds a certain number of data blocks, in the hope that they can be combined for recording with other, nearby blocks, for writing to physical disks. This reduces the load on the back-end.
The upper limit is the threshold for enabling the flushing of the write cache on disks. When the High Watermark Flushing mode is turned on, data from the cache to the disks is flushed to the lower level, after which it returns to standby mode.
We do not want the cache to be filled to 100%, because then we will not be able to provide space for new entries. Therefore, they try to keep the upper limit at a safe distance from 100%. Usually 80% is normal. But it can be lower. It all depends on the nature of the load.
If the cache is filled to 100%, then from the High Watermark flush mode, the system turns on forced cache flushing, or Forced Flush.
Forced Flush mode has a major impact on all write operations to storage. New data is written to the storage system with an additional delay. Those. in order to write a data block to the storage system, you must first free up space from the old data using the LRU (Least Recently Used) algorithm, etc.
Let us return to our situation. Obviously, slow Pool 1 is a weak point in terms of write cache. The data that arrives at slow disks in RAID6 lingers in the cache longer than necessary, and when it comes to Forced Flush, it takes too long to switch to physical disks.
It should be noted that Pool 0 uses FAST Cache, and most of the requests are served from flash drives. Until Forced Flush arrives and the flash response time begins to depend on how quickly data is flushed to the NL-SAS. It looks like the weak link is found. As far as this conclusion is true, a test of a hypothesis in practice should show.
How then can one explain the alibi of the “suspect” - low NL-SAS disk usage? Since the significance of the load is the average over a time interval, and in this case the statistics collection interval was 10 minutes, it is possible that during this time a short burst of data recording occurred, causing a short “freeze” of applications, and on average in 10 minutes the load was not that big . Since we have found where Forced Flush is the most important, there can be no doubt about the “guilt” of this disk pool.
What can be done about this?
The implementation itself contains planning errors, because the old approach to configuration in a system with a new generation architecture is used. Communication with the customer helped to clarify that the matter is in the previously adopted standards, which were not revised at the time of planning. But since the system is already combat and cannot be rebuilt, it remains to look for solutions in the field of online reconfigurations so as not to interrupt the operation of applications.
I have found at least three measures that can be taken either individually or together, complementing each other. I list by degree of complexity of implementation.
- In order for the storage system to work out periodic bursts of load, it is necessary to lower Low / High watermarks to the level of 30/50 and see how successfully these bursts will be worked out. Ideally, the fill of the write cache during bursts should not reach 90%.
- Enable FAST Cache on Pool 1. The most frequently updated data will switch from slow drives to SSDs. Flushing the write cache on the SSD is much faster. This will reduce the likelihood of Forced Flush occurring.
- Create a RAID10 RAID group on free SAS 900GB 10k disks (4 pieces) and transfer the most frequently updated LUNs from Pool 1 to them. In the created RAID group, turn off the write cache.
There are other optimization methods, however, I specifically tried not to complicate this example in order to more compactly demonstrate one of the possible approaches.
You can start with these measures, since all of the above changes are reversible and can be applied or canceled in any order.
In the process of further studying the behavior of the system, other useful conclusions can be made.
Afterword
Intelligent storage systems have rich built-in functionality for both analysis and performance tuning. However, detailed manual analysis and tuning are quite time-consuming tasks that we touched on only superficially in this post. Usually, administrators have very little time to fully study the operation of storage and its optimization. With dynamic workloads and increasingly complex IT infrastructures, a new level of development and automation is required.
To solve these problems, a whole range of technologies has been developed at all levels.
From more convenient and faster performance analysis to new intelligent and self-optimizing systems.
Here are just a few examples:
- 1. Mitrend - an automated analysis of the work of IT infrastructure of different manufacturers, freely available to everyone
2. Automated tiered storage and cache on SSDs: FAST VP and FAST Cache
3. Next-generation systems have an adaptive VNX2 cache with intelligent auto-tuning of the data reset speed to each LUN ( see whitepaper page 13 ).