DevTips: Web Developer Tips (17-32)
- Transfer
- Tutorial
Continuing the translation cycle of useful tips for the web developer. Other parts: 1-16 , 33-48 .
Contents :
17. Quick editing of the HTML tag name in the Elements panel
18. Expanding all the child nodes of the selected element
19. Switching the state of the DevTools tab using hot keys
20. Switching to the DOM element from the DevTools console
21. Highlighting the executed expression
22. Improvements in the operation of the Color Picker
23. Turning on a breakpoint and navigating the call stack using hotkeys
24. Viewing the definition of a function registered as an event handler on a DOM element
25. Notification of a JS error while writing code
26. Persistence of display settings for Incognito mode
27. Visualization of the selected animation smoothing mode
28. Viewing and changing breakpoints of the DOM tree using the panel «the Breakpoints»
29. Five interesting possibilities panel «Console»
30. Completion of the object properties and methods in the «Console» panel
31. Viewing and debugging event handlers
32. Automatic stop program execution when Arise SRI for any exclusions
If you need to change the name of the DOM node in the Elements panel, double-click on its opening tag and enter a new name. The closing tag of this element will be changed automatically.
You can expand all the nested nodes of the selected element by holding down the Alt key and clicking on the arrow next to its opening tag.
Toggle the two last used panel display mode DevTools using shortcuts Cmd + Shift + D . The panel supports the following display options:
If a DOM element is output to the console (for example, this can be done using the method
You can see the specific expression on which the code execution was stopped: it is highlighted in dark blue. This can also be useful when debugging minified code.
DevTools development team has improved the color picker:
When working with the debugger, several keyboard shortcuts will help you:
Switch to the “Event Listeners” panel when choosing a DOM node, and you can see all the event handlers registered on it. You can also see the definition of any handler by selecting “Show Function Definition” in its context menu.
If you receive an error in the console, click on it to move to the code that caused the failure in the Sources panel (next to it you will see the icon and the error text). If you start editing the code, it will be executed again in real time.
Sometimes it’s much more convenient to debug in incognito mode, because it does not store your data, and browser extensions are not installed there by default.
Now DevTools remembers the panel display settings (mode, dimensions, etc.) and the tool settings (disabling the cache, etc.) and will use them when opening DevTools in incognito mode.
If the details are interesting, you can read them here .
If you see a property containing anti-aliasing (for example, ease-in in a property
Use the Breakpoints panel of the DOM tree to enable, disable, or remove the breakpoints that you have already set.
Auto-completion in the console works not only when using a period (
You can also use it when debugging arrays (
Use the function
You can stop the thread of execution when an exception occurs that is not handled by your code. To do this, enable the "Pause on exceptions" option in the "Sources" panel. In addition, you can catch all processed exceptions by checking the "Pause on caught exceptions" checkbox.
When using this functionality, you will be able to identify a problem in the code before the actual occurrence of the error.
Further more. Stay tuned!
Contents :
17. Quick editing of the HTML tag name in the Elements panel
18. Expanding all the child nodes of the selected element
19. Switching the state of the DevTools tab using hot keys
20. Switching to the DOM element from the DevTools console
21. Highlighting the executed expression
22. Improvements in the operation of the Color Picker
23. Turning on a breakpoint and navigating the call stack using hotkeys
24. Viewing the definition of a function registered as an event handler on a DOM element
25. Notification of a JS error while writing code
26. Persistence of display settings for Incognito mode
27. Visualization of the selected animation smoothing mode
28. Viewing and changing breakpoints of the DOM tree using the panel «the Breakpoints»
29. Five interesting possibilities panel «Console»
30. Completion of the object properties and methods in the «Console» panel
31. Viewing and debugging event handlers
32. Automatic stop program execution when Arise SRI for any exclusions
17. Quickly edit the HTML tag name in the Elements panel
If you need to change the name of the DOM node in the Elements panel, double-click on its opening tag and enter a new name. The closing tag of this element will be changed automatically.
View screencast

18. Expanding all child nodes of the selected item
You can expand all the nested nodes of the selected element by holding down the Alt key and clicking on the arrow next to its opening tag.
View screencast

19. Switching the state of the DevTools tab using hotkeys
Toggle the two last used panel display mode DevTools using shortcuts Cmd + Shift + D . The panel supports the following display options:
- attached to the right edge of the browser window;
- attached to the bottom edge of the browser window;
- displayed in a separate window.
View screencast

20. Switching to the DOM element from the DevTools console
If a DOM element is output to the console (for example, this can be done using the method
console.log), then you can switch to its representation in the Elements panel by selecting Reveal in Elements panel in the context menu of the displayed node.View screencast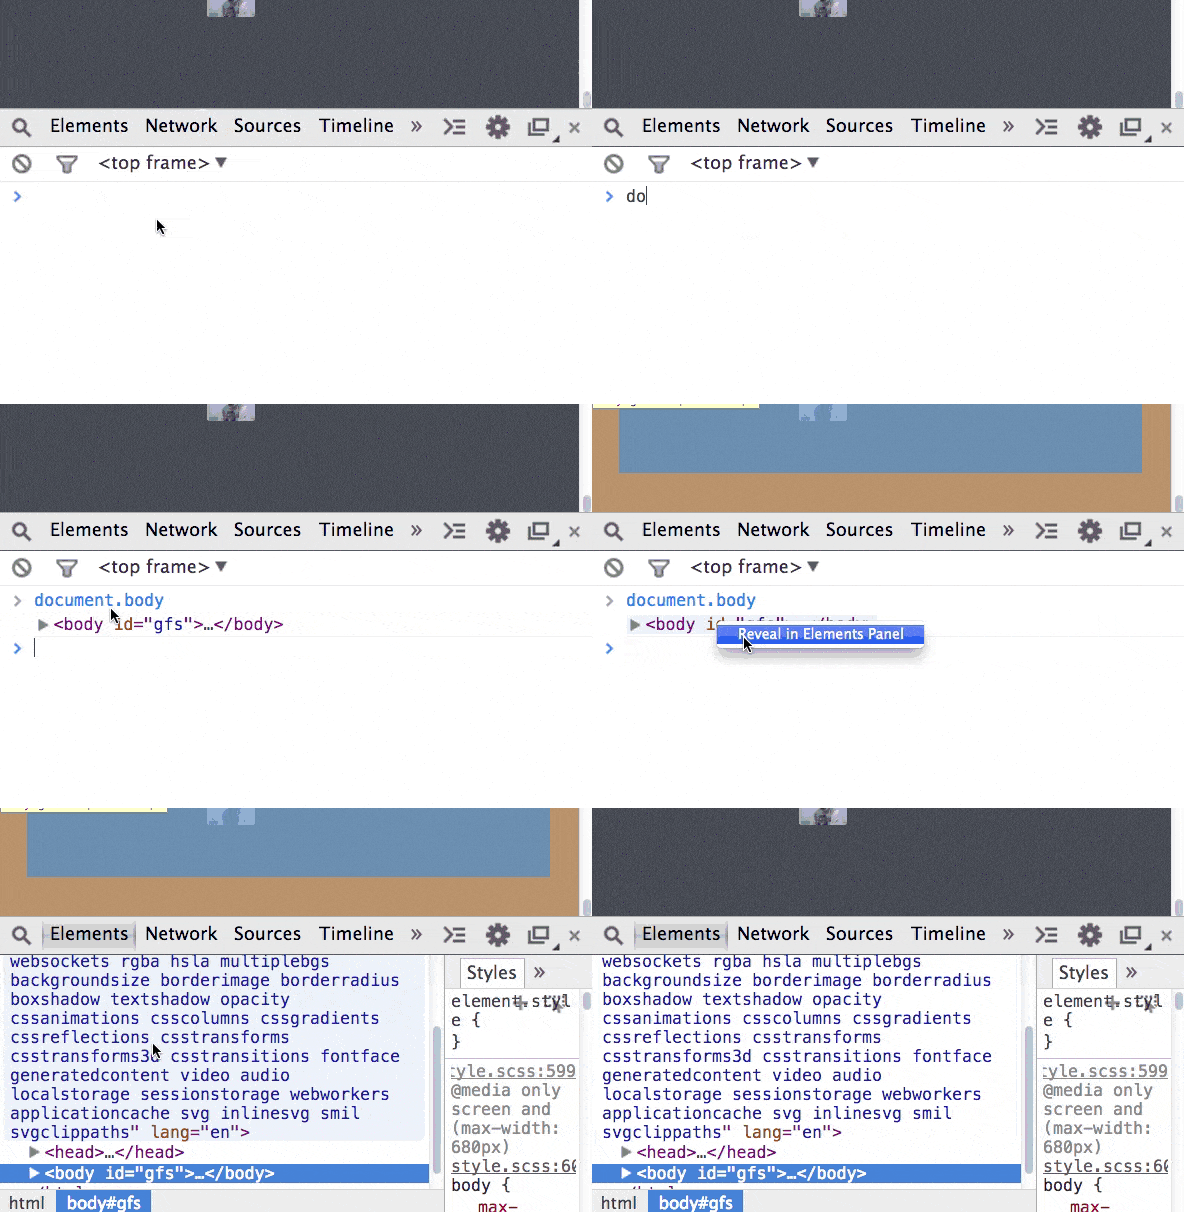

21. Highlighting an executed expression
You can see the specific expression on which the code execution was stopped: it is highlighted in dark blue. This can also be useful when debugging minified code.
View screencast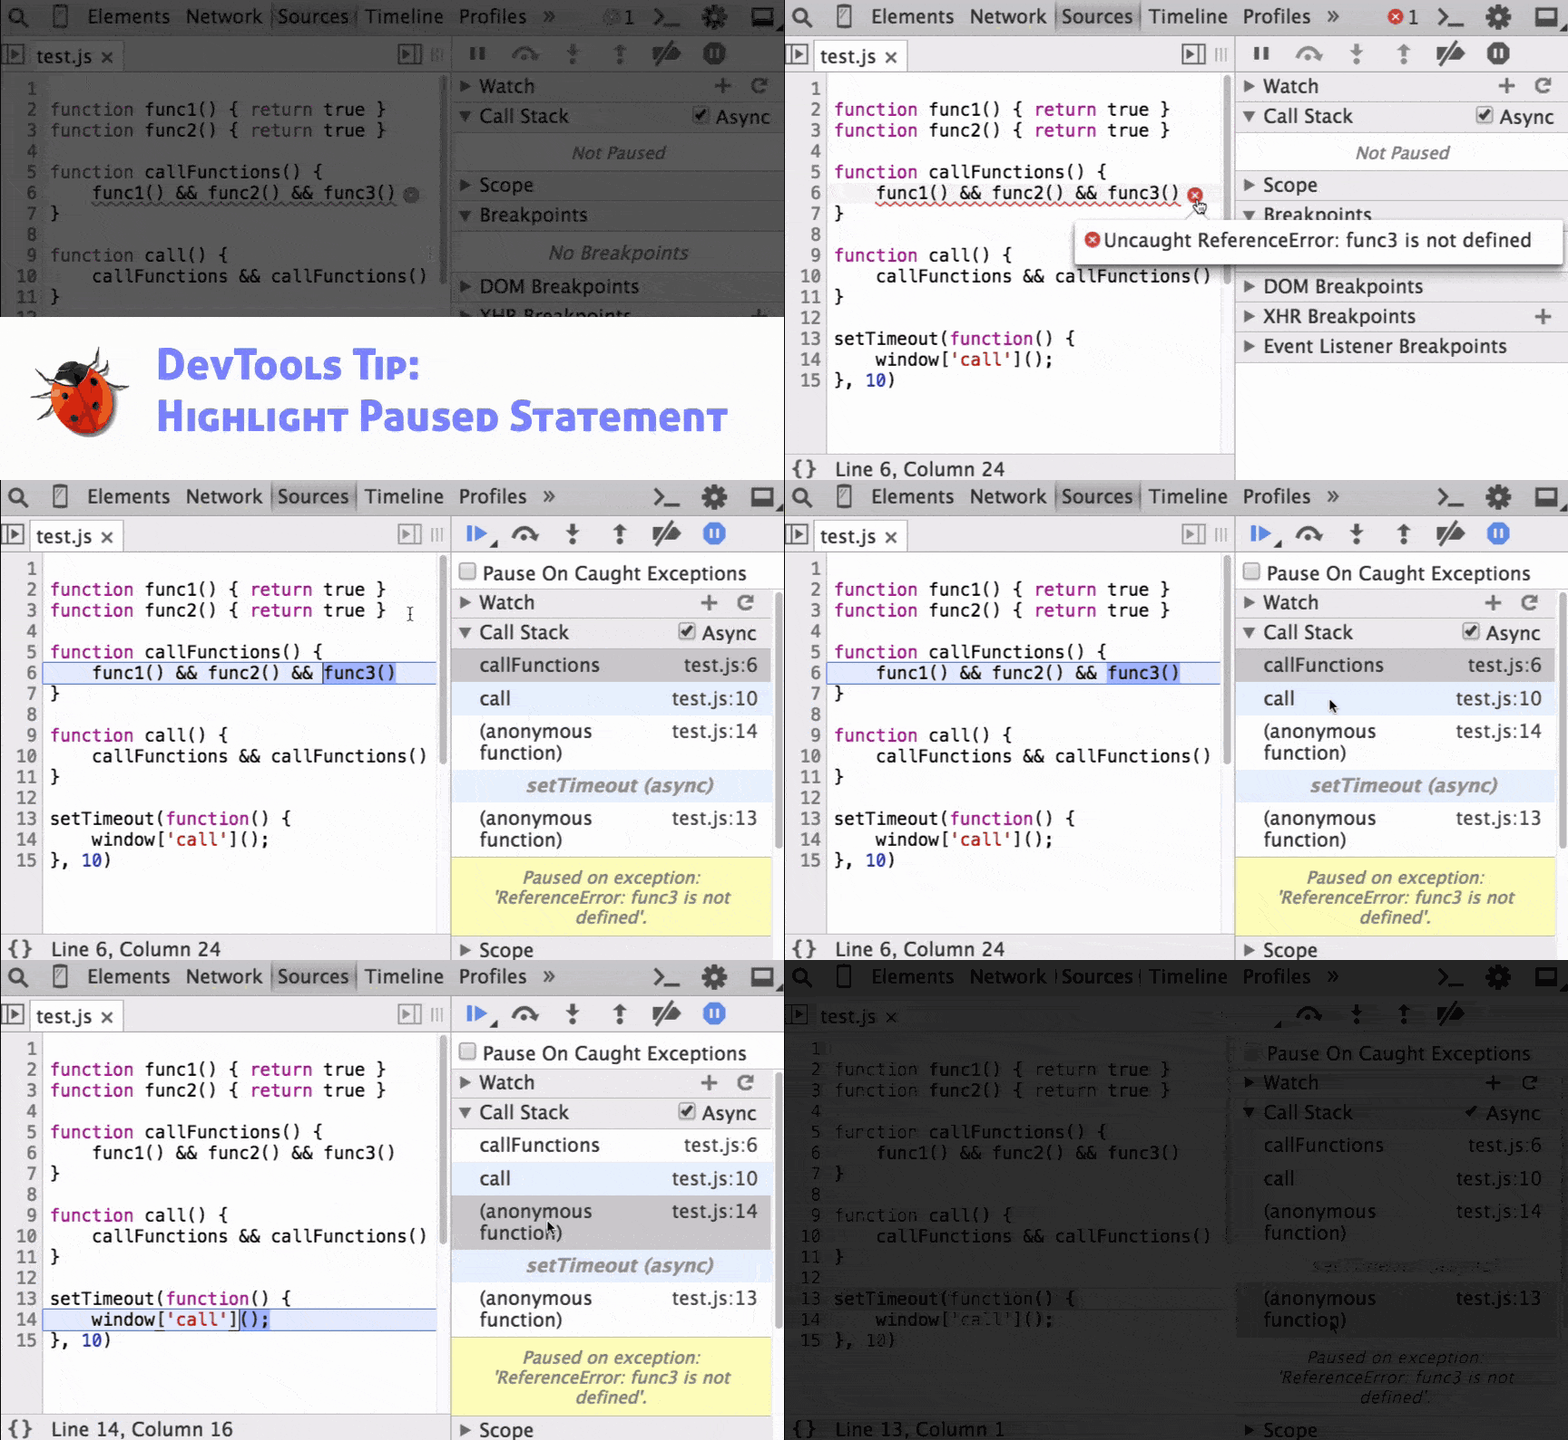

22. Improvements in the operation of the Color Picker tool
DevTools development team has improved the color picker:
- added functionality for capturing color from a web page (eyedropper);
- The interface has been simplified, allowing you to select a color from the palette (including the alpha channel);
- color switching format appeared (hex, rgba, hsla).
View screencast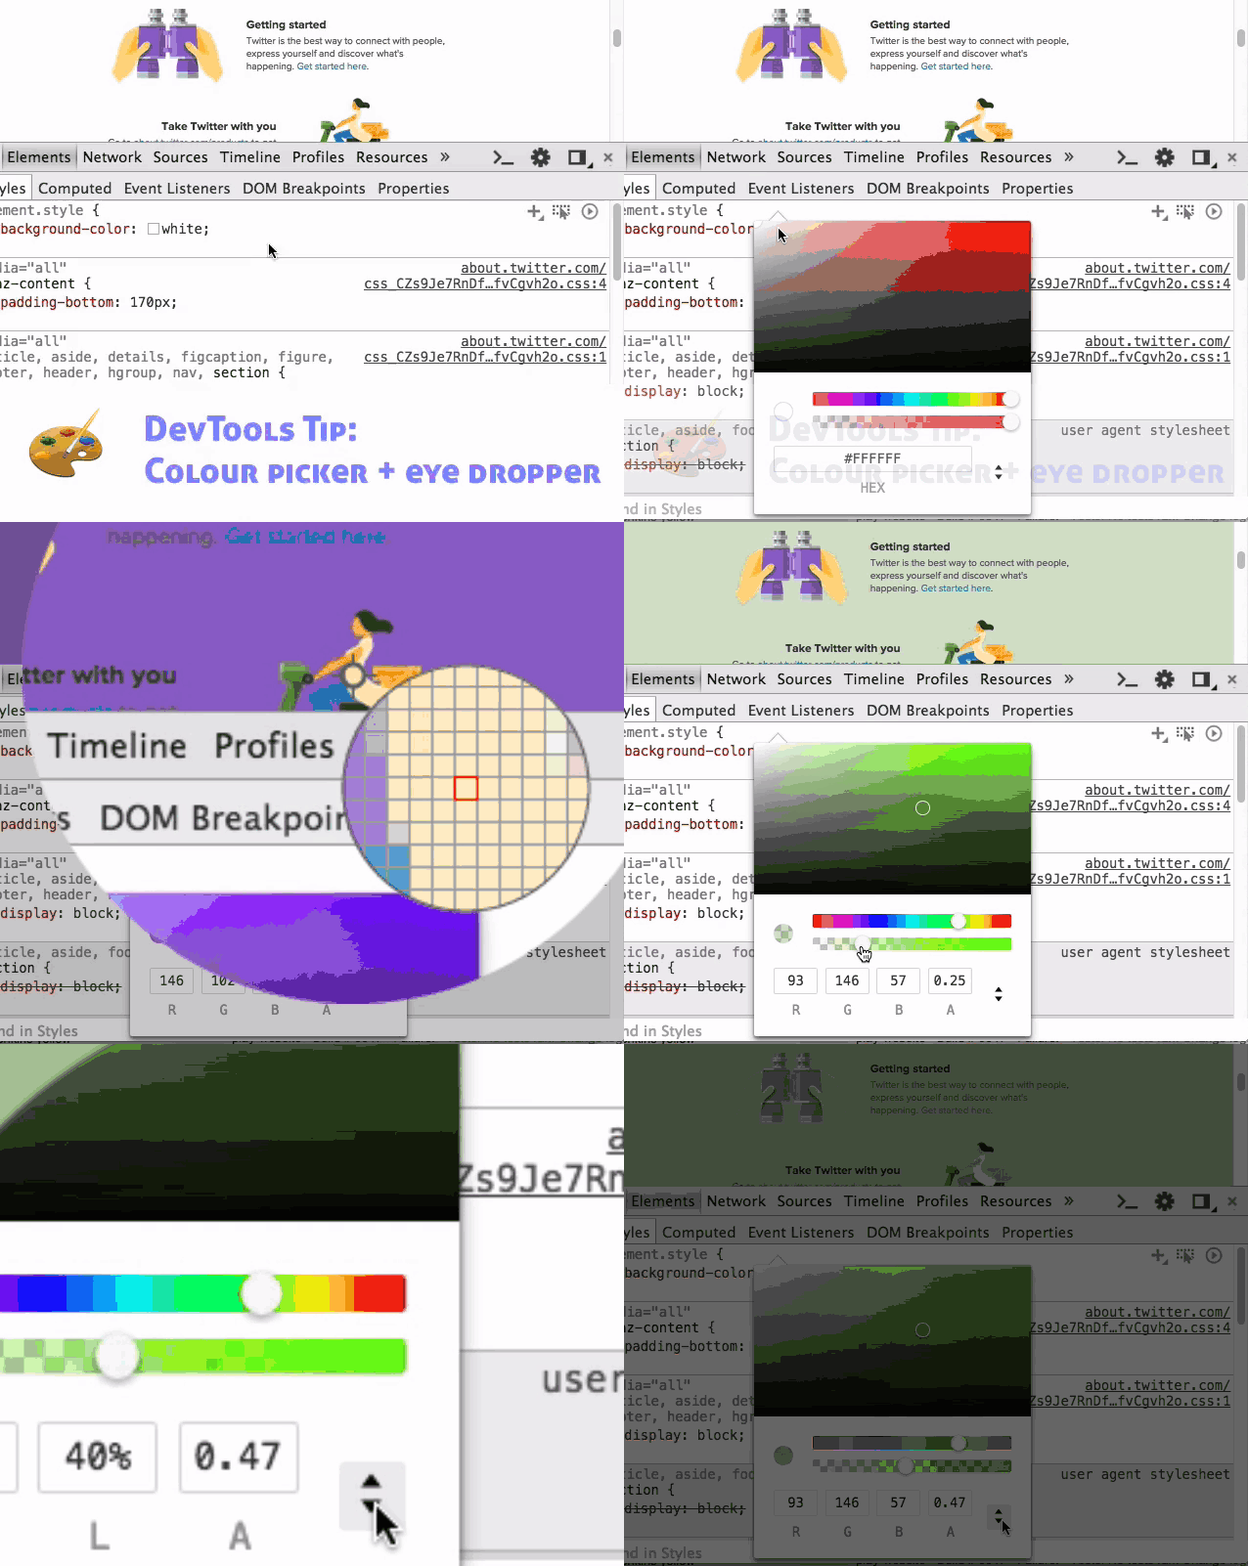

23. Turning on a breakpoint and navigating the call stack using hot keys
When working with the debugger, several keyboard shortcuts will help you:
- Turn on / off the breakpoint on the current line of the js file: Cmd + B
- Selecting the next frame in the call stack: Ctrl +.
- Selecting the previous frame in the call stack: Ctrl +,
View screencast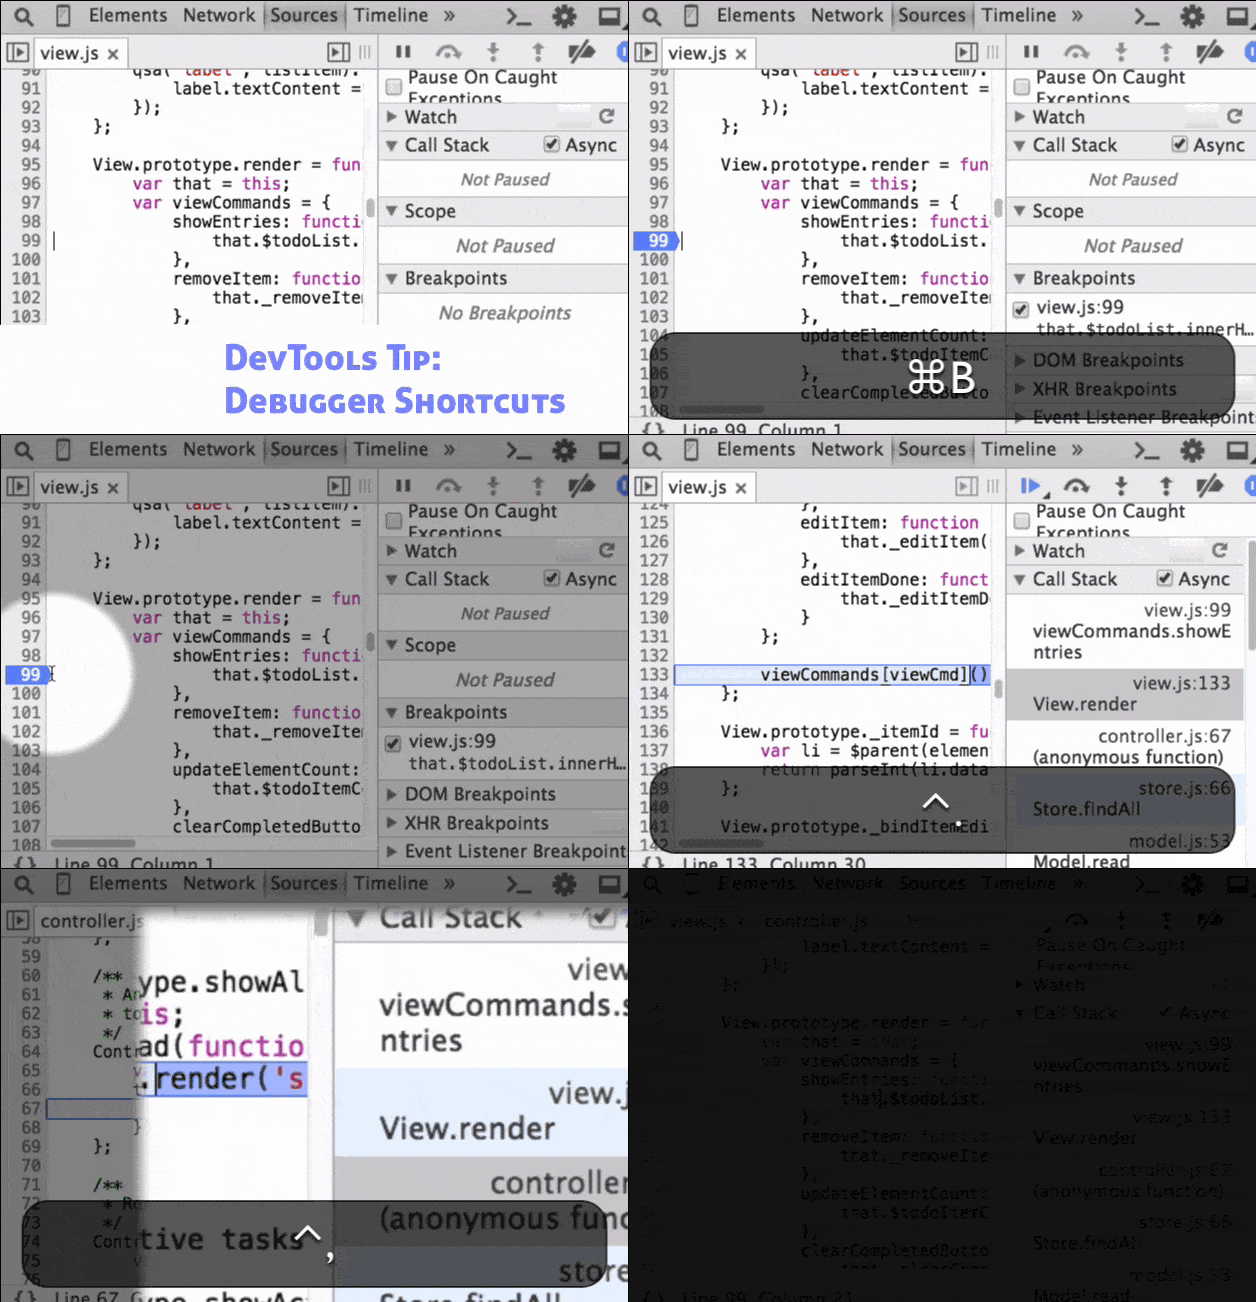

24. Viewing the definition of a function registered as an event handler on a DOM element
Switch to the “Event Listeners” panel when choosing a DOM node, and you can see all the event handlers registered on it. You can also see the definition of any handler by selecting “Show Function Definition” in its context menu.
View screencast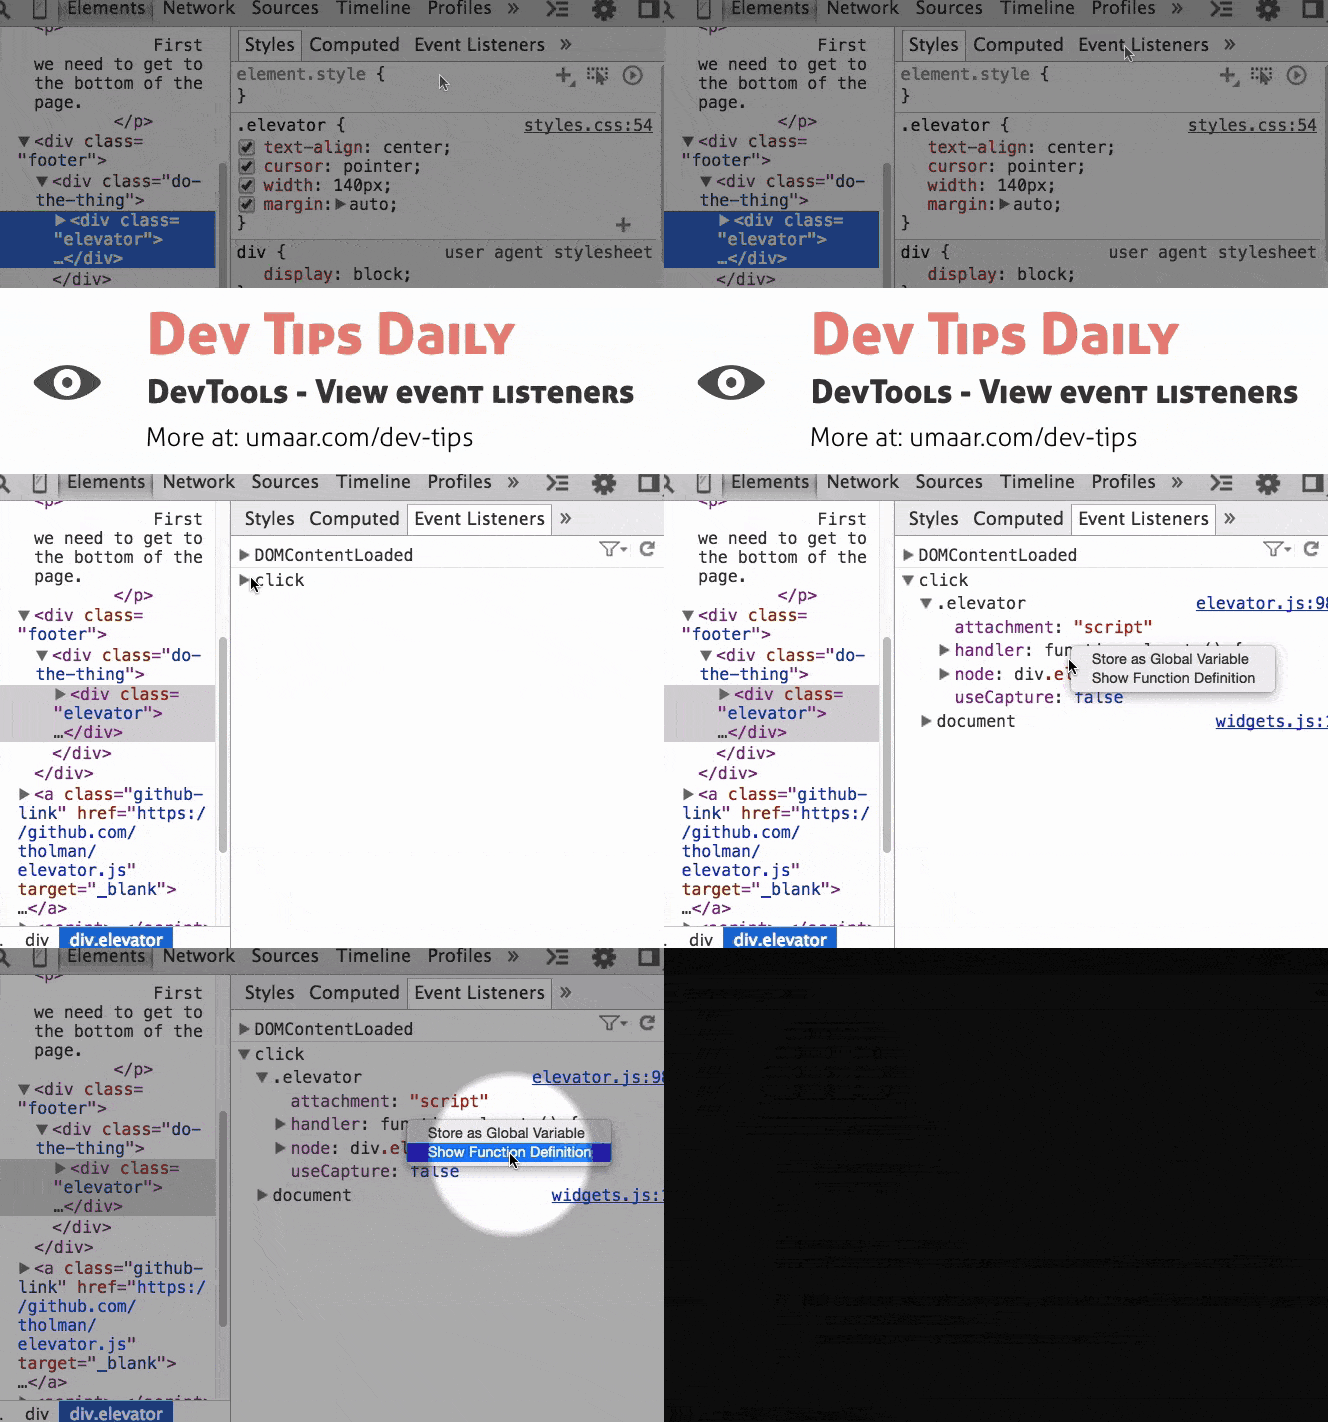

25. JS error notation while writing code
If you receive an error in the console, click on it to move to the code that caused the failure in the Sources panel (next to it you will see the icon and the error text). If you start editing the code, it will be executed again in real time.
View screencast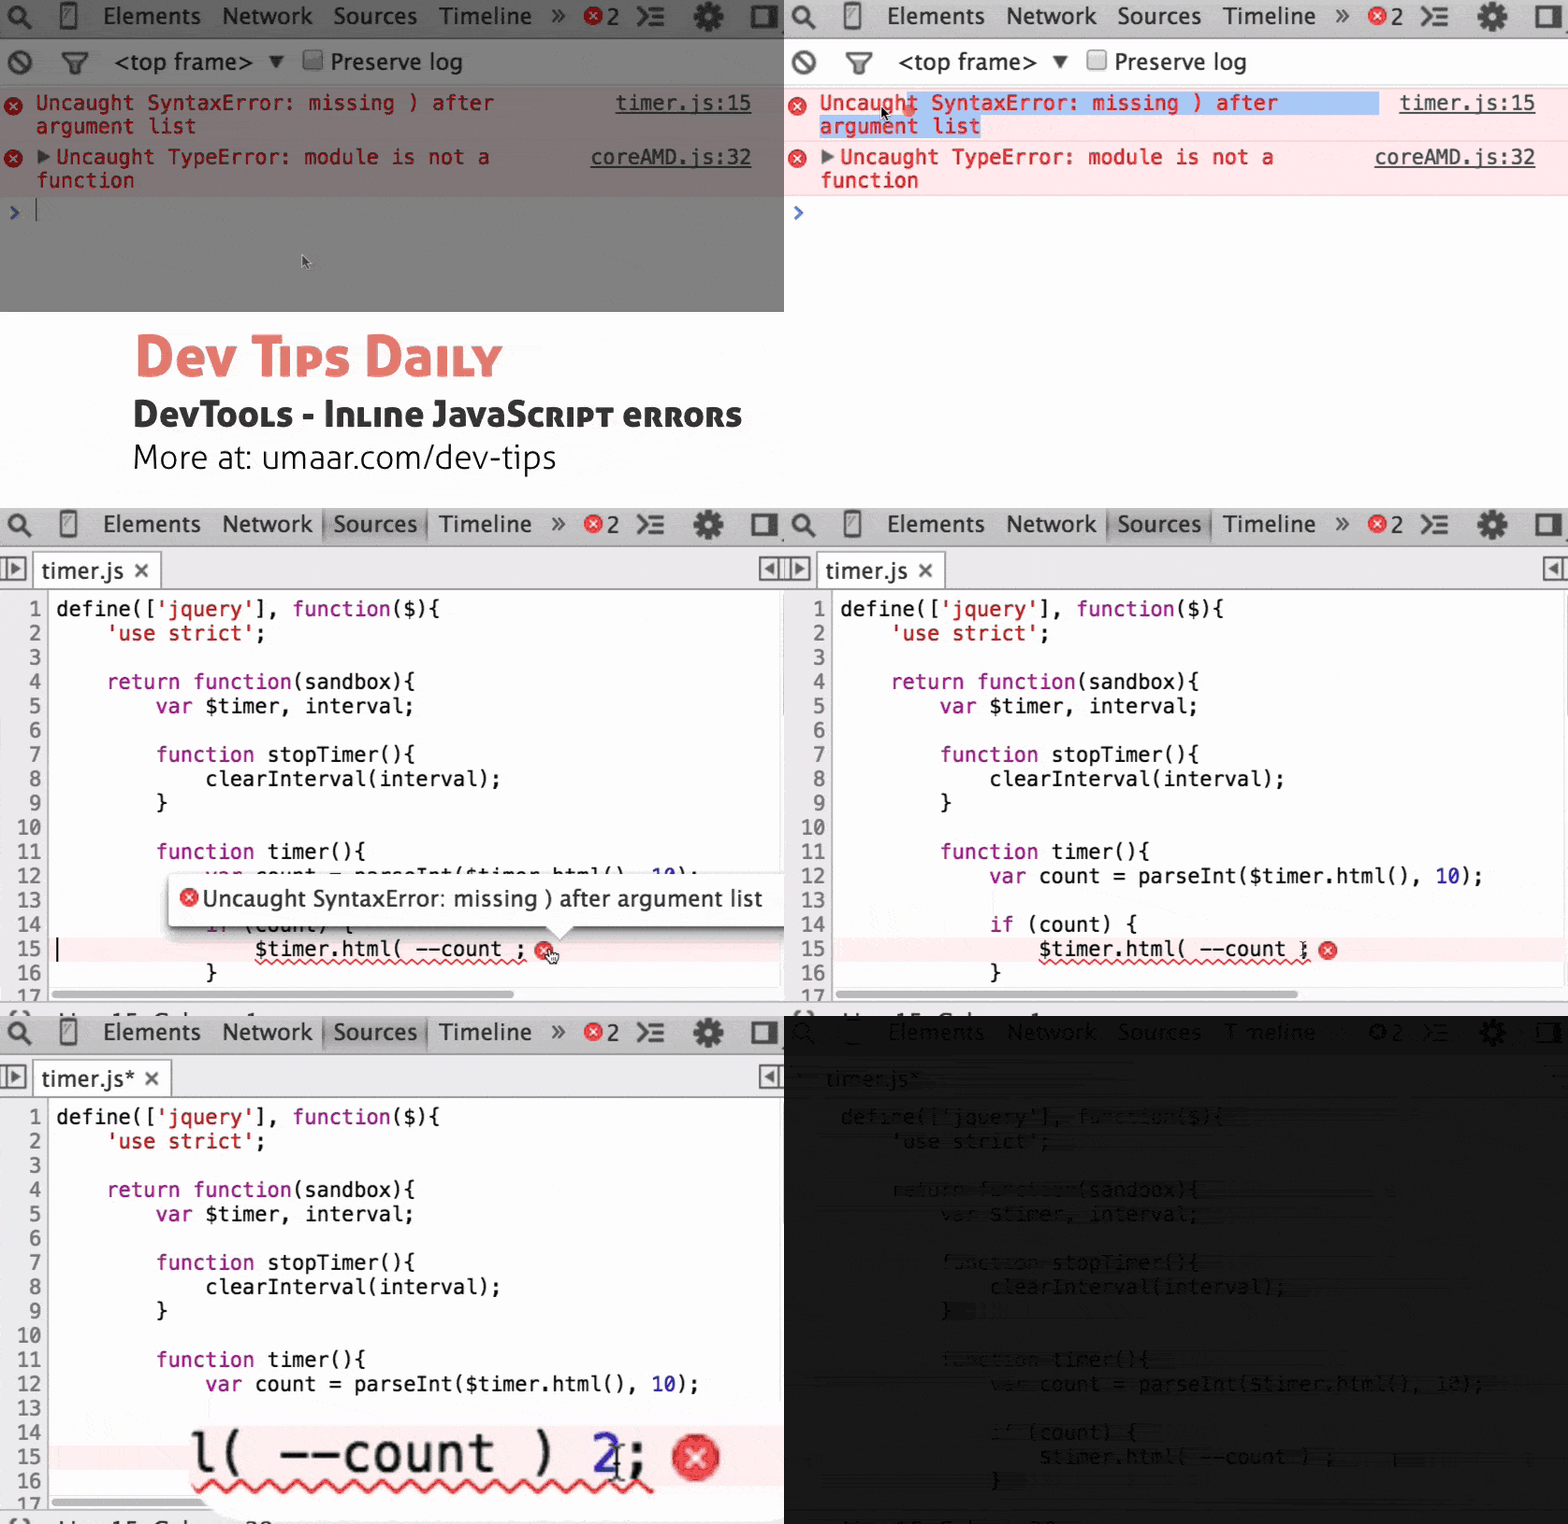

26. The persistence of the display settings for the incognito mode
Sometimes it’s much more convenient to debug in incognito mode, because it does not store your data, and browser extensions are not installed there by default.
Now DevTools remembers the panel display settings (mode, dimensions, etc.) and the tool settings (disabling the cache, etc.) and will use them when opening DevTools in incognito mode.
If the details are interesting, you can read them here .
View screencast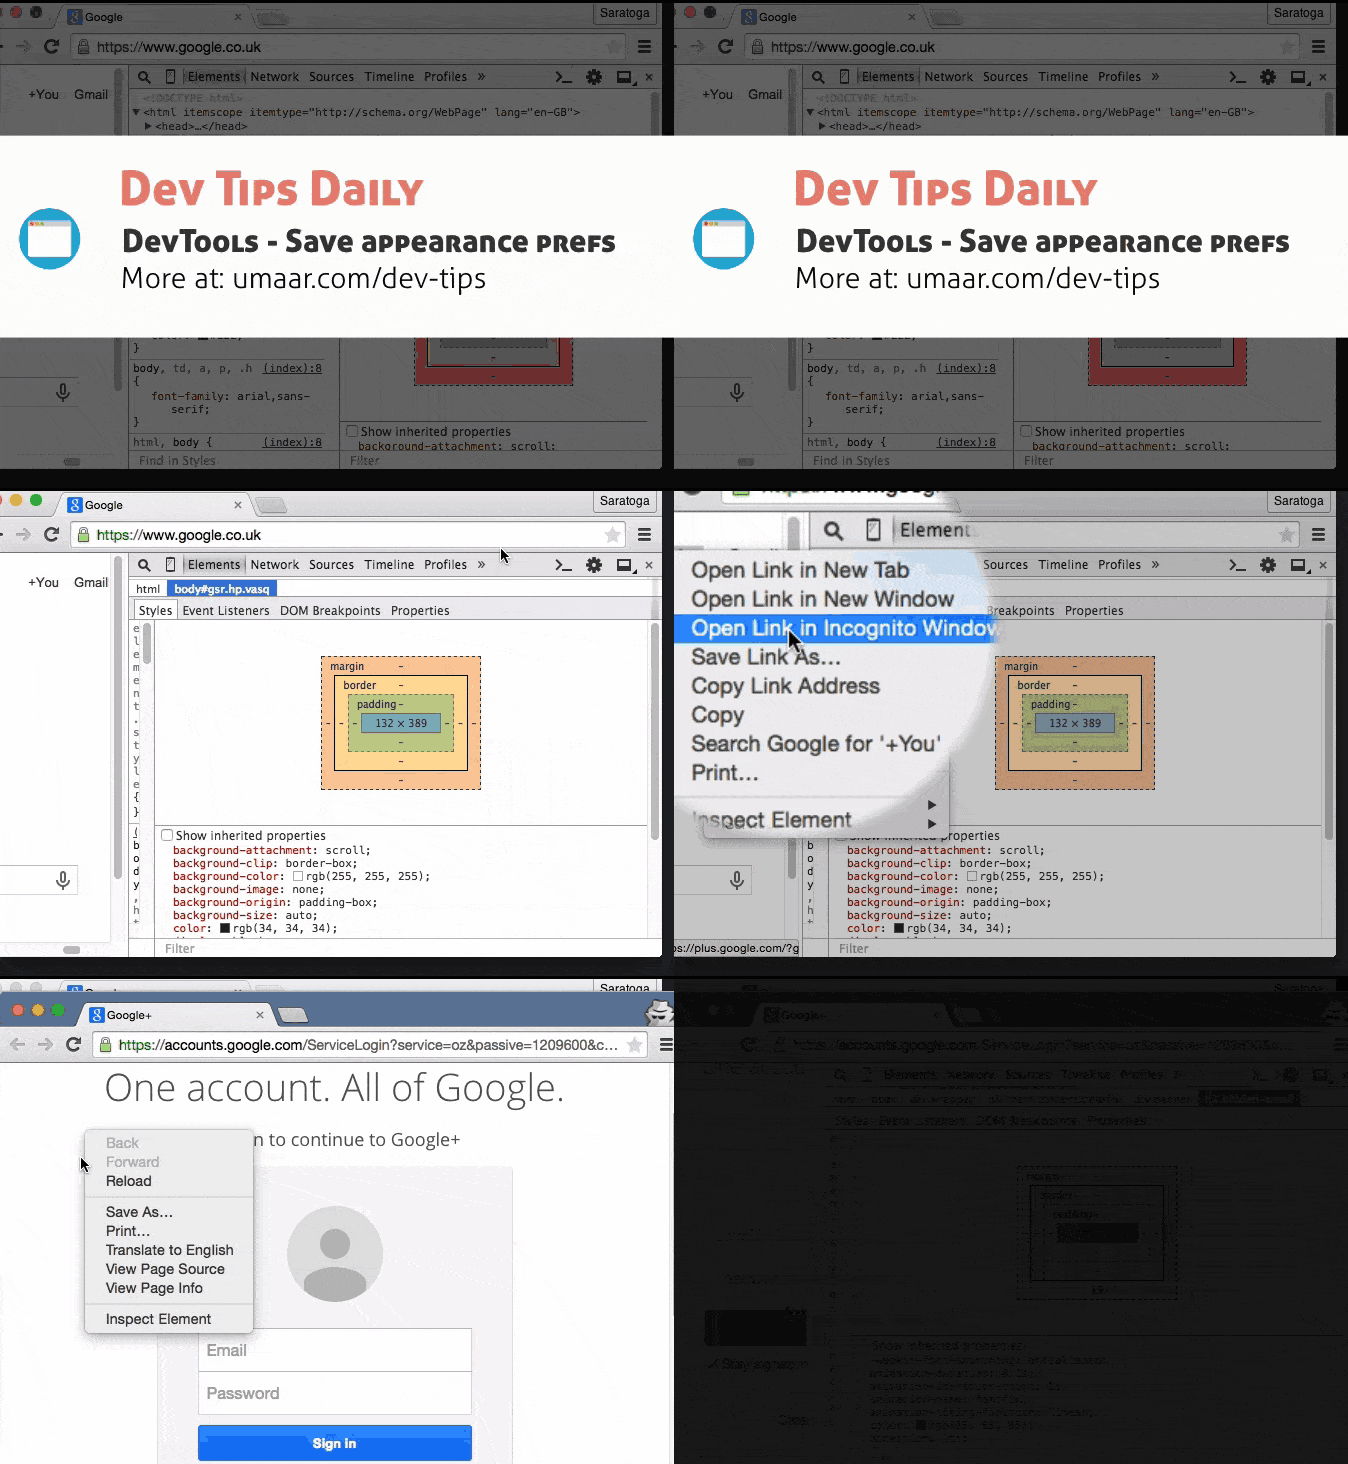

27. Visualization of the selected animation smoothing mode
If you see a property containing anti-aliasing (for example, ease-in in a property
transition: color .5s ease-in;), then in order to see what it looks like, click on the anti-aliasing icon. You can also try other anti-aliasing functions and apply the appropriate to the current element.View screencast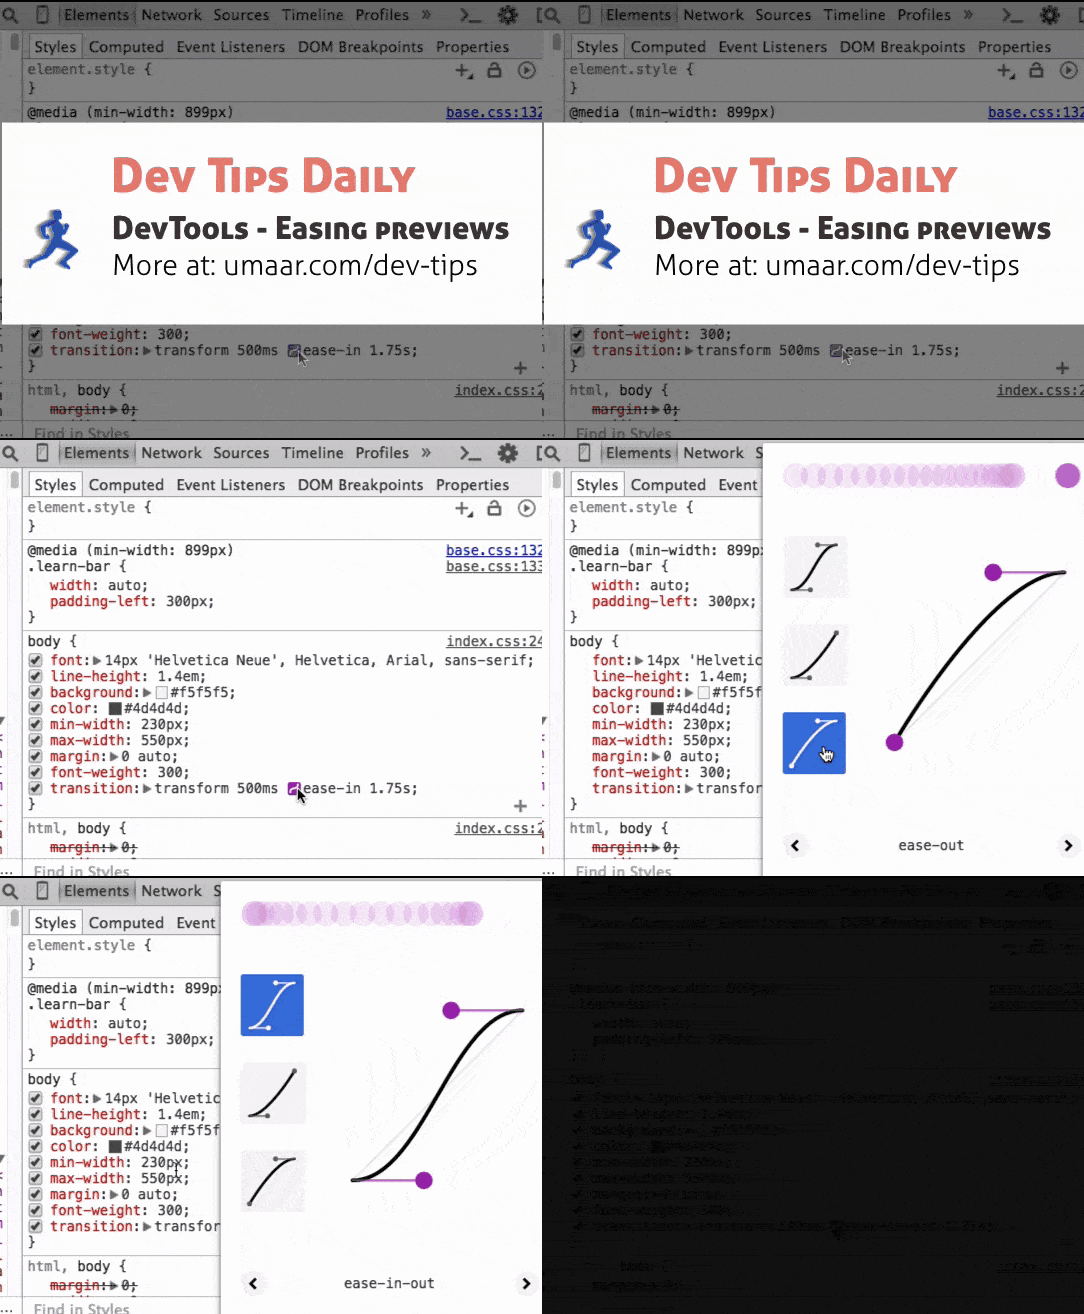

28. Viewing and changing breakpoints of the DOM tree using the Breakpoints panel
Use the Breakpoints panel of the DOM tree to enable, disable, or remove the breakpoints that you have already set.
View screencast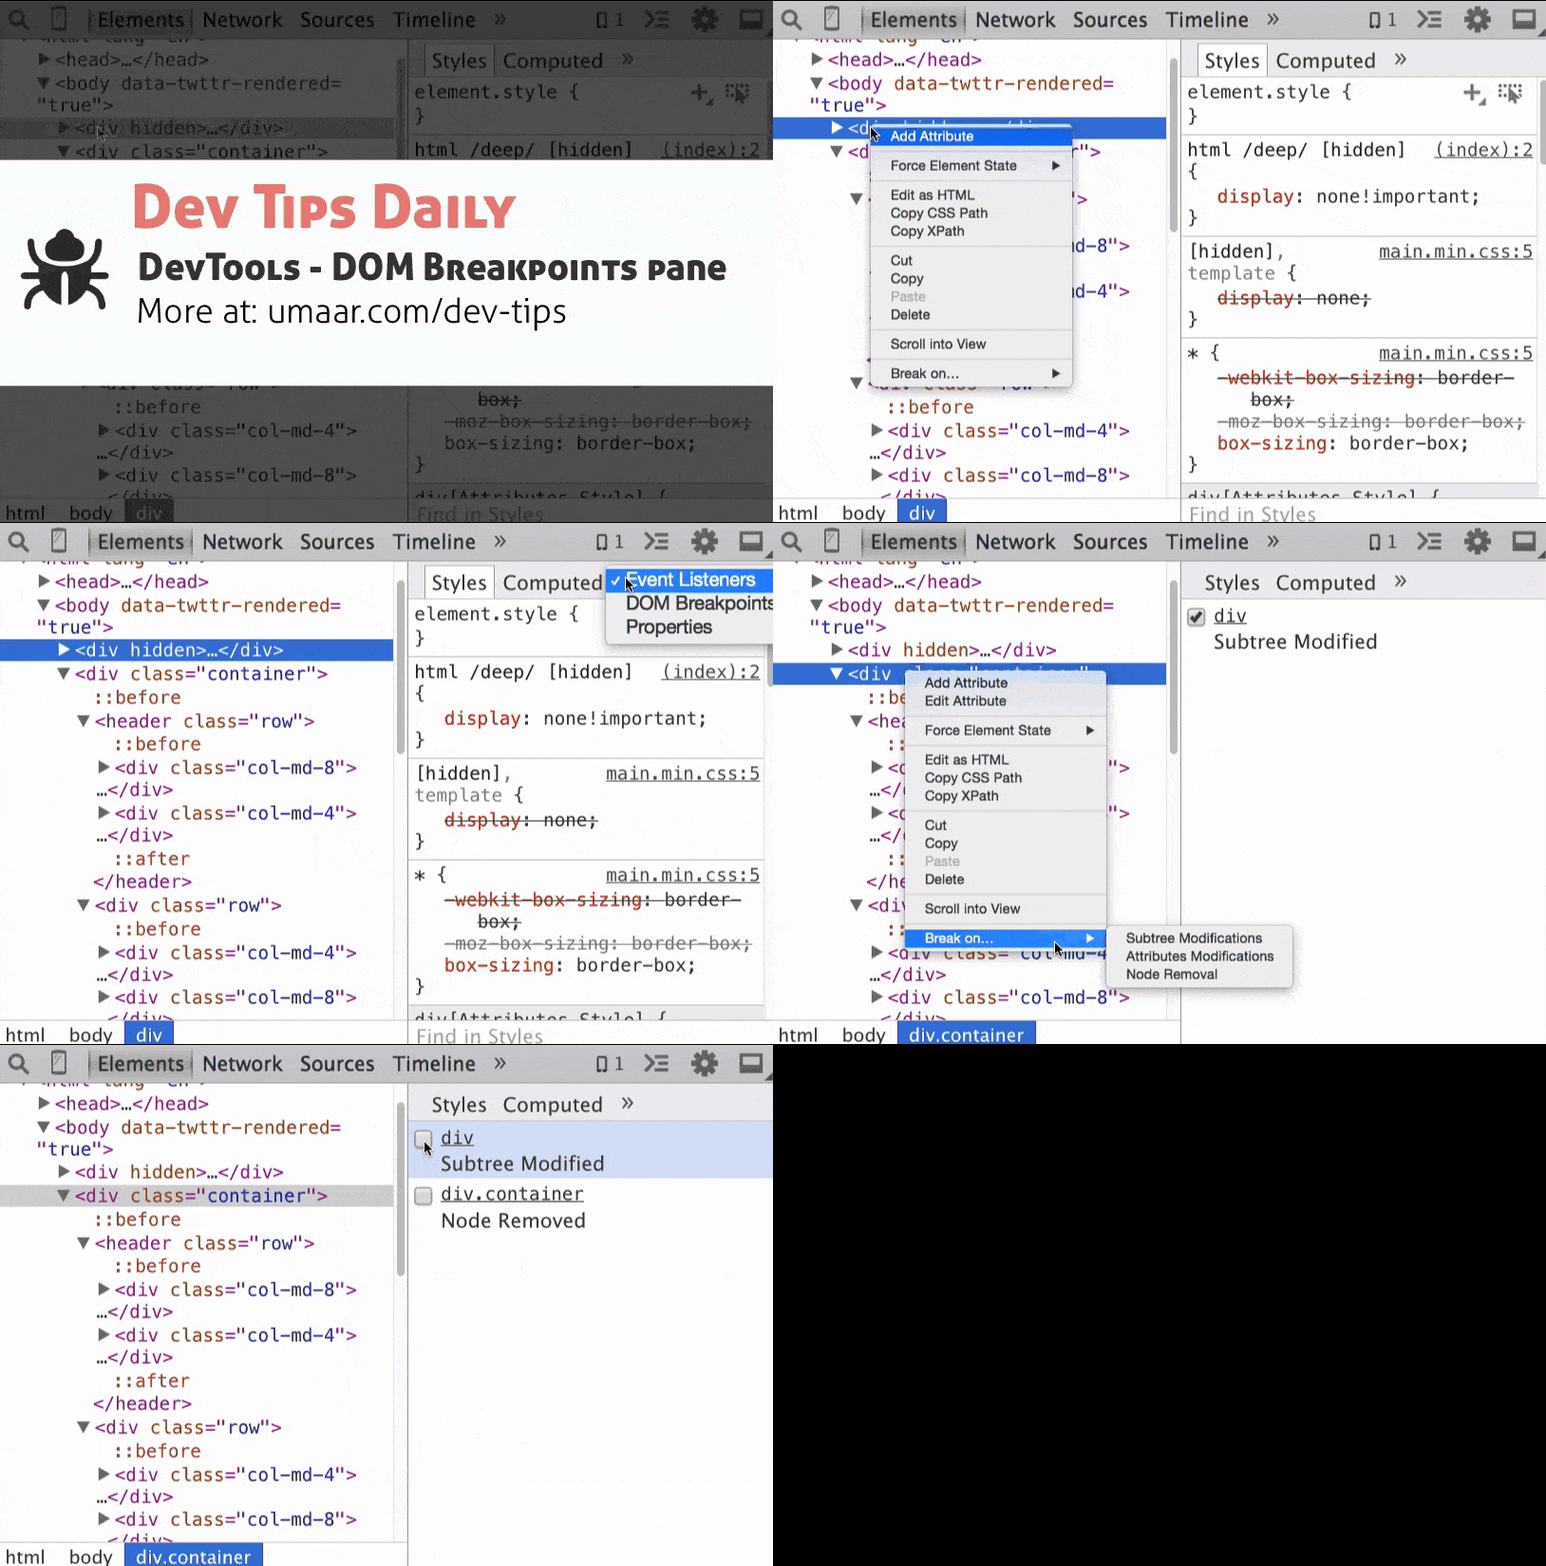

29. Five interesting features of the Console panel
- Select a specific DOM node in the Elements panel by passing it to a function
inspect(node) - Copy the text using the command
copy(text):copy(Object.keys(window))// скопирует все свойства объекта window ("top", "window", "location" и т.д.) - Stylize console output:
console.log("%cHello world", "font-size:40px; color:#fff; place_your_code: here") - Get an array of object values:
 values({

 one: 1,

 two: 2,

 three: 3

}); // выведет [1, 2, 3] - Clean the console using the Cmd + K hotkeys .
View screencast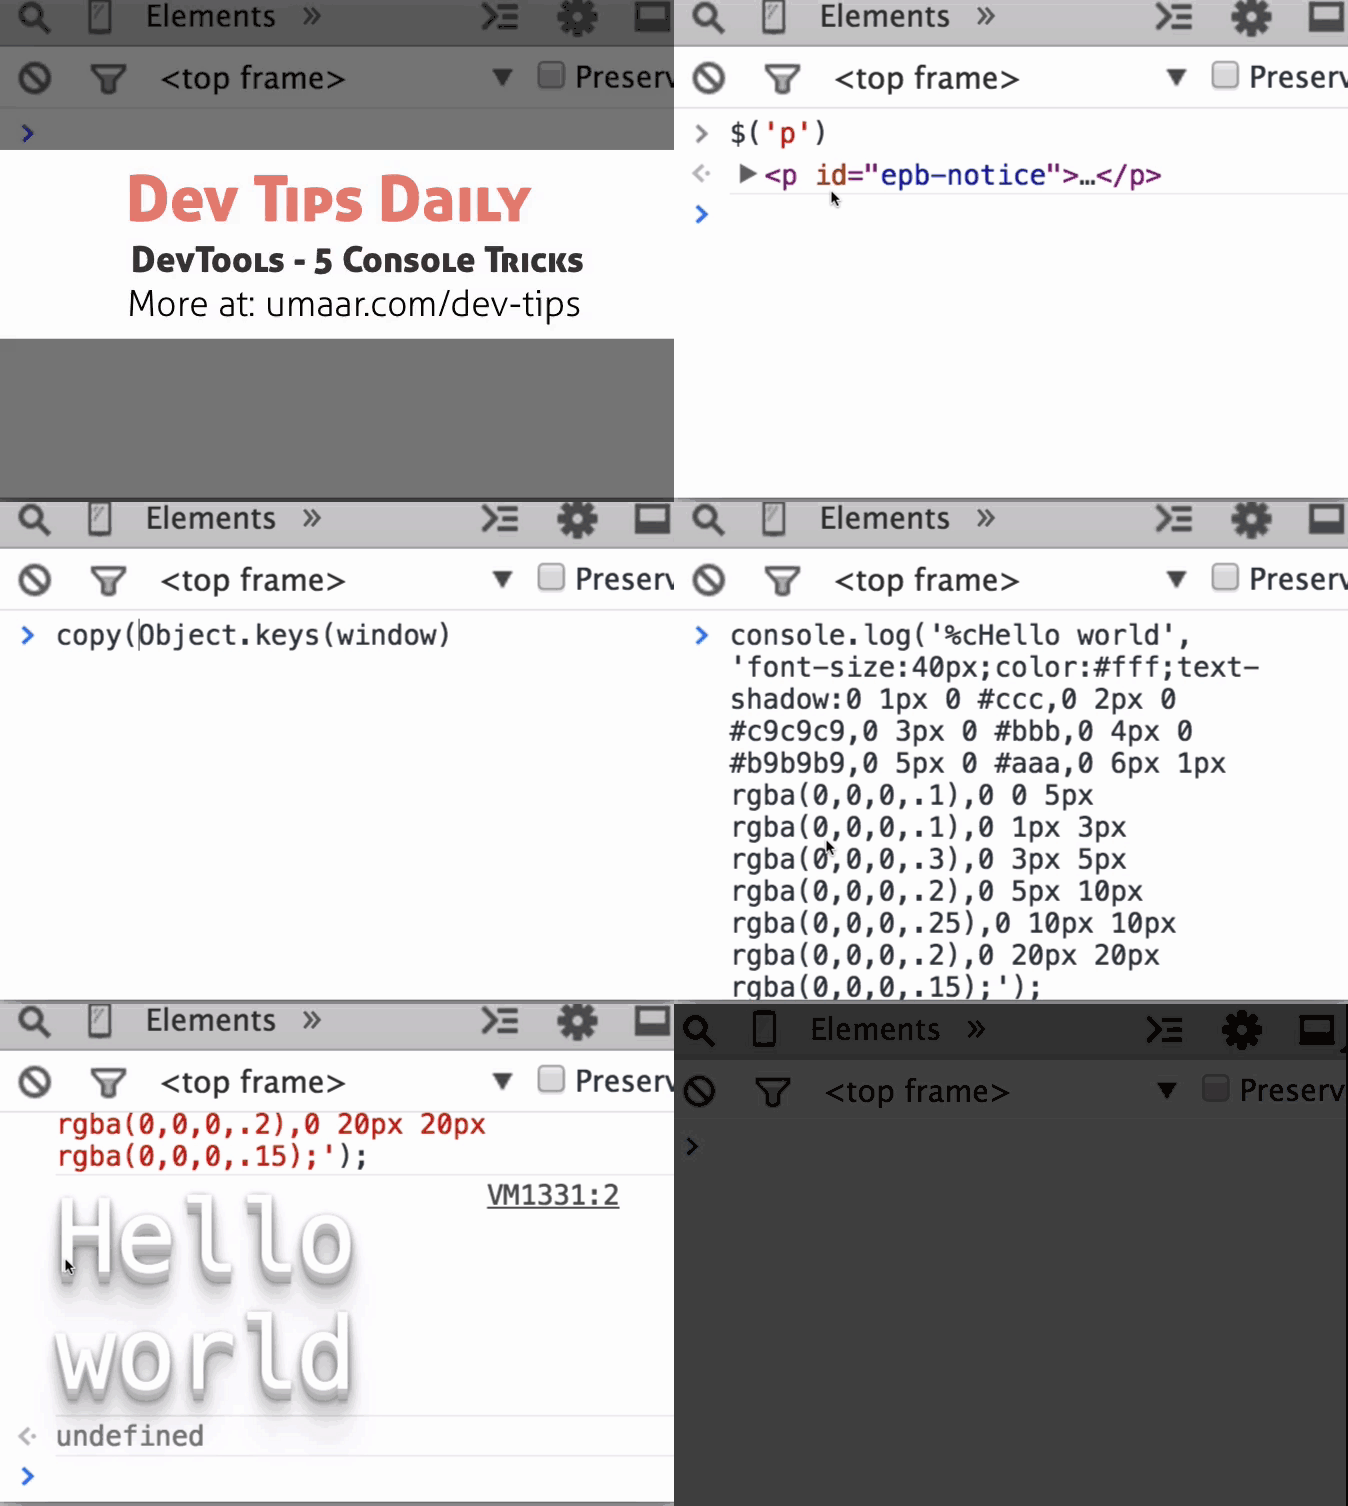

30. Autocompletion of object properties and methods in the Console panel
Auto-completion in the console works not only when using a period (
window.onlo→ window.onload), but also when using square brackets ( window['onloa→ window['onload']). You can also use it when debugging arrays (
arr[0→ arr[0]).View screencast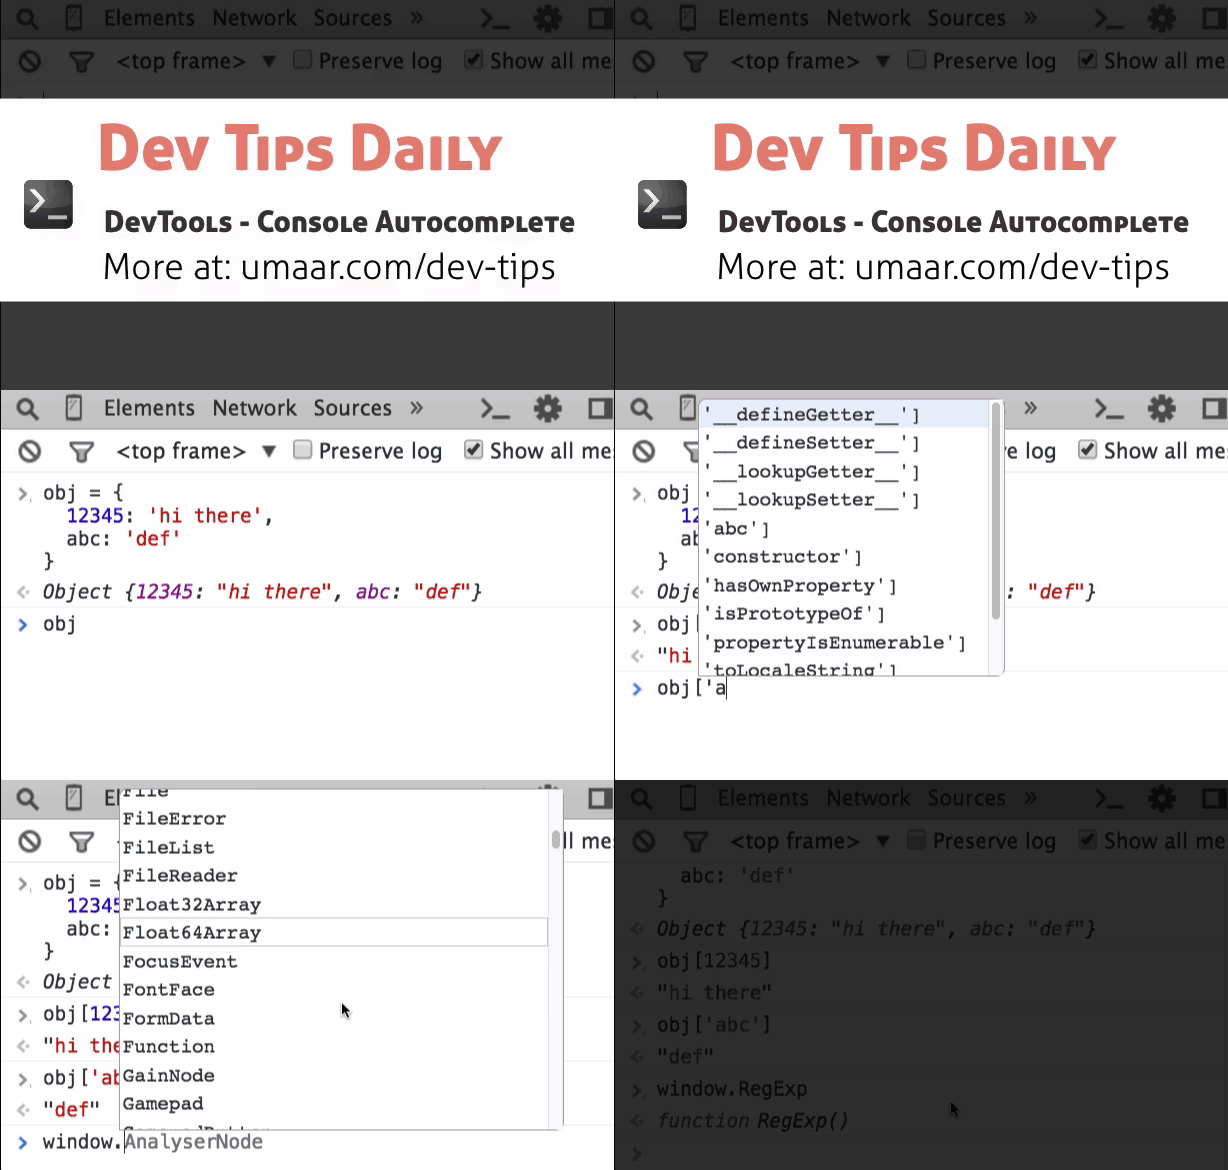

31. Viewing and debugging event handlers
Use the function
getEventListeners(node)in the console to get all registered event handlers for the passed DOM element. In addition, there is a design debug(fn)that stops the execution of the program at the time of the call of the transferred function.View screencast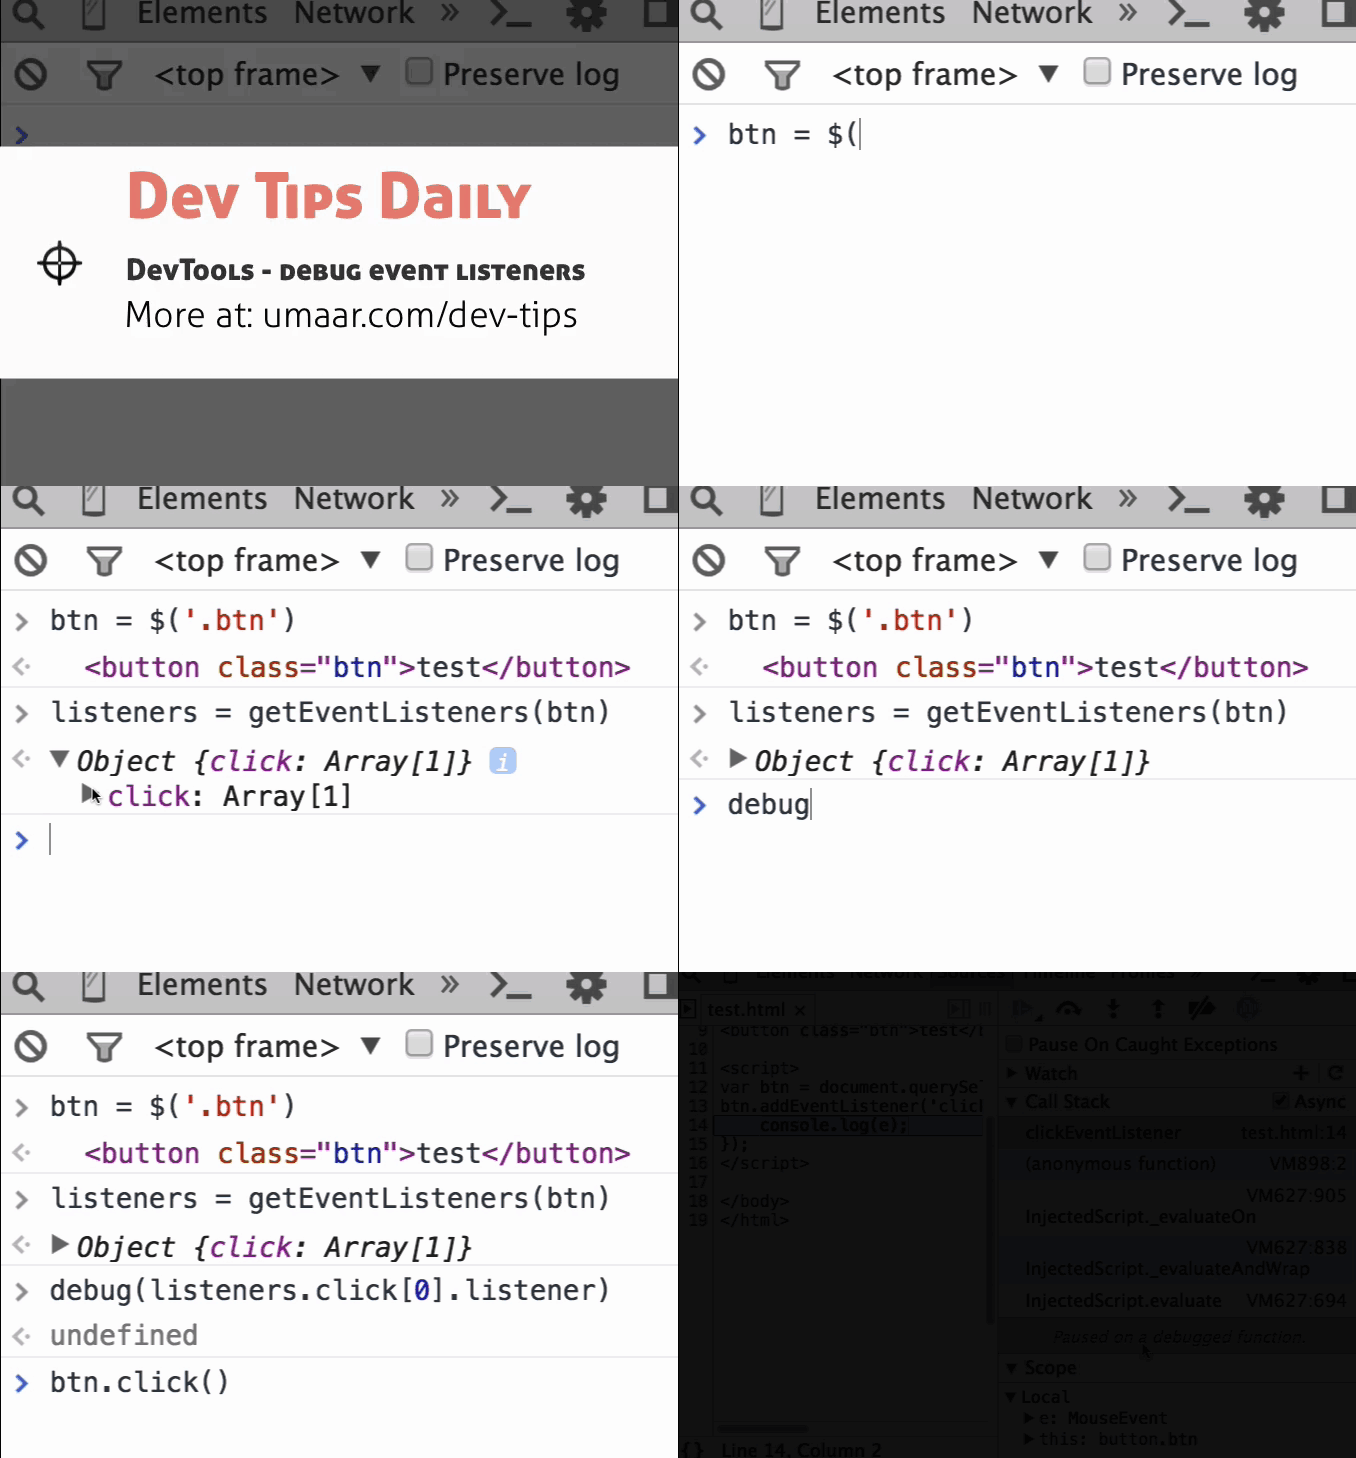

32. Automatically stop program execution when any exceptions occur
You can stop the thread of execution when an exception occurs that is not handled by your code. To do this, enable the "Pause on exceptions" option in the "Sources" panel. In addition, you can catch all processed exceptions by checking the "Pause on caught exceptions" checkbox.
When using this functionality, you will be able to identify a problem in the code before the actual occurrence of the error.
View screencast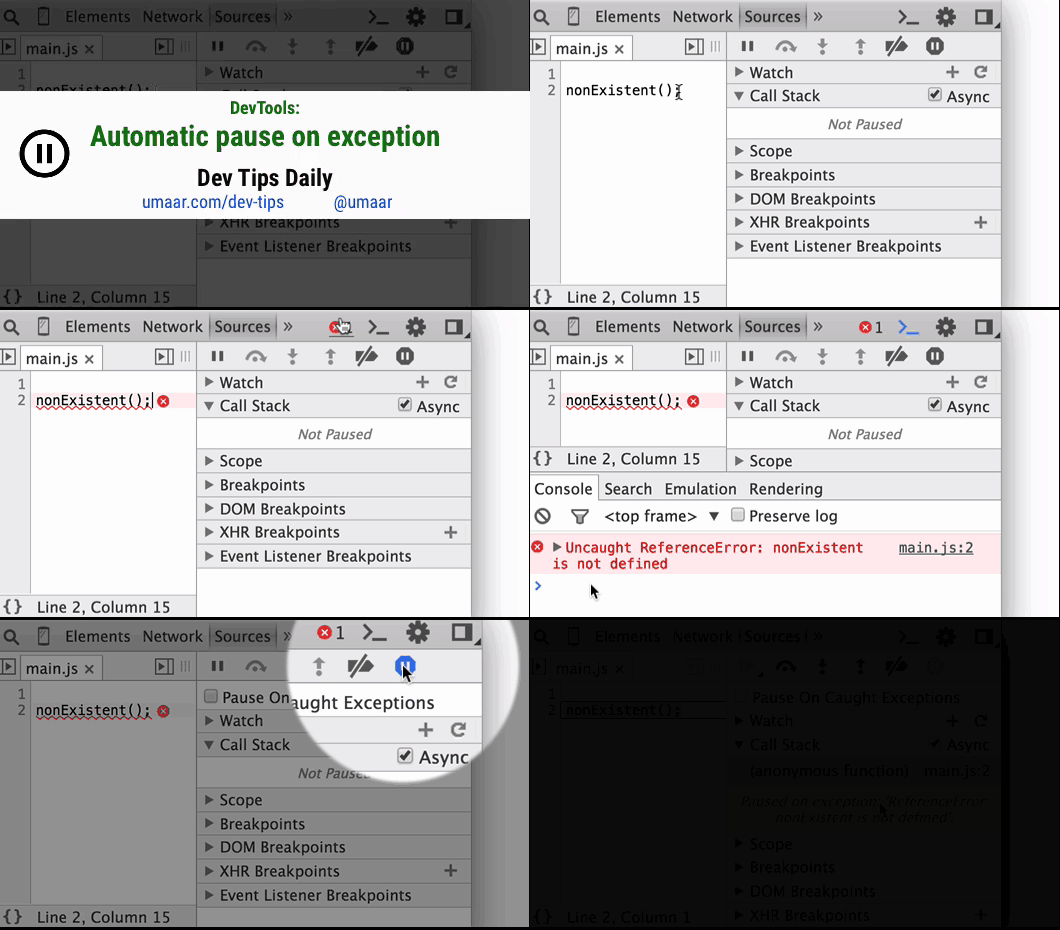

Further more. Stay tuned!
