Visualization of static and dynamic networks on R, part 3
- Transfer
- Tutorial
In the first part :
In the second part : colors and fonts in the graphs of R.
In this part: the parameters of graphs, vertices and edges.
Building with igraph: network graphics have an extensive set of settings. In particular, there are vertex settings (starting with
Parameters of builds in igraph (among others):
Settings for vertices and edges can be set in two ways. The first is to set them using the function
Another way to set attributes is to add them to the igraph object. Let's say we want the color of the network vertices to depend on the media, and the size on the degree of centrality (more links - more top). We will also change the width of the ribs depending on their weight.
You can also override attributes directly in the chart:
It is useful to add a legend explaining the meaning of the colors used:
Sometimes, especially in semantic networks, you only need to display vertex labels:
Let's color the edges of the graph in the colors of the vertices from which they come. You can find the source vertex of each edge using the function
- network visualization: why? how?
- visualization options
- best practices - aesthetics and performance
- data formats and preparation
- description of the data sets used in the examples
- getting started with igraph
In the second part : colors and fonts in the graphs of R.
In this part: the parameters of graphs, vertices and edges.
Networking
Building with igraph: network graphics have an extensive set of settings. In particular, there are vertex settings (starting with
vertex.) and edge settings (starting with edge.). A list of some settings is given below, and more information can be obtained by running the command ?igraph.plotting. Parameters of builds in igraph (among others):
Tops
| vertex.color | vertex color |
| vertex.frame.color | vertex outline color |
| vertex.shape | vertex designation form, one of the values “none”, “circle”, “square”, “csquare”, “rectangle”, “crectangle”, “vrectangle”, “pie”, “raster”, “sphere” |
| vertex.size | vertex size (default 15) |
| vertex.size2 | second vertex size parameter (for example, for a rectangle) |
| vertex.label | character vector to indicate vertices |
| vertex.label.family | font family for vertex labels (for example, Times, Helvetica) |
| vertex.label.font | font: 1 - regular, 2 - bold, 3 - italics, 4 - bold italics, 5 - character |
| vertex.label.cex | font size (multiplier, device dependent) |
| vertex.label.dist | distance between label and vertex |
| vertex.label.degree | label location with respect to the vertex: 0 - on the right, "pi" - on the left, "pi / 2" - on the bottom, "-pi / 2" - on the top |
Ribs
| edge.color | rib color |
| edge.width | rib width, default 1 |
| edge.arrow.size | arrow size, default 1 |
| edge.arrow.width | arrow width, default 1 |
| edge.lty | line type, can be 0 or blank (no), 1 or solid (solid), 2 or dashed (broken), 3 or dotted (dotted), 4 or dotdash (dot-dash) ), 5 or “longdash” (long dash), 6 or “twodash” (double dash) |
| edge.label | character vector to indicate edges |
| edge.label.family | font family for edge labels (for example, Times, Helvetica) |
| edge.label.font | font: 1 - regular, 2 - bold, 3 - italics, 4 - bold italics, 5 - character |
| edge.label.cex | edge label font size |
| edge.curved | rib bending, in the range from 0 to 1 (FALSE sets to 0, TRUE - to 0.5) |
| arrow.mode | a vector that determines whether the edges should have arrows, possible values: 0 - no arrow, 1 - reverse, 2 - straight, 3 - in both directions |
Other
| margin | empty borders around the graph, length vector 4 |
| frame | if TRUE, the chart will be framed |
| main | if set, adds a title to the chart |
| sub | if set, adds a subtitle to the schedule |
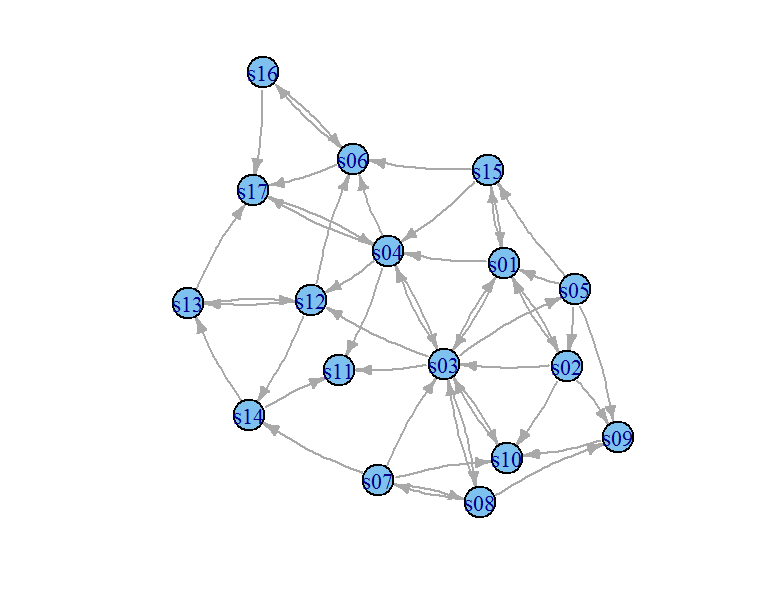
Settings for vertices and edges can be set in two ways. The first is to set them using the function
plot()as shown below.# Построить с изогнутыми ребрами (edge.curved=.1) и уменьшить размер стрелок:
plot(net, edge.arrow.size=.4, edge.curved=.1)
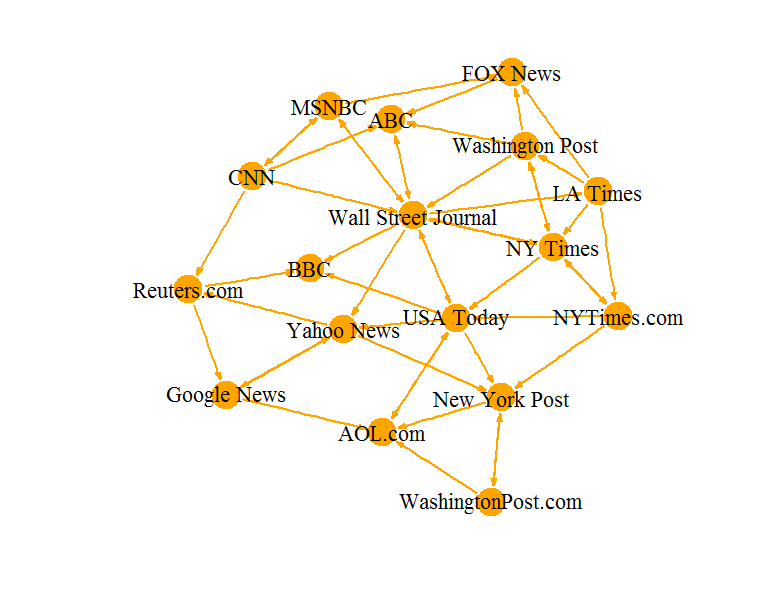
# Установить оранжевый цвет для вершин и ребер
# Заменить метки вершин на названия, хранящиеся в "media"
plot(net, edge.arrow.size=.2, edge.color="orange",
     vertex.color="orange", vertex.frame.color="#ffffff",
     vertex.label=V(net)$media, vertex.label.color="black")
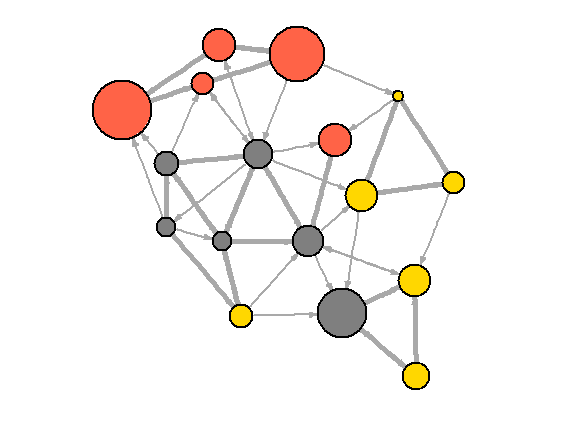
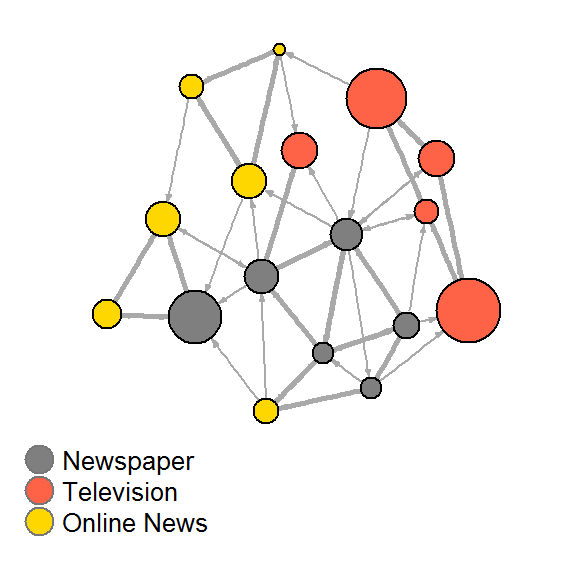
Another way to set attributes is to add them to the igraph object. Let's say we want the color of the network vertices to depend on the media, and the size on the degree of centrality (more links - more top). We will also change the width of the ribs depending on their weight.
# Задать цвета в зависимости от средства массовой информации:
colrs <- c("gray50", "tomato", "gold")
V(net)$color <- colrs[V(net)$media.type]
# Рассчитать степени вершин (количество связей) и использовать их для задания размера вершины:
deg <- degree(net, mode="all")
V(net)$size <- deg*3
# Также можно использовать объем целевой аудитории:
V(net)$size <- V(net)$audience.size*0.6
# Сейчас метки - идентификаторы вершин.
# Можно установить их в NA, чтобы они исчезли:
V(net)$label <- NA
# Установить ширину ребра на основании веса:
E(net)$width <- E(net)$weight/6
# Изменить размер стрелки и цвет ребра:
E(net)$arrow.size <- .2
E(net)$edge.color <- "gray80"
E(net)$width <- 1+E(net)$weight/12
plot(net)
You can also override attributes directly in the chart:
plot(net, edge.color="orange", vertex.color="gray50")
It is useful to add a legend explaining the meaning of the colors used:
plot(net)
legend(x=-1.5, y=-1.1, c("Newspaper","Television", "Online News"), pch=21,
       col="#777777", pt.bg=colrs, pt.cex=2, cex=.8, bty="n", ncol=1)
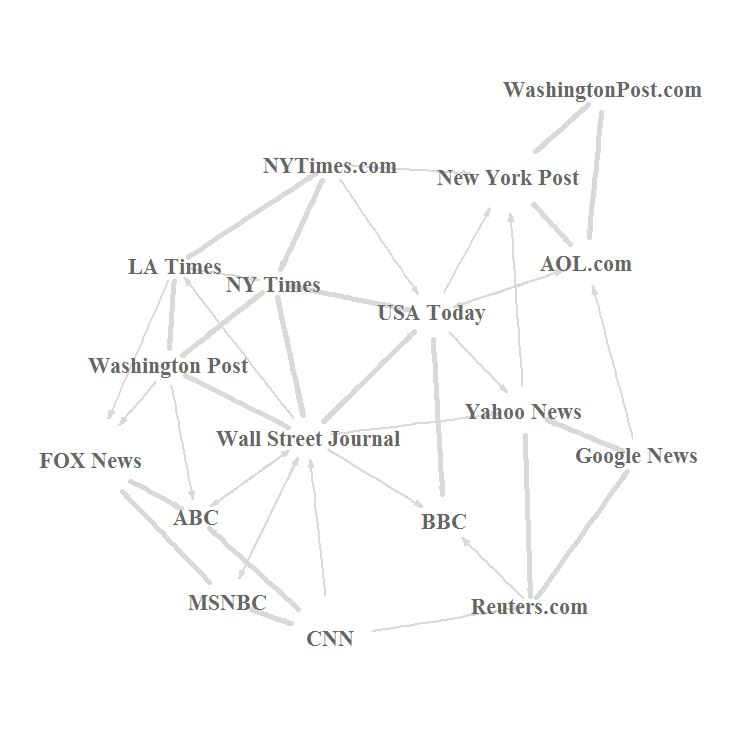
Sometimes, especially in semantic networks, you only need to display vertex labels:
plot(net, vertex.shape="none", vertex.label=V(net)$media,
     vertex.label.font=2, vertex.label.color="gray40",
     vertex.label.cex=.7, edge.color="gray85")
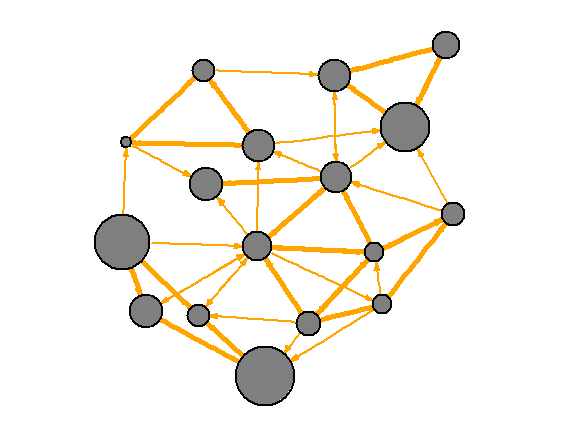
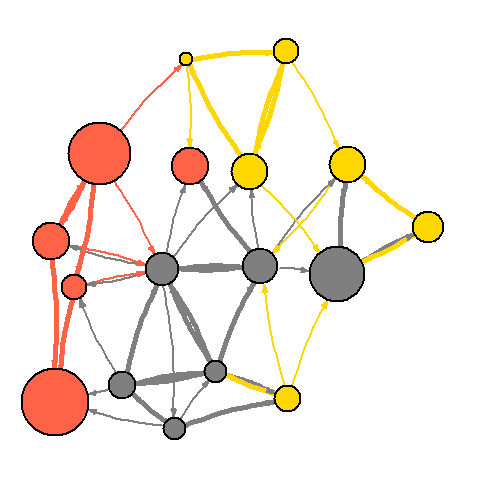
Let's color the edges of the graph in the colors of the vertices from which they come. You can find the source vertex of each edge using the function
get.edgesfrom igraph.edge.start <- get.edges(net, 1:ecount(net))[,1]
edge.col <- V(net)$color[edge.start]
plot(net, edge.color=edge.col, edge.curved=.1)