# Analysis of the New Monitoring Mode in the Cross-Platform Modbus Terminal CoreBus
CoreBus tool version 3.4.0 adds a continuous register polling mode, data type conversion, and real-time telemetry visualization. We break down the feature architecture, methods for working with 16-bit registers, and integration options for debugging industrial equipment and embedded systems.
Architecture of Interaction with the Modbus Protocol
The terminal's versatility comes from its modular structure, which separates low-level data transmission from high-level protocol interpretation. At its core is support for three independent operational loops, each tailored to specific development and diagnostics scenarios.
The protocol-agnostic mode works as a raw terminal. It handles strings and byte sequences, supports multiple encodings, and lets you flexibly configure sending strategies: single packets, cyclic transmission, or streaming from a file. This loop is essential for reverse-engineering proprietary protocols, manually crafting frames, and reproducing specific controller-side bugs.
The standard Modbus mode implements the classic request-response model. It supports TCP, RTU, and ASCII transports, plus RTU/ASCII encapsulation over TCP. The tool includes a built-in bus scanner to detect active Slave devices, properly handles write functions, and provides seamless handling of binary data and floating-point numbers. This cuts down on time for initial communication setup and address space validation.
Mechanics of Continuous Polling and Register Mapping
The headline update in version 3.4.0 is the monitoring mode, designed for passive observation of register states without manually triggering each request. The workspace splits into a polling cycle control panel and a table of active registers. Users set the polling interval to balance data freshness against bus load, avoiding collisions in dense device setups.
Each table row represents one 16-bit Modbus register. Addressing works in decimal or hexadecimal formats. Visual indicators highlight cells on value changes, making it easy to track dynamic processes. Left-side checkboxes enable batch deletion or logical grouping of registers for analyzing complex telemetry chains.
The "Value" column shows raw data straight from the device. For engineering analysis, that's not enough, so there's a typing layer. Since base Modbus registers are 16 bits, handling 32-bit types (Int32, Float32) automatically grabs adjacent registers. The terminal concatenates pairs correctly, respecting byte order, and delivers normalized numeric values to the developer.
Data Transformation and Computational Layer
Raw or typed data often needs scaling for business logic or visualization. The monitoring mode has a built-in math expression parser, accessed via the formulas interface. Users define algebraic transformations using variable x for the current register value. For instance, applying 0.5*x or an offset instantly converts engineering units without external scripts.
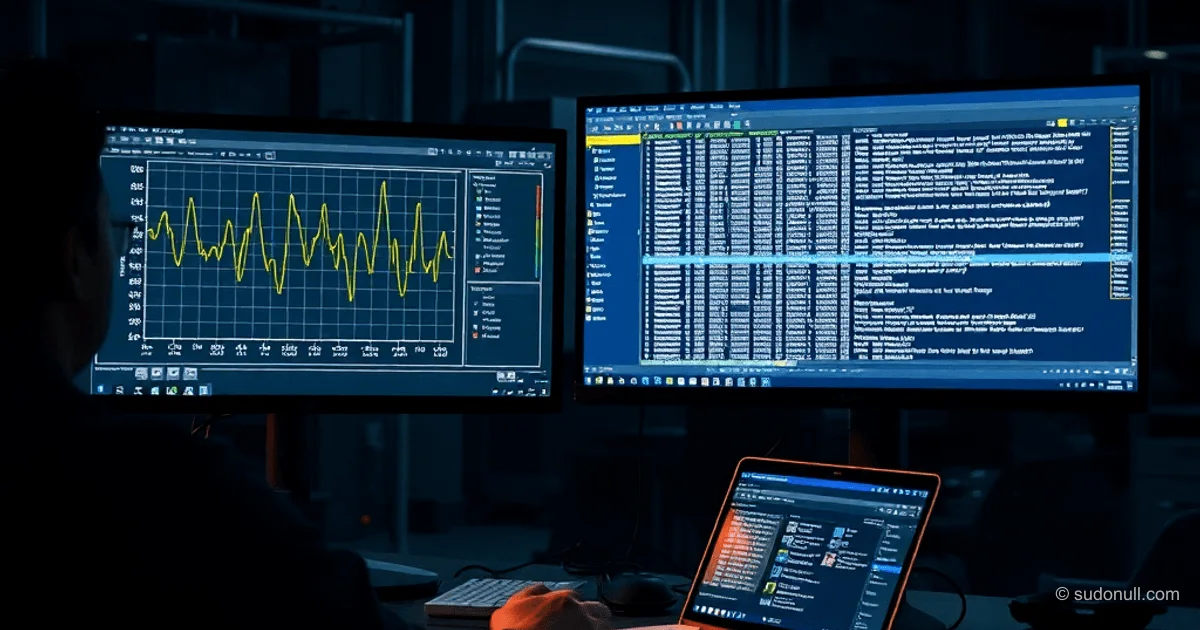
Transformed values feed into two independent outputs: real-time graphs and file logging. Graphs build dynamically, adapting to incoming data points. This skips CSV exports to third-party tools during quick diagnostics. The logger captures timestamps and values in a structured format ideal for post-processing and equipment state audits.
Telemetry Visualization and Scenario Automation
For complex initialization or multi-device control, the terminal offers a macro system. Macros are unlimited command sequences tied to specific modes. In Modbus, you can fix a single Slave ID across the chain to prevent addressing errors in bulk ops. Import/export support lets you version test scenarios and share them with the team.
Cross-platform support (Windows, Linux) and portable builds make deployment easy in air-gapped industrial networks and test rigs. User presets, theme switching, and built-in docs lower the barrier for newcomers while keeping deep customization for seasoned SCADA engineers and embedded developers.
Key Takeaways
- Monitoring mode handles periodic polling of 16-bit registers with automatic pairing for 32-bit data types.
- Built-in formula parser applies math transformations to telemetry without external scripts.
- Dynamic graphing and background logging run in parallel for a complete diagnostics workflow.
- Macro system supports unlimited command chains with fixed Slave ID and portable configs.
- TCP, RTU, ASCII, and raw mode support covers everything from reverse engineering to production bus ops.
— Editorial Team










No comments yet.