MiniBTH Portable Travel Weather Station
Good afternoon. In this publication, I will talk about a portable field weather station, which I had long conceived and recently implemented in hardware.

I often go to nature, both on long hikes and short weekend trips. Instrumental observation, on the one hand, will simply satisfy curiosity by answering the question “Is it warmer today than yesterday?” Or “How cold was the night?”, On the other hand, the presence of even primitive weather information can help predict better or worse weather or fog . Hence the desire to create an autonomous device for measuring, logging and displaying meteorological information suitable for camping use and satisfying the following requirements:
It is worth noting that devices of this purpose in the form of watches, remote controls and individual devices are available on the market, however, in my opinion, their ability to display the history of changes in weather information is insufficient, and logging is usually absent altogether. Therefore, I decided to develop my own device.
At the initial stage of design, you need to decide on the choice of the many available parts, components and technologies, and find the optimal combination. Consider the main components of the future device and the reasons for choosing certain solutions.
For the proposed device, a color screen, in my opinion, is preferable, since it is convenient to display several graphs on the color screen on the same coordinate grid, while on a monochrome screen such a picture will be difficult to perceive. Given the requirements of visibility in the sun, continuous display, and moderate power consumption, the choice clearly falls on the transflective TFT display. The main problem here is to get an affordable display. A quick search showed that the transflective screens declared in online stores are not available, the options available on alibaba have an uncomfortable RGB interface, and the only available option is the screen from the good old Siemens CX / M / S65 phone. Of course, it’s not very good to rely on a component with disassembly, but for a small-scale DIY project it will do. The advantages here include the fact that the screen is controlled by SPI (it will be easier to breed the board). Although the screen is from a phone, information is available on how to manage this screen fromCristian Kranz (at the time of writing, Christian’s website has been around for six months now).
To begin with, it is worth deciding on a set of measurable parameters and sensors for them. Three unconditionally required parameters are pressure, temperature, and humidity. You can also add a light sensor.
Now we define the criteria for choosing sensors. The sensors should be small in size, accurate and, if possible, not require complication of the device circuit in view of the specific sensor strapping. Ideally, all sensors are digital and operate on the same voltage. It is also desirable that the pressure and humidity sensors, which have direct contact with the atmosphere, be protected from dirt and dust.
Pressure meter.From experience with quadrocopters, I came across BPM085 and MS5611 sensors, both with an I2C interface, and built-in thermal compensation. Of these, the second turned out to be more accurate and stable, with a little averaging it allows 1Pa of pressure, which corresponds to about 10 cm of height. I initially chose it for the device, and a little later I decided to use a protected version of this sensor, called the MS5803.
Humidity sensor. There are many options, both analog and digital. I liked sensiron's I2C family of SHT2x sensors. Small, accurate, operates in the same voltage range as the pressure sensor (1.8V-3.6V), and measures not only humidity, but also temperature. In addition, an anti-dust cap is issued to it.
Temperature sensor.Two of the above sensors already measure the temperature, a separate sensor is not needed.
Light sensor.Here it is advisable to put a sensor with a very wide range of measurements. To measure from illumination by the direct sun (100 thousand lux) and down to deep twilight and moonlit night (0.2 lux), or even less. Moreover, the sensor is desirable with factory calibration, because I have nothing to calibrate. There are options with photodiodes, but require additional strapping, although they can potentially have a large measurement range. Therefore, my attention was drawn to the series of integrated I2C max4400x sensors. There are several similar sensors in the series, some multispectral, some have an IR emitter and can work as a proximity sensor. My requirements for the measuring range are met by one, max44009. However, it is possible to install two sensors, monochrome max44009 for high light, and RGB sensor max44008 for small. And the use of a dimming filter can expand the operating range of max44008 to the required 100 thousand. Suite We will choose the simple option with max44009 as the main one, and consider max44008 as a possible addition.
Given that the screen and all sensors work from 3-3.3 volts, and SD cards work from 3.3v. it is advisable to use a processor that runs from 3-3.3v. I chose my usual AVR. Note that the choice of AVR allows you to use the Arduino IDE to build the project and use libraries for Arduino. In this project, the use of the library for working with the SD card is especially relevant. Although, in principle, Arduin libraries can be used in projects assembled in AVR Studio, this requires some tricks. Looking ahead, I’ll say that the only plus point from using Arduino was uploading the program via UART.
According to initial estimates, 32kB of ROM and 2kB of RAM (about 600bytes for working with SD, and almost everything else is the measurement history) is quite enough for the project, and therefore I chose the ATmega328p processor. A voltage of 3V dictates a clock frequency of no higher than 8 MHz. The project I started writing under the Arduino IDE. When assembling for this processor, the voltage just selects the target Arduino Pro mini 3.3v. Since real-time clocks are needed to realize all the functions of the device, and RF quartzes as a rule do not provide sufficient frequency stability, you must either use a clock quartz with a processor (in view of the features, ATmega328p will be clocked from the RC oscillator) or use a separate real-time clock chip . In view of the latter circumstance, I decided to use a separate I2C chip with a DS1337 calendar clock. An additional argument in favor of a separate chip with RTC was the possibility of implementing a battery change without losing the clock settings. However, subsequently, the option of built-in batteries of the device was chosen.
Although the instrument interface is planned to be simple, buttons are still needed for switching display modes, setting the time and adjusting for height. Since it is difficult to hide the mechanical buttons in the pressurized enclosure (for this you need to make holes in the case and put a flexible seal in them tightly, or enter the pusher through the seal), it was decided to make capacitive touch control buttons. With a touch pad area of about 1 sq. Cm, a wall thickness of 2-3 mm with a dielectric constant of about 2-4 (typical for plastics), it is necessary to make a device that reliably records the change in capacitance by a fraction of picofarads. This problem has several solutions. The first option is to put a specialized chip - a touch controller. The second is to make touch buttons on pairs of processor legs, simply by measuring the charging time of the input capacitance of the input line with the pad through the megaohm resistor from the output line. The method is described on several resources, there are corresponding libraries. However, since I want to create a sensitive and noise-free sensor, I chose the third option - a sensor with a phase detector. The idea is simple. Two RF signals are applied to the input of the phase detector. One directly from the source, and the second through the RC circuit, in which the sensor pad is used as the capacitance (and, of course, the stray capacitance of the input of the phase detector, too). The signal from the output of the phase detector is averaged and measured using the ADC. Such a circuit will be much less sensitive to external interference, at least at frequencies other than the frequency of the probe signal. As the source of the RF signal, you can take just the processor clock signal. For greater noise immunity, you can still introduce phase-code modulation of this signal, however, judging by the operating experience, this is an excess.
One of the most difficult questions for DIY projects is creating a sealed enclosure. Moreover, the housing design is largely determined by the available technological base. The only easily accessible pressurization tool for me is the 3-axis CNC milling machine, suitable for milling plastics, wood and soft metals. It turns out that the body must be assembled from milled parts made of plastic and aluminum. The question remains of the choice of gaskets. Special sealing gum, and even the required length, could not be found, but tape recorders can be used as sealing seals. This technology has already been tested previously in other buildings. As a result, the housing will consist of a central unit with grooves for seals, and front and rear plastic covers fixed by clamping frames. The question remains of the choice of materials. The central unit should be made of capralon. In this plastic, you can reliably cut threads, as in metal, it is not fragile and wear-resistant. The front cover should be transparent, and preferably not fragile. Of the available options for transparent plastics, I chose polycarbonate. The disadvantages of this material include not very high transparency compared to polymethyl methacrylate. But it is ductile and not susceptible to cracking. There are no transparency requirements for the back wall, in the end I settled on a version of fiberglass. The clamping frames must have sufficient rigidity to crush the elastic along the entire length. In addition, it will be they who account for the majority of possible hitting the body against surrounding objects. Therefore, it was decided to make them from aluminum alloy.
The temperature and humidity pressure sensors must communicate with the atmosphere and have good thermal contact with it. In addition, they should be relatively insulated from the housing to reduce the reaction time to temperature changes. At the same time, it is advisable to place them so as to protect against possible shock and dirt. Therefore, the layout of sensors on a T-shaped protrusion in the recess of the case looks promising.
The light sensor will be placed behind the transparent front panel, near the screen. The influence of wall transparency can be taken into account by calibrating the sensitivity of the sensor.
There is little choice, either lithium-ion batteries or metal hydride batteries. Metal hydrides work a little better at low temperatures, and this is where the benefits end. In terms of energy intensity, lithium is more profitable. As a result, I chose lithium-ion, although this choice was made at a fairly late stage of the project. For myself, I have identified such requirements for battery life:
Based on these requirements, the battery capacity will be determined.
According to the solutions described above, a device circuit was developed.
The 78HC03 chip stabilizes the supply voltage for the controller and sensors. On chips 74AC00 and 74AC86 built controller touch buttons. The first is designed to turn on / off the supply of 8 MHz signal to the sensor plates, the second contains 3 phase detectors. The voltage converter for the backlight is made on a DC / DC converter chip with a PWM control LM2733x and is powered by batteries, bypassing the stabilizer, the OS is made according to the current of the LEDs. The operating voltage at the output is about 12V (in the backlight of the screen there are 4 LEDs connected in series). To protect the controller in case of removing the screen from the board, a 15V zener diode works as a protective load. The backlight current is set by the resistor R9, the voltage drop at which is 1.25V. The max1879 controller controls battery power, To measure the charge current, the TS321 operational amplifier with strapping is used. The real-time clock is made on the DS1337 chip. When developing the circuit and the board, it was possible to install a backup battery for the watch. However, when using non-removable batteries, a battery is not needed.
The implementation of wireless charging was one of the most underestimated by the complexity of the tasks in this device. For reasons of convenience, the layout of parts in the case, I chose the W - shaped core Sh7x7. A larger core would lead to an increase in the already small body, although the larger the better, so that the two halves with a 1.5 mm gap (thickness of the back wall) dissipate the flow as little as possible. However, even with such a core size and a thickness of the flux scattering gap, it is essential, therefore, the resonance phenomenon had to be used for more efficient energy transfer. Note that a detachable transformer can operate in several modes:
a) The device lies on a charging cradle, the battery is charging, the transformer is loaded with a load with a steep I – V characteristic.
b) The device lies on the charging cradle, the battery is charged or is charging in PWM mode, the transformer is not loaded.
c) The device is removed from the charging cradle, but the primary winding of the transformer is connected to its power source.
d) The intermediate position of the transformer parts, briefly at the time of installation and removal of the device.
It is necessary that the charger can work in all four states without overheating of the windings and overloading of keys. There are two options - either to make a complex driver with automatic frequency adjustment and shutdown in the absence of load, or selection of element parameters. It is impractical to make a resonant circuit from the secondary winding, since in state b) when the transformer is not loaded, a large voltage will appear on the secondary winding, which can easily exceed the maximum allowable open-circuit voltage for max1879 and the key. Therefore, we will manage the resonance only in the primary winding circuit. I managed to achieve good charging parameters using a very simple power scheme.
The primary winding is connected to an AC voltage source consisting of an IR2153 driver generator and two keys powered by 12V. In series with the primary winding, the capacitor C7 is turned on, they form an oscillatory circuit. In parallel with the primary winding, a neon lamp (in my case a pair of on-series lamps) with an ignition voltage of about 160V is turned on to protect against overloads. The generator frequency (about 100 kHz) is set by the tuning resistor R1 and is set so that in mode a) the circuit works very close to resonance. In this case, the amplitude value of the voltage on the primary winding reaches 100-110V, and the average current of the secondary winding (battery charge current is about 600mA). In mode b), when the load is disconnected, the circuit leaves resonance (the resonant frequency of the circuit with an unloaded secondary winding is lower than the generator frequency), the voltage on the primary winding drops below 60V, and accordingly the useless losses in the ferrite also fall, and the amplitude value of the secondary winding voltage does not exceed 14V. In mode c) the inductance of the "half" of the transformer is less, the resonant frequency of the circuit is higher than the frequency of the generator, the voltage on the primary winding drops, and the losses in ferrite are small. In mode d), an unloaded primary circuit may fall into resonance, and for this, a neon lamp is used as a “protective” load. The primary winding (in the charger) contains 32 turns of PEV-1 0.6 wire and the secondary winding (in the device) 32 turns of PEV-1 0.3. It is worth noting that the quality factor of the circuit and, accordingly, maximum power transferred to the load is limited by losses in ferrite. Parallel to the secondary winding, 15v p6ke15ca suppressors are connected to protect the charge circuit from voltage surges. With the selected circuit parameters in the operating modes, the suppressors are not heated.
For Arduino there are many libraries for working with sensors, and other peripherals, however, many of them are inconvenient and cumbersome. In the process of development, I came to the conclusion that other people's small libraries should be used to a minimum, implementing simple functionality on their own. This saves some controller resources and the amount of ROM used, although it slows down development. The native Arduino libraries were cumbersome and inconvenient. As a result, the only third-party library used on the project was SdFatLib by William Greiman. The module for working with i2c sensors sht21 and max44009 and RTC was written from scratch, work with ms5611 / 5803 was borrowed from the multiwii project and finalized. The x65 by Christian Kranz screen module was redesigned to fit the needs of a particular project. There are 3 types of screens in siemens x65 with different controllers: Epson L2F50, Sharp LS020, and Hitcah LPH88. I managed to get only the first two samples, so while my project supports only two types of display controllers. The specific type is set in the configs. It is also worth noting that the device requires a non-standard FUSES configuration for Arduino - turning on the CLKO line and setting the brownout detector to 2.7 volts.
There were no particular difficulties with polling the sensors, they (and the clock too) are interrogated continuously in the main cycle of the program, the duration of the main cycle is approximately equal to about 180ms. It is worth noting one feature of the sensors MS5611 / 5803. Their testimony sometimes “freezes” after several thousand measurements. This feature was noticed by me when debugging multiwii, and here I ran into it again. The way out of the situation is trivial: every 256 polls I just reset the sensor, and there are no more problems with fading. The last figures in the pressure sensor readings constantly fluctuate within 3-4Pa (resolution of the sensor is 1Pa), but averaging the results of the last 16 measurements allows you to completely remove fluctuations. And this is not all the features of the MS5611, it still turned out to be photosensitive, which required the installation of a light-protective cap.
The question of what the information displayed on the screen should look like at first seemed difficult. But at the initial stage of development, a simple mapping principle was laid down, and then it only improved. The principle is simple - the device has two display modes. The first shows a graph with meteorological information, and the main data read from the sensors in digital form.

In the second mode, all information about the current state of the device and sensors is displayed on the screen: voltage and current of battery charge, temperature from two sensors, humidity, pressure, calculated values of dew point and barometric height, pressure of the zero elevation mark, illumination, time, date. Also in it is available to set the clock and pressure at the zero mark of the altimeter. With a screen size of 132x176 pixels, the size of the graph was made 96x100, while there was still room for signing scales with a font of the smallest possible size, and for placing 4 hours of current information in 8x14 font. The temperature curve aligns to the bottom of the coordinate system, the pressure curve to the top. The scale along the ordinate axes is automatically adjusted to the displayed data. Humidity is displayed by proportionally filling the background of the graph with a light blue color. The position of the labels and grid lines of the ordinate axis is constant; only label labels change. The grid and labels along the x-axis move with time, along with the graph. An important issue is the choice of the available abscissa axis scales. Given the available RAM volumes, it was decided to stop at two scales - fast 2min / pixel (data for the last 3 hours and 10 minutes is displayed), and slow 30min / pixel (data for the last 48 hours is displayed). In slow mode, averaged data is displayed over a half-hour interval. In the mode, the current data is stored every two minutes at 0 seconds. This is done in order to remove the visible "lag" of data on a quick chart relative to the current. For each graph display mode, 96 readings of pressure, humidity and temperature are stored. Moving according to the schedule back in time is not provided.
To interrogate the touch buttons, periodically (once per main cycle) they receive a test RF signal (8 MHz from the CLKO output of the processor) for 5 ms, after which the signal values at the outputs of the phase detectors are read. The ADC has 10 bits, the output values vary from 0 to 1023. For selected R1-R3 values, free sensor plates of 8x10 mm are characterized by 500-700 values, when a finger is brought up to the plate located behind a 1.5 mm thick PCB layer, the values change by 70-150 counts up. On the one hand, this indicates a large input capacitance of the 74AC86 logic elements, on the other hand, a signal change is more than enough to reliably determine the touch and adjust the response threshold, even if the dielectric thickness is increased to 2-3 mm. To determine the logical state of the touch buttons, the current read value is compared with the average value for the last few readings. If their difference exceeds the threshold, the state of the sensor is fixed as “pressed”. If the difference falls below the vacation threshold, the state is fixed as "released". Thresholds for each sensor are set separately, this makes it easy to make sensors sensitive enough to avoid false positives. The adaptive comparison circuit guarantees the reliable operation of the touch buttons under varying temperatures and possible contamination of the case. Thresholds for each sensor are set separately, this makes it easy to make sensors sensitive enough to avoid false positives. The adaptive comparison circuit guarantees the reliable operation of the touch buttons under varying temperatures and possible contamination of the case. Thresholds for each sensor are set separately, this makes it easy to make sensors sensitive enough to avoid false positives. The adaptive comparison circuit guarantees the reliable operation of the touch buttons under varying temperatures and possible contamination of the case.
The buttons are designed to perform routine actions to switch modes, as well as critical actions, such as setting the clock. To activate critical actions, you need to select a special “initiating” combination of buttons, which is difficult to press by accident. Since the buttons are arranged in a row, a natural option for such a combination is to hold the extreme with the average released. In this case, the remaining actions are performed by pressing and holding one button. When a pair of adjacent buttons is pressed, their action is blocked until both of them are released. The trigger combination is also used to turn on the backlight. Moreover, if the illumination is less than the threshold of 100lux, the initiating combination always turns on the backlight. Further, depending on the display mode, pressing this combination again either turns off the backlight or turns on the clock setting mode. To confirm the entered time and date, press the initiating combination again. For convenience, the search buttons in the dark on the top cover made special tabs.
After writing the main part of the measurement program, it was shown that on average when the backlight is off, the device consumes a current of about 7.5mA, of which about 3mA consumes a display. The rest of the consumption falls mainly on the processor, on the controller of the touch buttons, microSD card, and a little on the sensors. Energy consumption can be slightly reduced if, in “free” time, the processor is driven into energy saving mode and the frequency of polling sensors and updating information is reduced. However, it will not be possible to significantly reduce it; almost half consumes a constantly-on display. To further reduce power consumption, the standard Arduin library for working with ADCs was modified so that during the measurement of the ADC, the processor switches to ADC Noise reduction mode (see the myadc module). At the same time, the accuracy of the ADC is slightly increased, but, most importantly, processor power consumption is greatly reduced during measurements. To significantly save, simple delays in the main loop are replaced by multiple measurements of the charge current. This allowed to reduce the current consumption to 6mA. It should be noted that the use of more economical sleep modes could reduce power consumption a little more, up to about 5.5mA, however, this decrease is not very significant, and requires external signal sources to wake up the processor, which were not originally provided. At the same time, there is still a noticeable reserve for reducing power consumption up to 3.5mA due to a noticeable decrease in the frequency of polling sensors and the rate of redrawing the screen. However, such changes were not made for the sake of a constant operational indication. Separately, it is worth noting that the power consumption of the device depends on the SD card used,
At the initial stage of development, it became clear that the housing will consist of two main volumes of a sealed compartment with an electronic part, and a ventilated recess for accommodating sensors. The sensors are small and their layout does not cause problems. The main board is more complicated. It should have a screen, touch pads (under the right hand - to the right of the screen), a light sensor (above the screen). It is rational to do a deepening with sensors from above, then when the device is on a support (table, ground, stone, ...) - the sensors will be from above. And the mount for hanging the device on the neck should be made from below, then it will be more convenient to look at the screen of a backpack suspended on a strap or the neck of the device.
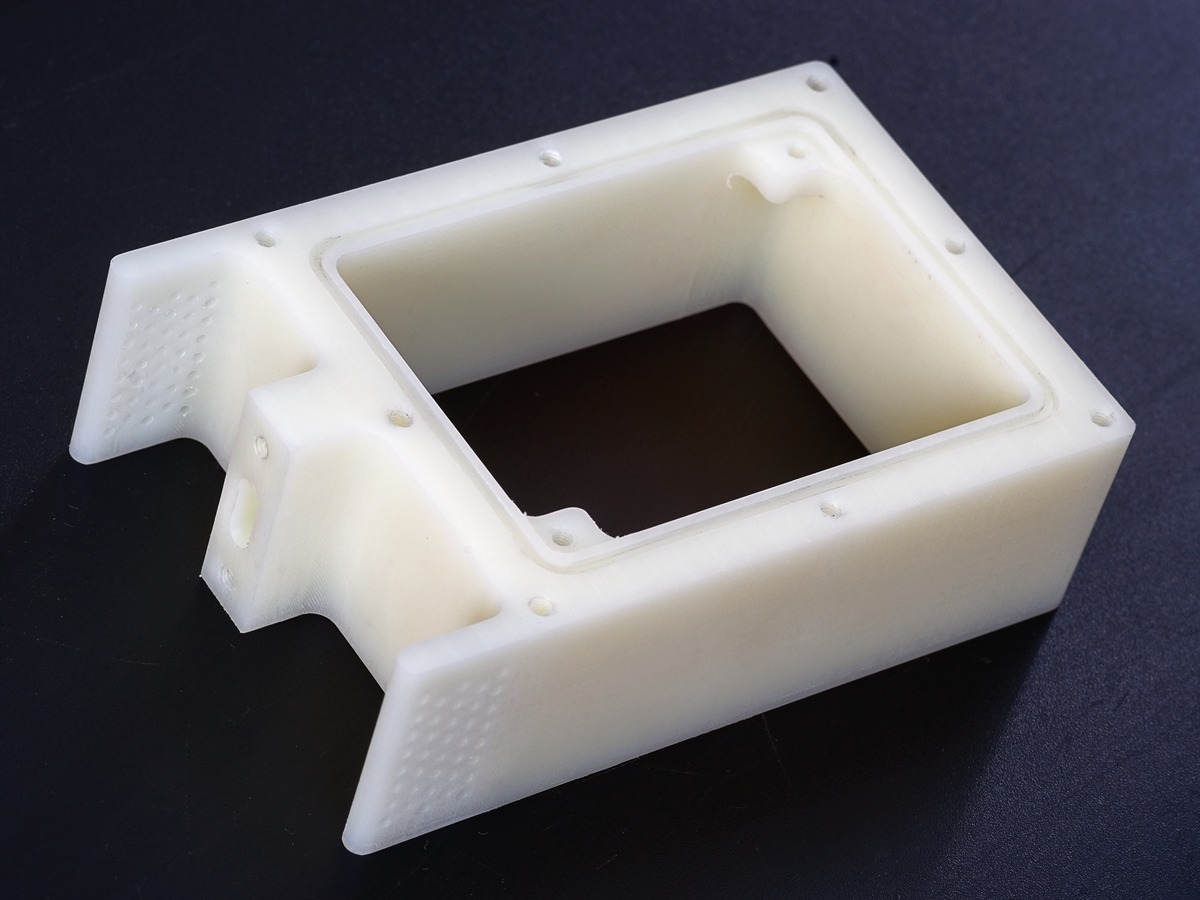
The case size will be selected based on the layout of the batteries and charging transformer. Batteries are selected based on the required operating time. With a consumption current of no more than 6mA and the above-stated operating periods, the battery capacity should be chosen about 6000mA * h. In this case, it is advisable to select the batteries in such a way that the device compartment is arranged as densely as possible. After analyzing the available batteries, I settled on the option of two NCR18650B from Panasonic. At the same time, the size of the pressurized compartment of the case and the board can be made 70x50mm. In turn, this size determines the length of the sealing gum (half-perimeter 70 + 50 + margin = 125mm) and the size of the body. Since the sealing gum from the belt is tough, you will need a lot of clamping screws. The required number of clamping screws can either be calculated by solving the problem of deformation of the gum and body by the finite element method, or determined experimentally. I chose the second option and experimentally determined that 8 screws are enough. With the size of the case, I did not save much to make a simpler form. The size of the niches containing the sensors is also made with a margin for better ventilation. As a result, the size of the central unit is 103x68mm, and the pressure frames are even larger. Next I will give a photo of the elements of the case, and by the link at the end of the article you can download the archive with the drawings of the boards, and the curves, and a description of the operations for milling the case. to make a simpler form. The size of the niches containing the sensors is also made with a margin for better ventilation. As a result, the size of the central unit is 103x68mm, and the pressure frames are even larger. Next, I will give a photo of the elements of the case, and by the link at the end of the article you can download the archive with the drawings of the boards, and the curves, and a description of the operations for milling the case. to make a simpler form. The size of the niches containing the sensors is also made with a margin for better ventilation. As a result, the size of the central unit is 103x68mm, and the pressure frames are even larger. Next, I will give a photo of the elements of the case, and by the link at the end of the article you can download the archive with the drawings of the boards, and the curves, and a description of the operations for milling the case.
The central unit is made of capralon by milling. The height of the central unit is 31mm. The dimensions of the grooves for the sealing gum were selected previously by trial and error. A test groove was milled in a soft material (a sheet of foamed PVC), an elastic was applied to it, after which corrections were made to the dimensions of the groove. Two protrusions are made inside the pressurized compartment, to which the main board of the device is attached.
The sensor unit is mounted on top with two stainless steel M3x10 screws. The tracks leading to the sensors and the place where the wires enter the housing are insulated with silicone sealant. Between the sensor board and the body, 0.5mm thick stainless steel washers are laid. These washers specify the thickness of the sealant coating the tracks at the time of pouring. The sealant also glues the SF2 cap over the humidity sensor. According to the documentation for mounting the cap and sealing the sensor, only sealants should be used, the evaporation of which does not cause permanent damage to the sensor. One of these is the DOW Conring 732 acidic silicone sealant. I used it to seal the sensor. (However, any other silicone is likely to work, but I decided to play it safe).
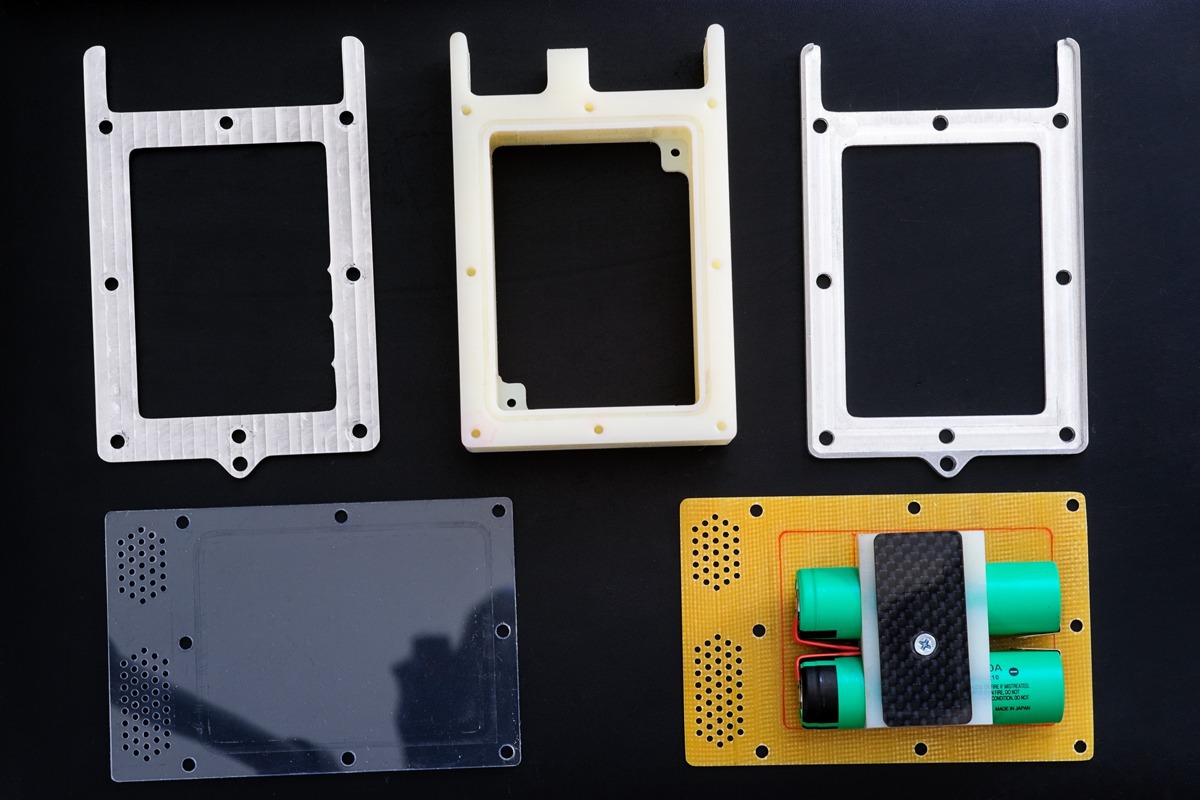
The front panel is milled from 2mm polycarbonate. The back panel is made from 1.5mm fiberglass. Pressure plates are milled from aluminum alloy (duralumin). The front plate differs from the rear in that it has protrusions that facilitate the tactile search of the sensor plates. The batteries and the charging transformer are fixed on the rear panel using two spacers milled from capralon and a carbon pressure plate. The printed circuit board is made using LUT technology, copper wires are soldered into vias.
The MS5803 sensor used is water- and dirt-resistant, however, irradiation of the sensor with bright light significantly affects the readings. Therefore, it was decided to close the sensor with a light-protective cap. The cap is made of polystyrene by solvent bonding. The inner part of the cap is made black, light-absorbing, and the outer white light-scattering, to exclude heating in the sun. The cap is glued to the sensor board with cyanoacrylic adhesive. Later it turned out that light penetrates through the sensor board and illuminates the pressure sensor from below. For this, an additional lightproof plate was installed on top of the sensor board.
A plate with touch pads is installed near the screen flush with the future cover on several layers of thick double-sided tape.

Since the housing is sealed, it is necessary to drain the remaining air inside the housing in order to avoid condensation at low temperatures. To do this, a small fabric bag filled with silica gel was placed in the case (in the photo on the bottom right on the battery).
The front and rear panels are attracted by eight stainless steel M3x12 screws. The 2mm hex cap is selected for aesthetic reasons. The weight of the complete device is 330g, overall dimensions 110x70x38mm (41mm for screw caps).
The device was tested in the summer in a kayak trip in Karelia and the White Sea, and in the fall in a hiking trip in the mountainous Crimea. While driving the kayak, I placed the device on the kayak from above, securing the rope to the frame. During the walking radial exits in Karelia, and during a hike in the Crimea, the device constantly hung on my neck. During parking and daylight, the device was suspended in the shade on a tree branch. The general impressions of using the device are very positive: it seems that literally you have another sensory organ.
When kayaking on a large lake or sea, the measured pressure graph really corresponds to one height and allows you to judge the weather. An intensive decrease in pressure, as a rule, precedes the deterioration of the weather in 1-2 days, an intensive increase in pressure - to improve the weather. Intense can be considered a change in pressure of about 10-20 mmHg per day. During stable weather, pressure changes much more slowly. On time scales of the order of a day, pressure changes were significantly faster than 20 mm of mercury per day I did not observe. However, once in the city during a storm I observed a pressure jump of 1.5 mm Hg, which occurred within 2-3 minutes.
While walking, the elevation profile is “read” on the pressure graph. However, taking into account the fact that atmospheric pressure is not constant, errors can occur in the visible profile. However, observations of the pressure changes during parking allow us to estimate the possible value of the error that occurs on the day. While the change in pressure per 1 mmHg corresponds to a change in height of about 10 meters, the accumulated error can reach 200 m per day with an intense change in pressure, and will be much less if the pressure is stable. When driving in mountainous areas, when the ascent speed is 50-300m / h, respectively, when analyzing the passed profile over the past few hours, the accumulated height error caused by the pressure change can be neglected.
This is how the pressure graph looks like going up the mountain (Mount Kalikorva in Karelia):
The temperature and humidity graphs are also very curious on their own. Thanks to the graphical presentation of information, it is easy to see how the weather has changed in recent days. However, with the measurement of temperature and humidity there are a number of features. Experience has shown that the time constant for equalizing the temperature of the device and air temperature is about 20 minutes in the absence of blowing, and is reduced several times in the presence of blowing with the wind (blowing leads to a quick alignment of the temperature of the sensor and air and reduces the effect of the housing on the temperature of the sensor). However, the temperature is somewhat "lagging" behind the actual air temperature. In addition, heating the device with the sun slightly affects the readings. If a device suspended from some support is taken out of the shade into the bright sun, with a slight wind the readings will increase by 2-4 degrees. When placing the device on a kayak, or on a ground heated by the sun, the readings may differ from the air temperature by 5-15 degrees in a larger direction. There are some problems with measuring humidity in rainy weather. When the device gets wet in the rain, the gaps between the panels and the protective cap of the sensor get wet and hold water for a long time, which leads to “sticking” of the readings at the maximum value (for this instance of the sht21 sensor this is 95%).
Photo of the device hanging on a pine tree during the day:
Another shot, morning. During the day's transition last day, the device was lying on a kayak and heated by the sun to unrealistic temperatures.
The luxometer allows you to judge the depth of twilight or the thickness of the clouds. According to observations, the illumination on a sunny day is 60-90 kilolux, under a cloudy layer during the day 3-20 kilolux, during the passage of a thunderstorm front decreases very significantly. For example, during a thunderstorm in Karelia at 9 pm (3 hours before sunset) there was a peak drop in illumination to 30lux, and 500-2000lux during the ensuing rain. Illumination during a white night in clear weather at the beginning of the Karelian campaign was 10 lux, in two weeks already 0.2 lux. The possibility of constructing a graph of illumination in the device is not provided, because the readings of the luxometer strongly depend not only on illumination, but also on the spatial position of the device and surrounding objects, and it will be practically impossible to extract useful information from such a graph.
After a trip to Karelia, small improvements to the device were made taking into account the identified shortcomings. The composition of the information under the graph was changed - the uninformative temperature of the pressure sensor and the battery voltage were removed, and the barometric height in meters and the dew point temperature were added. Instead of indicating the battery voltage on the main screen, a flashing battery low warning was entered. Barometric altitude in some sense duplicates pressure, because it is its function, but when moving uphill it is much more convenient to track the height in meters, rather than pressure, trying to count it in your mind. In addition, the front cover has been replaced with a new one, with the designation of the buttons. When disassembling the device, small traces of corrosion of the pressure plates on the inside were revealed,
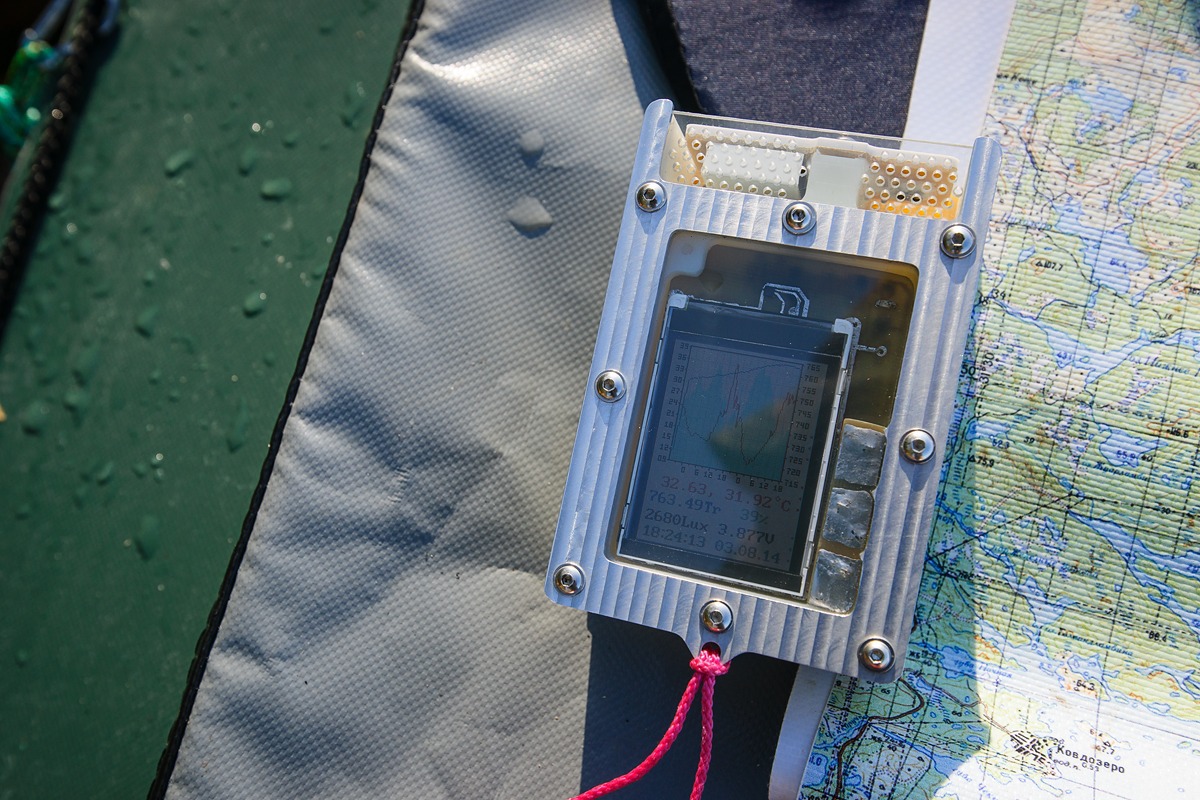
The device lies on a kayak:
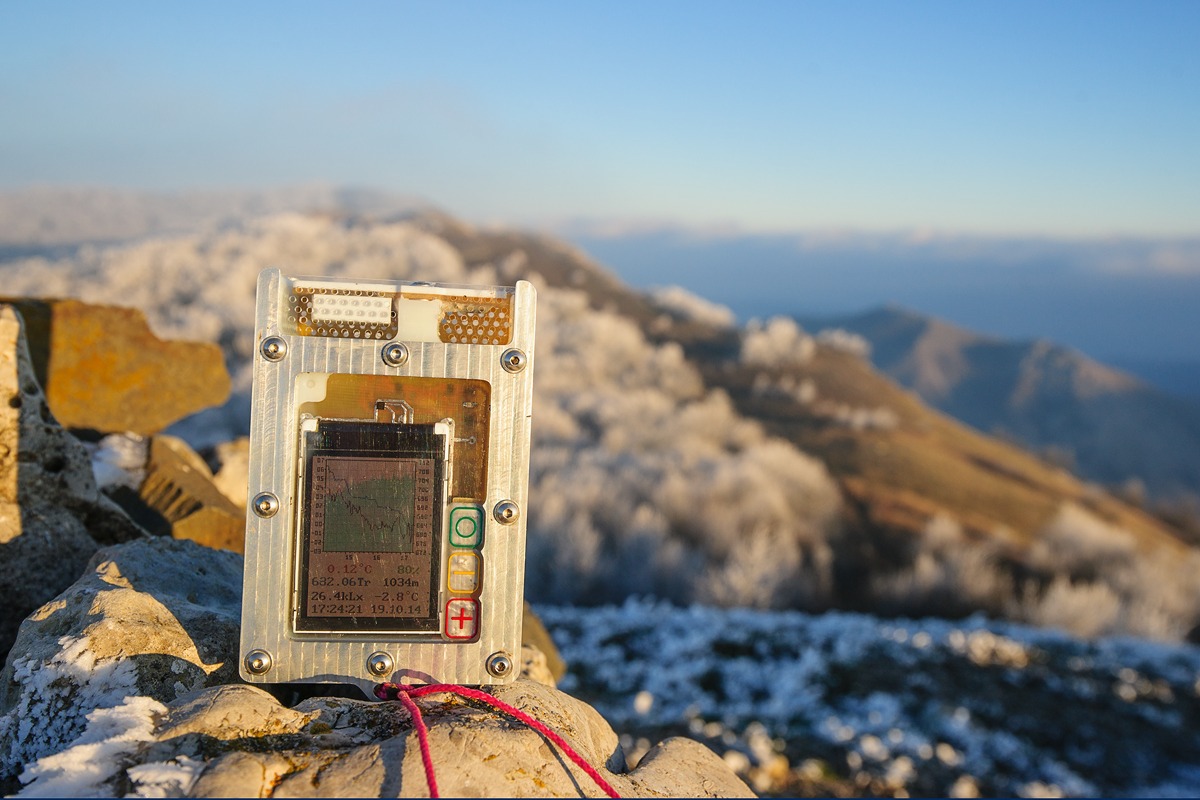
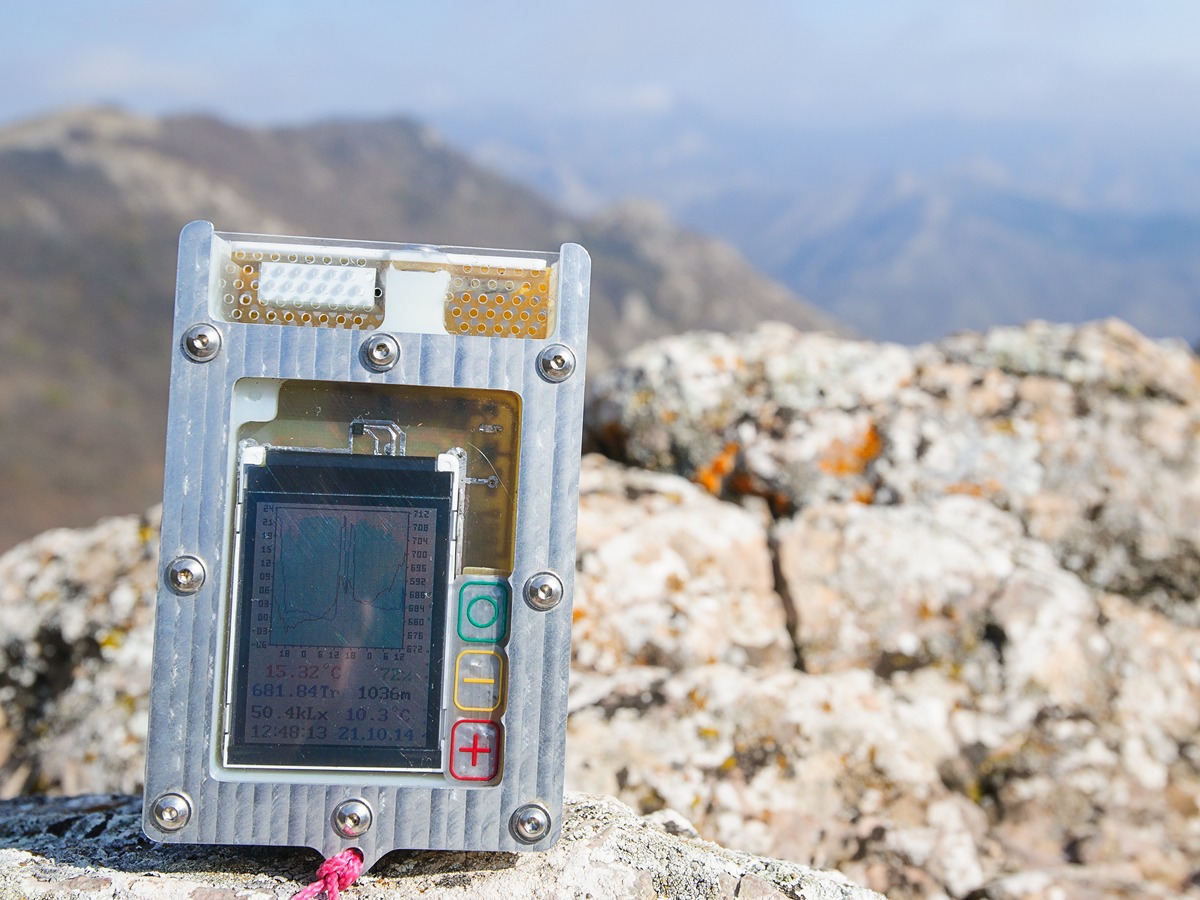
During the autumn campaign in Crimea, the impressions of the device were somewhat different. If in Karelia the pressure information allowed us to assume what the weather changes about the weather will be, in the Crimean mountains the pressure sensor is valuable only as an altimeter. The presence of an altimeter allows you to learn new things, even about long-walked trails, and makes it possible to track what part of the ascent or descent you have gone if the elevation is known. Those “snatches” of the pressure graph recorded in the parking lots do not provide useful weather information. At least in the fall, when tomorrow you may be above the cloud, in the cloud, under the cloud, or there may not be any clouds at all.
Data on temperature and humidity are also perceived differently, it is rather a cut of the weather along the route of movement. After several days of walking in the mountains, I want to turn the pressure chart over, converting it to a height.
Although in this form, he makes it clear the tendency of ascent or descent on a winding up / down path, and the movement profile for recent days.
Looking at the last photo, an inquisitive reader can learn from the graphs that I like to spend the night near the peaks.
In the autumn campaign, one more confirmation was obtained of the fact that heating the device blown by the wind in the sun does not introduce large errors in the temperature measurement compared to the measurement in the shade, however, errors are significant if the device is on the surface and airflow is difficult.
Finally, we summarize the experience of using the device. It is worth noting that all the planned technical solutions and all the planned measurement channels that were useful to some extent or other were implemented. The idea of displaying graphs that allow you to track how the temperature, pressure and humidity has changed lately has fully paid off. Touch buttons work reliably in any weather, including in the rain. The battery life of the device is sufficient. The readings from the screen are easily readable in any light, the graphs are easily distinguishable, despite the fact that there are three of them on the same coordinate system. A time interval of 2 minutes for the countdown is enough to track fast changes in readings, including short stops when driving on an ascent or descent. For temperature or humidity, this frequency may seem excessive. Wireless charging works, but its use did not contribute to reducing the weight of the device.
However, it is worth noting the individual operational disadvantages of the device:
As a result, a number of solutions are proposed for use in creating the second version of the device. Since one of the main disadvantages of the first version of the device is the large mass, a number of measures have been proposed to reduce weight and improve usability:
To expand the functionality of the device, it was decided to transfer the project to AVR Studio and GCC, switch to using the ATmega1284p processor with 16kb of RAM and 128kb of ROM. This will complicate the program and implement the following features:
Boards, source codes, curves for milling, and other information can be downloaded here .
PS At the moment, the second version of the device is assembled and is being tested. Coming soon.
I often go to nature, both on long hikes and short weekend trips. Instrumental observation, on the one hand, will simply satisfy curiosity by answering the question “Is it warmer today than yesterday?” Or “How cold was the night?”, On the other hand, the presence of even primitive weather information can help predict better or worse weather or fog . Hence the desire to create an autonomous device for measuring, logging and displaying meteorological information suitable for camping use and satisfying the following requirements:
- Sealed shockproof housing;
- Constant display of real time and current weather data: pressure, temperature, humidity, as well as the history of their changes over the past few hours and several days on the screen;
- The screen read in the bright sun;
- Operation of the device throughout the trip without recharging or replacing batteries or recharging;
- It is advisable to save the history of weather data in non-volatile memory.
It is worth noting that devices of this purpose in the form of watches, remote controls and individual devices are available on the market, however, in my opinion, their ability to display the history of changes in weather information is insufficient, and logging is usually absent altogether. Therefore, I decided to develop my own device.
Determining the appearance of the future device
At the initial stage of design, you need to decide on the choice of the many available parts, components and technologies, and find the optimal combination. Consider the main components of the future device and the reasons for choosing certain solutions.
Screen
For the proposed device, a color screen, in my opinion, is preferable, since it is convenient to display several graphs on the color screen on the same coordinate grid, while on a monochrome screen such a picture will be difficult to perceive. Given the requirements of visibility in the sun, continuous display, and moderate power consumption, the choice clearly falls on the transflective TFT display. The main problem here is to get an affordable display. A quick search showed that the transflective screens declared in online stores are not available, the options available on alibaba have an uncomfortable RGB interface, and the only available option is the screen from the good old Siemens CX / M / S65 phone. Of course, it’s not very good to rely on a component with disassembly, but for a small-scale DIY project it will do. The advantages here include the fact that the screen is controlled by SPI (it will be easier to breed the board). Although the screen is from a phone, information is available on how to manage this screen fromCristian Kranz (at the time of writing, Christian’s website has been around for six months now).
Sensors
To begin with, it is worth deciding on a set of measurable parameters and sensors for them. Three unconditionally required parameters are pressure, temperature, and humidity. You can also add a light sensor.
Now we define the criteria for choosing sensors. The sensors should be small in size, accurate and, if possible, not require complication of the device circuit in view of the specific sensor strapping. Ideally, all sensors are digital and operate on the same voltage. It is also desirable that the pressure and humidity sensors, which have direct contact with the atmosphere, be protected from dirt and dust.
Pressure meter.From experience with quadrocopters, I came across BPM085 and MS5611 sensors, both with an I2C interface, and built-in thermal compensation. Of these, the second turned out to be more accurate and stable, with a little averaging it allows 1Pa of pressure, which corresponds to about 10 cm of height. I initially chose it for the device, and a little later I decided to use a protected version of this sensor, called the MS5803.
Humidity sensor. There are many options, both analog and digital. I liked sensiron's I2C family of SHT2x sensors. Small, accurate, operates in the same voltage range as the pressure sensor (1.8V-3.6V), and measures not only humidity, but also temperature. In addition, an anti-dust cap is issued to it.
Temperature sensor.Two of the above sensors already measure the temperature, a separate sensor is not needed.
Light sensor.Here it is advisable to put a sensor with a very wide range of measurements. To measure from illumination by the direct sun (100 thousand lux) and down to deep twilight and moonlit night (0.2 lux), or even less. Moreover, the sensor is desirable with factory calibration, because I have nothing to calibrate. There are options with photodiodes, but require additional strapping, although they can potentially have a large measurement range. Therefore, my attention was drawn to the series of integrated I2C max4400x sensors. There are several similar sensors in the series, some multispectral, some have an IR emitter and can work as a proximity sensor. My requirements for the measuring range are met by one, max44009. However, it is possible to install two sensors, monochrome max44009 for high light, and RGB sensor max44008 for small. And the use of a dimming filter can expand the operating range of max44008 to the required 100 thousand. Suite We will choose the simple option with max44009 as the main one, and consider max44008 as a possible addition.
CPU and strapping
Given that the screen and all sensors work from 3-3.3 volts, and SD cards work from 3.3v. it is advisable to use a processor that runs from 3-3.3v. I chose my usual AVR. Note that the choice of AVR allows you to use the Arduino IDE to build the project and use libraries for Arduino. In this project, the use of the library for working with the SD card is especially relevant. Although, in principle, Arduin libraries can be used in projects assembled in AVR Studio, this requires some tricks. Looking ahead, I’ll say that the only plus point from using Arduino was uploading the program via UART.
According to initial estimates, 32kB of ROM and 2kB of RAM (about 600bytes for working with SD, and almost everything else is the measurement history) is quite enough for the project, and therefore I chose the ATmega328p processor. A voltage of 3V dictates a clock frequency of no higher than 8 MHz. The project I started writing under the Arduino IDE. When assembling for this processor, the voltage just selects the target Arduino Pro mini 3.3v. Since real-time clocks are needed to realize all the functions of the device, and RF quartzes as a rule do not provide sufficient frequency stability, you must either use a clock quartz with a processor (in view of the features, ATmega328p will be clocked from the RC oscillator) or use a separate real-time clock chip . In view of the latter circumstance, I decided to use a separate I2C chip with a DS1337 calendar clock. An additional argument in favor of a separate chip with RTC was the possibility of implementing a battery change without losing the clock settings. However, subsequently, the option of built-in batteries of the device was chosen.
Control buttons
Although the instrument interface is planned to be simple, buttons are still needed for switching display modes, setting the time and adjusting for height. Since it is difficult to hide the mechanical buttons in the pressurized enclosure (for this you need to make holes in the case and put a flexible seal in them tightly, or enter the pusher through the seal), it was decided to make capacitive touch control buttons. With a touch pad area of about 1 sq. Cm, a wall thickness of 2-3 mm with a dielectric constant of about 2-4 (typical for plastics), it is necessary to make a device that reliably records the change in capacitance by a fraction of picofarads. This problem has several solutions. The first option is to put a specialized chip - a touch controller. The second is to make touch buttons on pairs of processor legs, simply by measuring the charging time of the input capacitance of the input line with the pad through the megaohm resistor from the output line. The method is described on several resources, there are corresponding libraries. However, since I want to create a sensitive and noise-free sensor, I chose the third option - a sensor with a phase detector. The idea is simple. Two RF signals are applied to the input of the phase detector. One directly from the source, and the second through the RC circuit, in which the sensor pad is used as the capacitance (and, of course, the stray capacitance of the input of the phase detector, too). The signal from the output of the phase detector is averaged and measured using the ADC. Such a circuit will be much less sensitive to external interference, at least at frequencies other than the frequency of the probe signal. As the source of the RF signal, you can take just the processor clock signal. For greater noise immunity, you can still introduce phase-code modulation of this signal, however, judging by the operating experience, this is an excess.
Housing design
One of the most difficult questions for DIY projects is creating a sealed enclosure. Moreover, the housing design is largely determined by the available technological base. The only easily accessible pressurization tool for me is the 3-axis CNC milling machine, suitable for milling plastics, wood and soft metals. It turns out that the body must be assembled from milled parts made of plastic and aluminum. The question remains of the choice of gaskets. Special sealing gum, and even the required length, could not be found, but tape recorders can be used as sealing seals. This technology has already been tested previously in other buildings. As a result, the housing will consist of a central unit with grooves for seals, and front and rear plastic covers fixed by clamping frames. The question remains of the choice of materials. The central unit should be made of capralon. In this plastic, you can reliably cut threads, as in metal, it is not fragile and wear-resistant. The front cover should be transparent, and preferably not fragile. Of the available options for transparent plastics, I chose polycarbonate. The disadvantages of this material include not very high transparency compared to polymethyl methacrylate. But it is ductile and not susceptible to cracking. There are no transparency requirements for the back wall, in the end I settled on a version of fiberglass. The clamping frames must have sufficient rigidity to crush the elastic along the entire length. In addition, it will be they who account for the majority of possible hitting the body against surrounding objects. Therefore, it was decided to make them from aluminum alloy.
Placement of sensors
The temperature and humidity pressure sensors must communicate with the atmosphere and have good thermal contact with it. In addition, they should be relatively insulated from the housing to reduce the reaction time to temperature changes. At the same time, it is advisable to place them so as to protect against possible shock and dirt. Therefore, the layout of sensors on a T-shaped protrusion in the recess of the case looks promising.
The light sensor will be placed behind the transparent front panel, near the screen. The influence of wall transparency can be taken into account by calibrating the sensitivity of the sensor.
Source of power
There is little choice, either lithium-ion batteries or metal hydride batteries. Metal hydrides work a little better at low temperatures, and this is where the benefits end. In terms of energy intensity, lithium is more profitable. As a result, I chose lithium-ion, although this choice was made at a fairly late stage of the project. For myself, I have identified such requirements for battery life:
- 9 days (1 week + 2 days) in winter (temperature -10 ..- 20);
- 15 days in the summer in the mountains (temperature drops briefly below 0);
- 25 days in the warm season (temperature does not fall below 0).
Based on these requirements, the battery capacity will be determined.
Development of electronic parts
According to the solutions described above, a device circuit was developed.
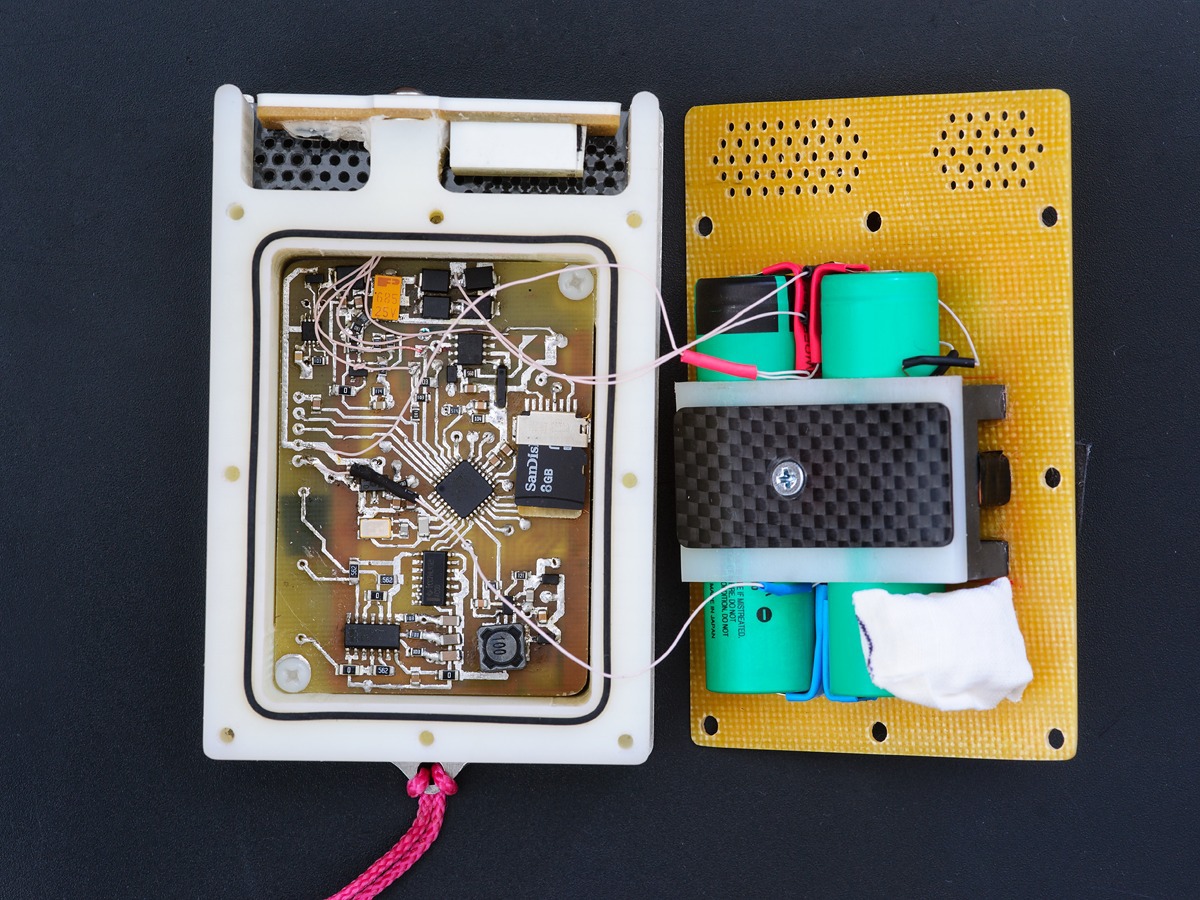
The 78HC03 chip stabilizes the supply voltage for the controller and sensors. On chips 74AC00 and 74AC86 built controller touch buttons. The first is designed to turn on / off the supply of 8 MHz signal to the sensor plates, the second contains 3 phase detectors. The voltage converter for the backlight is made on a DC / DC converter chip with a PWM control LM2733x and is powered by batteries, bypassing the stabilizer, the OS is made according to the current of the LEDs. The operating voltage at the output is about 12V (in the backlight of the screen there are 4 LEDs connected in series). To protect the controller in case of removing the screen from the board, a 15V zener diode works as a protective load. The backlight current is set by the resistor R9, the voltage drop at which is 1.25V. The max1879 controller controls battery power, To measure the charge current, the TS321 operational amplifier with strapping is used. The real-time clock is made on the DS1337 chip. When developing the circuit and the board, it was possible to install a backup battery for the watch. However, when using non-removable batteries, a battery is not needed.
Wireless charger
The implementation of wireless charging was one of the most underestimated by the complexity of the tasks in this device. For reasons of convenience, the layout of parts in the case, I chose the W - shaped core Sh7x7. A larger core would lead to an increase in the already small body, although the larger the better, so that the two halves with a 1.5 mm gap (thickness of the back wall) dissipate the flow as little as possible. However, even with such a core size and a thickness of the flux scattering gap, it is essential, therefore, the resonance phenomenon had to be used for more efficient energy transfer. Note that a detachable transformer can operate in several modes:
a) The device lies on a charging cradle, the battery is charging, the transformer is loaded with a load with a steep I – V characteristic.
b) The device lies on the charging cradle, the battery is charged or is charging in PWM mode, the transformer is not loaded.
c) The device is removed from the charging cradle, but the primary winding of the transformer is connected to its power source.
d) The intermediate position of the transformer parts, briefly at the time of installation and removal of the device.
It is necessary that the charger can work in all four states without overheating of the windings and overloading of keys. There are two options - either to make a complex driver with automatic frequency adjustment and shutdown in the absence of load, or selection of element parameters. It is impractical to make a resonant circuit from the secondary winding, since in state b) when the transformer is not loaded, a large voltage will appear on the secondary winding, which can easily exceed the maximum allowable open-circuit voltage for max1879 and the key. Therefore, we will manage the resonance only in the primary winding circuit. I managed to achieve good charging parameters using a very simple power scheme.
The primary winding is connected to an AC voltage source consisting of an IR2153 driver generator and two keys powered by 12V. In series with the primary winding, the capacitor C7 is turned on, they form an oscillatory circuit. In parallel with the primary winding, a neon lamp (in my case a pair of on-series lamps) with an ignition voltage of about 160V is turned on to protect against overloads. The generator frequency (about 100 kHz) is set by the tuning resistor R1 and is set so that in mode a) the circuit works very close to resonance. In this case, the amplitude value of the voltage on the primary winding reaches 100-110V, and the average current of the secondary winding (battery charge current is about 600mA). In mode b), when the load is disconnected, the circuit leaves resonance (the resonant frequency of the circuit with an unloaded secondary winding is lower than the generator frequency), the voltage on the primary winding drops below 60V, and accordingly the useless losses in the ferrite also fall, and the amplitude value of the secondary winding voltage does not exceed 14V. In mode c) the inductance of the "half" of the transformer is less, the resonant frequency of the circuit is higher than the frequency of the generator, the voltage on the primary winding drops, and the losses in ferrite are small. In mode d), an unloaded primary circuit may fall into resonance, and for this, a neon lamp is used as a “protective” load. The primary winding (in the charger) contains 32 turns of PEV-1 0.6 wire and the secondary winding (in the device) 32 turns of PEV-1 0.3. It is worth noting that the quality factor of the circuit and, accordingly, maximum power transferred to the load is limited by losses in ferrite. Parallel to the secondary winding, 15v p6ke15ca suppressors are connected to protect the charge circuit from voltage surges. With the selected circuit parameters in the operating modes, the suppressors are not heated.
Software development
For Arduino there are many libraries for working with sensors, and other peripherals, however, many of them are inconvenient and cumbersome. In the process of development, I came to the conclusion that other people's small libraries should be used to a minimum, implementing simple functionality on their own. This saves some controller resources and the amount of ROM used, although it slows down development. The native Arduino libraries were cumbersome and inconvenient. As a result, the only third-party library used on the project was SdFatLib by William Greiman. The module for working with i2c sensors sht21 and max44009 and RTC was written from scratch, work with ms5611 / 5803 was borrowed from the multiwii project and finalized. The x65 by Christian Kranz screen module was redesigned to fit the needs of a particular project. There are 3 types of screens in siemens x65 with different controllers: Epson L2F50, Sharp LS020, and Hitcah LPH88. I managed to get only the first two samples, so while my project supports only two types of display controllers. The specific type is set in the configs. It is also worth noting that the device requires a non-standard FUSES configuration for Arduino - turning on the CLKO line and setting the brownout detector to 2.7 volts.
Work with sensors
There were no particular difficulties with polling the sensors, they (and the clock too) are interrogated continuously in the main cycle of the program, the duration of the main cycle is approximately equal to about 180ms. It is worth noting one feature of the sensors MS5611 / 5803. Their testimony sometimes “freezes” after several thousand measurements. This feature was noticed by me when debugging multiwii, and here I ran into it again. The way out of the situation is trivial: every 256 polls I just reset the sensor, and there are no more problems with fading. The last figures in the pressure sensor readings constantly fluctuate within 3-4Pa (resolution of the sensor is 1Pa), but averaging the results of the last 16 measurements allows you to completely remove fluctuations. And this is not all the features of the MS5611, it still turned out to be photosensitive, which required the installation of a light-protective cap.
Information Display
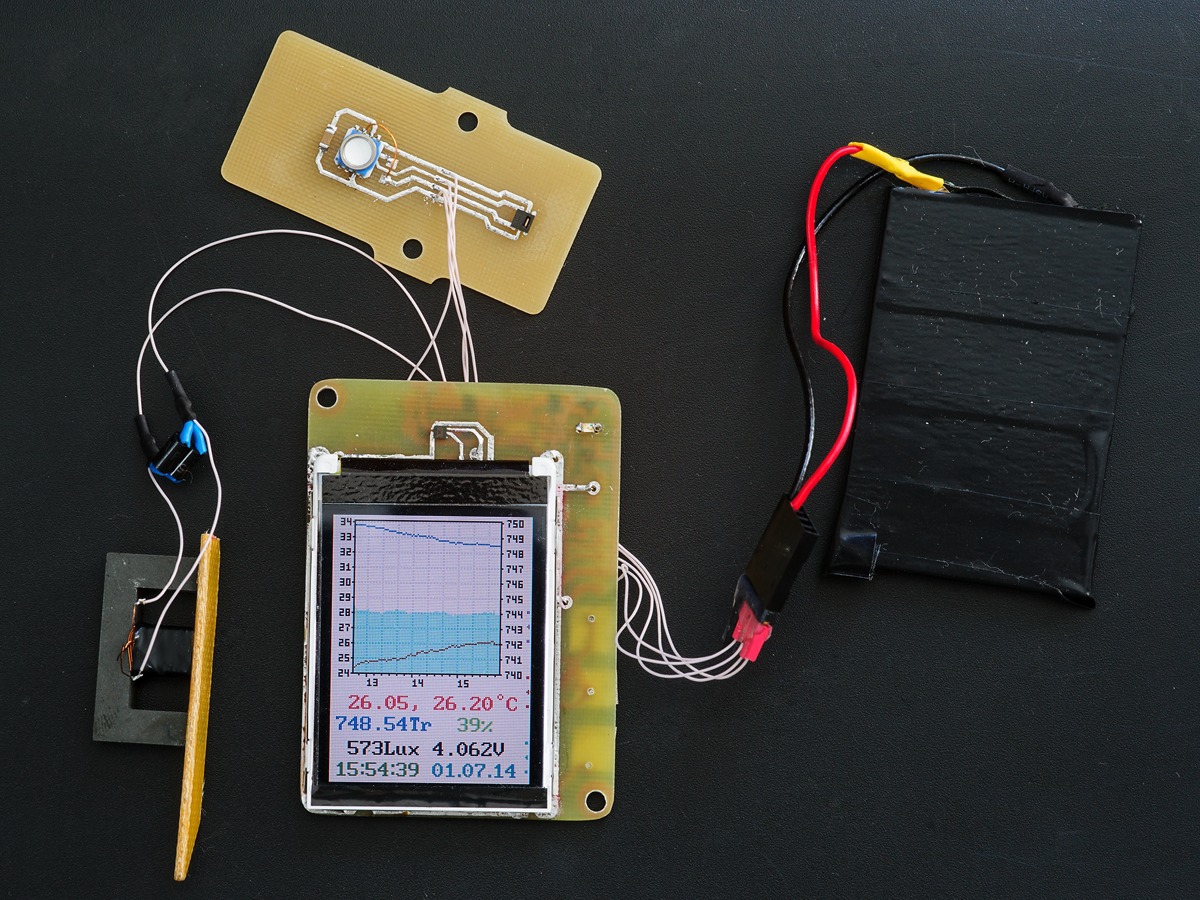
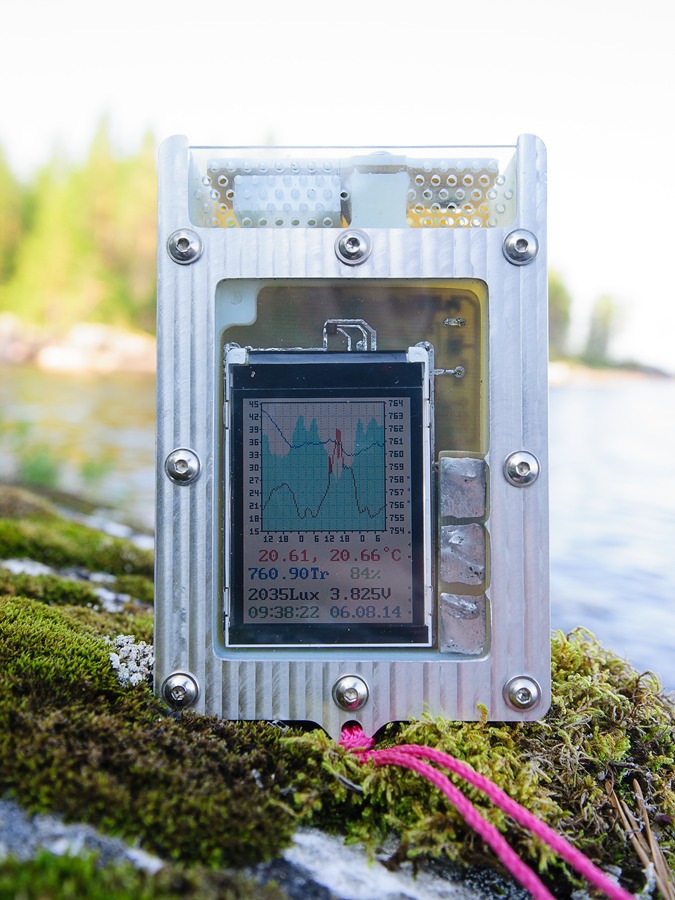
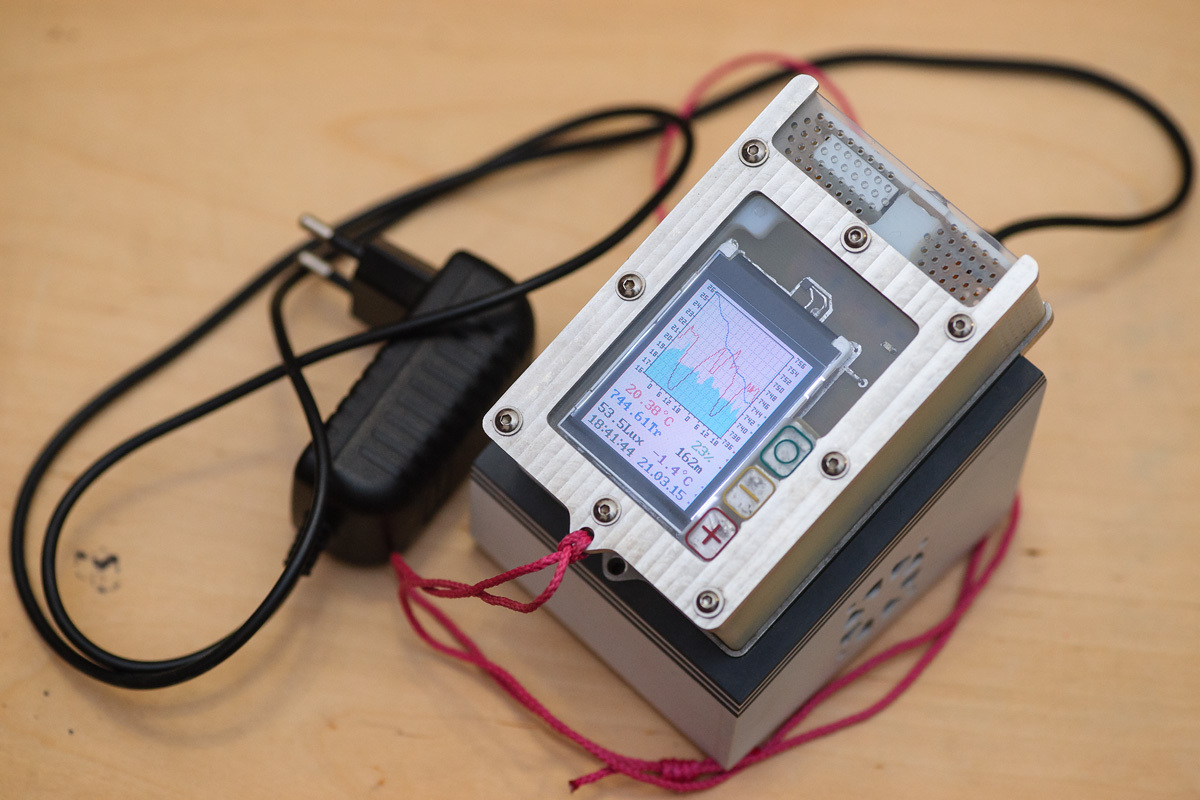
The question of what the information displayed on the screen should look like at first seemed difficult. But at the initial stage of development, a simple mapping principle was laid down, and then it only improved. The principle is simple - the device has two display modes. The first shows a graph with meteorological information, and the main data read from the sensors in digital form.
In the second mode, all information about the current state of the device and sensors is displayed on the screen: voltage and current of battery charge, temperature from two sensors, humidity, pressure, calculated values of dew point and barometric height, pressure of the zero elevation mark, illumination, time, date. Also in it is available to set the clock and pressure at the zero mark of the altimeter. With a screen size of 132x176 pixels, the size of the graph was made 96x100, while there was still room for signing scales with a font of the smallest possible size, and for placing 4 hours of current information in 8x14 font. The temperature curve aligns to the bottom of the coordinate system, the pressure curve to the top. The scale along the ordinate axes is automatically adjusted to the displayed data. Humidity is displayed by proportionally filling the background of the graph with a light blue color. The position of the labels and grid lines of the ordinate axis is constant; only label labels change. The grid and labels along the x-axis move with time, along with the graph. An important issue is the choice of the available abscissa axis scales. Given the available RAM volumes, it was decided to stop at two scales - fast 2min / pixel (data for the last 3 hours and 10 minutes is displayed), and slow 30min / pixel (data for the last 48 hours is displayed). In slow mode, averaged data is displayed over a half-hour interval. In the mode, the current data is stored every two minutes at 0 seconds. This is done in order to remove the visible "lag" of data on a quick chart relative to the current. For each graph display mode, 96 readings of pressure, humidity and temperature are stored. Moving according to the schedule back in time is not provided.
Touch Button Operation
To interrogate the touch buttons, periodically (once per main cycle) they receive a test RF signal (8 MHz from the CLKO output of the processor) for 5 ms, after which the signal values at the outputs of the phase detectors are read. The ADC has 10 bits, the output values vary from 0 to 1023. For selected R1-R3 values, free sensor plates of 8x10 mm are characterized by 500-700 values, when a finger is brought up to the plate located behind a 1.5 mm thick PCB layer, the values change by 70-150 counts up. On the one hand, this indicates a large input capacitance of the 74AC86 logic elements, on the other hand, a signal change is more than enough to reliably determine the touch and adjust the response threshold, even if the dielectric thickness is increased to 2-3 mm. To determine the logical state of the touch buttons, the current read value is compared with the average value for the last few readings. If their difference exceeds the threshold, the state of the sensor is fixed as “pressed”. If the difference falls below the vacation threshold, the state is fixed as "released". Thresholds for each sensor are set separately, this makes it easy to make sensors sensitive enough to avoid false positives. The adaptive comparison circuit guarantees the reliable operation of the touch buttons under varying temperatures and possible contamination of the case. Thresholds for each sensor are set separately, this makes it easy to make sensors sensitive enough to avoid false positives. The adaptive comparison circuit guarantees the reliable operation of the touch buttons under varying temperatures and possible contamination of the case. Thresholds for each sensor are set separately, this makes it easy to make sensors sensitive enough to avoid false positives. The adaptive comparison circuit guarantees the reliable operation of the touch buttons under varying temperatures and possible contamination of the case.
The buttons are designed to perform routine actions to switch modes, as well as critical actions, such as setting the clock. To activate critical actions, you need to select a special “initiating” combination of buttons, which is difficult to press by accident. Since the buttons are arranged in a row, a natural option for such a combination is to hold the extreme with the average released. In this case, the remaining actions are performed by pressing and holding one button. When a pair of adjacent buttons is pressed, their action is blocked until both of them are released. The trigger combination is also used to turn on the backlight. Moreover, if the illumination is less than the threshold of 100lux, the initiating combination always turns on the backlight. Further, depending on the display mode, pressing this combination again either turns off the backlight or turns on the clock setting mode. To confirm the entered time and date, press the initiating combination again. For convenience, the search buttons in the dark on the top cover made special tabs.
Energy saving measures
After writing the main part of the measurement program, it was shown that on average when the backlight is off, the device consumes a current of about 7.5mA, of which about 3mA consumes a display. The rest of the consumption falls mainly on the processor, on the controller of the touch buttons, microSD card, and a little on the sensors. Energy consumption can be slightly reduced if, in “free” time, the processor is driven into energy saving mode and the frequency of polling sensors and updating information is reduced. However, it will not be possible to significantly reduce it; almost half consumes a constantly-on display. To further reduce power consumption, the standard Arduin library for working with ADCs was modified so that during the measurement of the ADC, the processor switches to ADC Noise reduction mode (see the myadc module). At the same time, the accuracy of the ADC is slightly increased, but, most importantly, processor power consumption is greatly reduced during measurements. To significantly save, simple delays in the main loop are replaced by multiple measurements of the charge current. This allowed to reduce the current consumption to 6mA. It should be noted that the use of more economical sleep modes could reduce power consumption a little more, up to about 5.5mA, however, this decrease is not very significant, and requires external signal sources to wake up the processor, which were not originally provided. At the same time, there is still a noticeable reserve for reducing power consumption up to 3.5mA due to a noticeable decrease in the frequency of polling sensors and the rate of redrawing the screen. However, such changes were not made for the sake of a constant operational indication. Separately, it is worth noting that the power consumption of the device depends on the SD card used,
Housing design
At the initial stage of development, it became clear that the housing will consist of two main volumes of a sealed compartment with an electronic part, and a ventilated recess for accommodating sensors. The sensors are small and their layout does not cause problems. The main board is more complicated. It should have a screen, touch pads (under the right hand - to the right of the screen), a light sensor (above the screen). It is rational to do a deepening with sensors from above, then when the device is on a support (table, ground, stone, ...) - the sensors will be from above. And the mount for hanging the device on the neck should be made from below, then it will be more convenient to look at the screen of a backpack suspended on a strap or the neck of the device.
The case size will be selected based on the layout of the batteries and charging transformer. Batteries are selected based on the required operating time. With a consumption current of no more than 6mA and the above-stated operating periods, the battery capacity should be chosen about 6000mA * h. In this case, it is advisable to select the batteries in such a way that the device compartment is arranged as densely as possible. After analyzing the available batteries, I settled on the option of two NCR18650B from Panasonic. At the same time, the size of the pressurized compartment of the case and the board can be made 70x50mm. In turn, this size determines the length of the sealing gum (half-perimeter 70 + 50 + margin = 125mm) and the size of the body. Since the sealing gum from the belt is tough, you will need a lot of clamping screws. The required number of clamping screws can either be calculated by solving the problem of deformation of the gum and body by the finite element method, or determined experimentally. I chose the second option and experimentally determined that 8 screws are enough. With the size of the case, I did not save much to make a simpler form. The size of the niches containing the sensors is also made with a margin for better ventilation. As a result, the size of the central unit is 103x68mm, and the pressure frames are even larger. Next I will give a photo of the elements of the case, and by the link at the end of the article you can download the archive with the drawings of the boards, and the curves, and a description of the operations for milling the case. to make a simpler form. The size of the niches containing the sensors is also made with a margin for better ventilation. As a result, the size of the central unit is 103x68mm, and the pressure frames are even larger. Next, I will give a photo of the elements of the case, and by the link at the end of the article you can download the archive with the drawings of the boards, and the curves, and a description of the operations for milling the case. to make a simpler form. The size of the niches containing the sensors is also made with a margin for better ventilation. As a result, the size of the central unit is 103x68mm, and the pressure frames are even larger. Next, I will give a photo of the elements of the case, and by the link at the end of the article you can download the archive with the drawings of the boards, and the curves, and a description of the operations for milling the case.
Case manufacture and assembly
The central unit is made of capralon by milling. The height of the central unit is 31mm. The dimensions of the grooves for the sealing gum were selected previously by trial and error. A test groove was milled in a soft material (a sheet of foamed PVC), an elastic was applied to it, after which corrections were made to the dimensions of the groove. Two protrusions are made inside the pressurized compartment, to which the main board of the device is attached.
The sensor unit is mounted on top with two stainless steel M3x10 screws. The tracks leading to the sensors and the place where the wires enter the housing are insulated with silicone sealant. Between the sensor board and the body, 0.5mm thick stainless steel washers are laid. These washers specify the thickness of the sealant coating the tracks at the time of pouring. The sealant also glues the SF2 cap over the humidity sensor. According to the documentation for mounting the cap and sealing the sensor, only sealants should be used, the evaporation of which does not cause permanent damage to the sensor. One of these is the DOW Conring 732 acidic silicone sealant. I used it to seal the sensor. (However, any other silicone is likely to work, but I decided to play it safe).
The front panel is milled from 2mm polycarbonate. The back panel is made from 1.5mm fiberglass. Pressure plates are milled from aluminum alloy (duralumin). The front plate differs from the rear in that it has protrusions that facilitate the tactile search of the sensor plates. The batteries and the charging transformer are fixed on the rear panel using two spacers milled from capralon and a carbon pressure plate. The printed circuit board is made using LUT technology, copper wires are soldered into vias.
The MS5803 sensor used is water- and dirt-resistant, however, irradiation of the sensor with bright light significantly affects the readings. Therefore, it was decided to close the sensor with a light-protective cap. The cap is made of polystyrene by solvent bonding. The inner part of the cap is made black, light-absorbing, and the outer white light-scattering, to exclude heating in the sun. The cap is glued to the sensor board with cyanoacrylic adhesive. Later it turned out that light penetrates through the sensor board and illuminates the pressure sensor from below. For this, an additional lightproof plate was installed on top of the sensor board.
A plate with touch pads is installed near the screen flush with the future cover on several layers of thick double-sided tape.
Since the housing is sealed, it is necessary to drain the remaining air inside the housing in order to avoid condensation at low temperatures. To do this, a small fabric bag filled with silica gel was placed in the case (in the photo on the bottom right on the battery).
The front and rear panels are attracted by eight stainless steel M3x12 screws. The 2mm hex cap is selected for aesthetic reasons. The weight of the complete device is 330g, overall dimensions 110x70x38mm (41mm for screw caps).
Instrument Operation Experience
The device was tested in the summer in a kayak trip in Karelia and the White Sea, and in the fall in a hiking trip in the mountainous Crimea. While driving the kayak, I placed the device on the kayak from above, securing the rope to the frame. During the walking radial exits in Karelia, and during a hike in the Crimea, the device constantly hung on my neck. During parking and daylight, the device was suspended in the shade on a tree branch. The general impressions of using the device are very positive: it seems that literally you have another sensory organ.
When kayaking on a large lake or sea, the measured pressure graph really corresponds to one height and allows you to judge the weather. An intensive decrease in pressure, as a rule, precedes the deterioration of the weather in 1-2 days, an intensive increase in pressure - to improve the weather. Intense can be considered a change in pressure of about 10-20 mmHg per day. During stable weather, pressure changes much more slowly. On time scales of the order of a day, pressure changes were significantly faster than 20 mm of mercury per day I did not observe. However, once in the city during a storm I observed a pressure jump of 1.5 mm Hg, which occurred within 2-3 minutes.
While walking, the elevation profile is “read” on the pressure graph. However, taking into account the fact that atmospheric pressure is not constant, errors can occur in the visible profile. However, observations of the pressure changes during parking allow us to estimate the possible value of the error that occurs on the day. While the change in pressure per 1 mmHg corresponds to a change in height of about 10 meters, the accumulated error can reach 200 m per day with an intense change in pressure, and will be much less if the pressure is stable. When driving in mountainous areas, when the ascent speed is 50-300m / h, respectively, when analyzing the passed profile over the past few hours, the accumulated height error caused by the pressure change can be neglected.
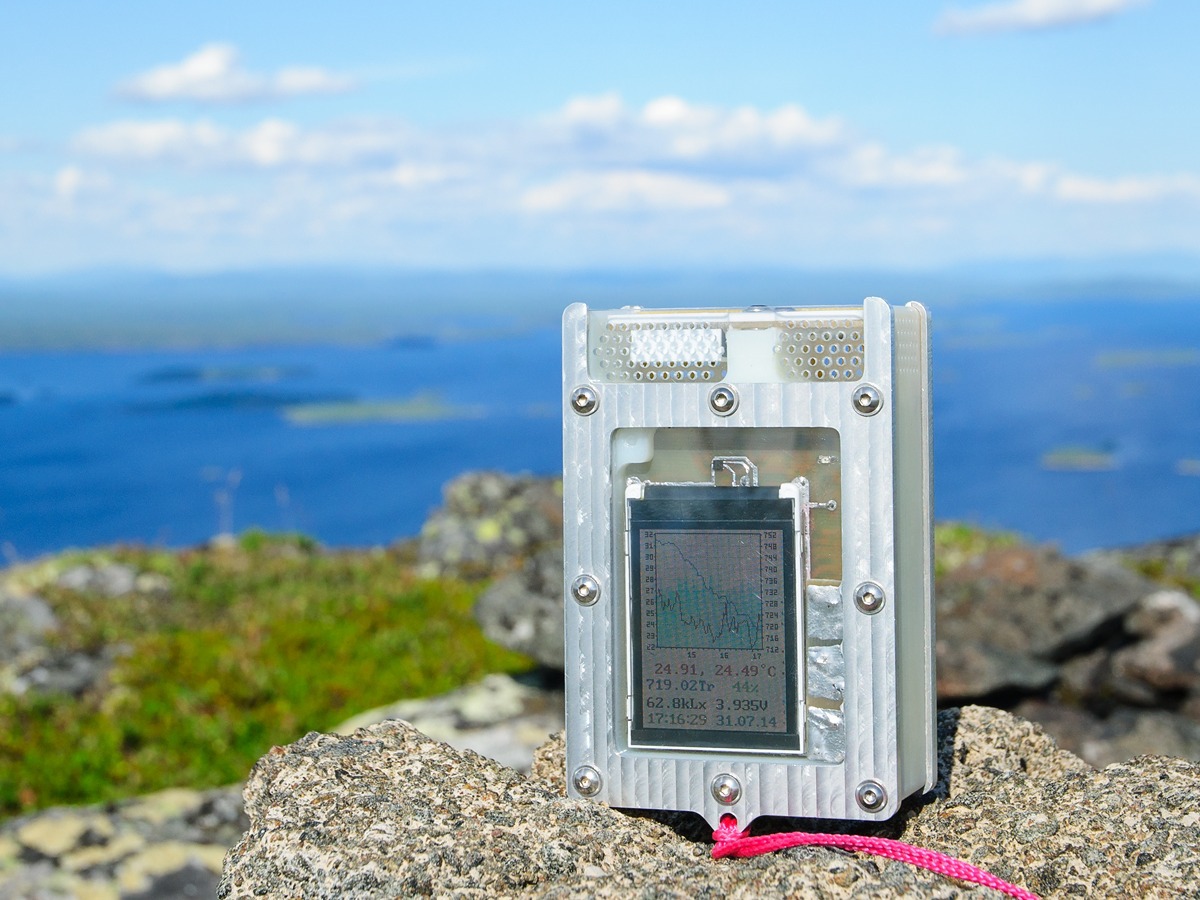
This is how the pressure graph looks like going up the mountain (Mount Kalikorva in Karelia):
The temperature and humidity graphs are also very curious on their own. Thanks to the graphical presentation of information, it is easy to see how the weather has changed in recent days. However, with the measurement of temperature and humidity there are a number of features. Experience has shown that the time constant for equalizing the temperature of the device and air temperature is about 20 minutes in the absence of blowing, and is reduced several times in the presence of blowing with the wind (blowing leads to a quick alignment of the temperature of the sensor and air and reduces the effect of the housing on the temperature of the sensor). However, the temperature is somewhat "lagging" behind the actual air temperature. In addition, heating the device with the sun slightly affects the readings. If a device suspended from some support is taken out of the shade into the bright sun, with a slight wind the readings will increase by 2-4 degrees. When placing the device on a kayak, or on a ground heated by the sun, the readings may differ from the air temperature by 5-15 degrees in a larger direction. There are some problems with measuring humidity in rainy weather. When the device gets wet in the rain, the gaps between the panels and the protective cap of the sensor get wet and hold water for a long time, which leads to “sticking” of the readings at the maximum value (for this instance of the sht21 sensor this is 95%).
Photo of the device hanging on a pine tree during the day:
Another shot, morning. During the day's transition last day, the device was lying on a kayak and heated by the sun to unrealistic temperatures.
The luxometer allows you to judge the depth of twilight or the thickness of the clouds. According to observations, the illumination on a sunny day is 60-90 kilolux, under a cloudy layer during the day 3-20 kilolux, during the passage of a thunderstorm front decreases very significantly. For example, during a thunderstorm in Karelia at 9 pm (3 hours before sunset) there was a peak drop in illumination to 30lux, and 500-2000lux during the ensuing rain. Illumination during a white night in clear weather at the beginning of the Karelian campaign was 10 lux, in two weeks already 0.2 lux. The possibility of constructing a graph of illumination in the device is not provided, because the readings of the luxometer strongly depend not only on illumination, but also on the spatial position of the device and surrounding objects, and it will be practically impossible to extract useful information from such a graph.
After a trip to Karelia, small improvements to the device were made taking into account the identified shortcomings. The composition of the information under the graph was changed - the uninformative temperature of the pressure sensor and the battery voltage were removed, and the barometric height in meters and the dew point temperature were added. Instead of indicating the battery voltage on the main screen, a flashing battery low warning was entered. Barometric altitude in some sense duplicates pressure, because it is its function, but when moving uphill it is much more convenient to track the height in meters, rather than pressure, trying to count it in your mind. In addition, the front cover has been replaced with a new one, with the designation of the buttons. When disassembling the device, small traces of corrosion of the pressure plates on the inside were revealed,
The device lies on a kayak:
During the autumn campaign in Crimea, the impressions of the device were somewhat different. If in Karelia the pressure information allowed us to assume what the weather changes about the weather will be, in the Crimean mountains the pressure sensor is valuable only as an altimeter. The presence of an altimeter allows you to learn new things, even about long-walked trails, and makes it possible to track what part of the ascent or descent you have gone if the elevation is known. Those “snatches” of the pressure graph recorded in the parking lots do not provide useful weather information. At least in the fall, when tomorrow you may be above the cloud, in the cloud, under the cloud, or there may not be any clouds at all.
Data on temperature and humidity are also perceived differently, it is rather a cut of the weather along the route of movement. After several days of walking in the mountains, I want to turn the pressure chart over, converting it to a height.
Although in this form, he makes it clear the tendency of ascent or descent on a winding up / down path, and the movement profile for recent days.
Looking at the last photo, an inquisitive reader can learn from the graphs that I like to spend the night near the peaks.
In the autumn campaign, one more confirmation was obtained of the fact that heating the device blown by the wind in the sun does not introduce large errors in the temperature measurement compared to the measurement in the shade, however, errors are significant if the device is on the surface and airflow is difficult.
Finally, we summarize the experience of using the device. It is worth noting that all the planned technical solutions and all the planned measurement channels that were useful to some extent or other were implemented. The idea of displaying graphs that allow you to track how the temperature, pressure and humidity has changed lately has fully paid off. Touch buttons work reliably in any weather, including in the rain. The battery life of the device is sufficient. The readings from the screen are easily readable in any light, the graphs are easily distinguishable, despite the fact that there are three of them on the same coordinate system. A time interval of 2 minutes for the countdown is enough to track fast changes in readings, including short stops when driving on an ascent or descent. For temperature or humidity, this frequency may seem excessive. Wireless charging works, but its use did not contribute to reducing the weight of the device.
However, it is worth noting the individual operational disadvantages of the device:
- The device turned out to be too heavy, it is inconvenient to wear it on the neck for a long time. I would also like to reduce the overall dimensions, but this is not so fundamental.
- Aluminum pressure frames are not very pleasant to touch at temperatures below +5 degrees Celsius, and are susceptible to corrosion by salt water.
- Water entering the protective cap of the humidity sensor and in the gap between the panels leads to a “sticking” of the moisture readings.
- There is not enough data to display. For example, in the evening, it’s impossible to see what happened this morning at 2min / pixel. The data for the "day before yesterday" in a resolution of 30min / pixel is also not complete.
- You must be able to display a height graph instead of pressure.
- There is not enough history of changing pressure settings at zero altitude. It is especially important if several times during the trip you make corrections at the same height, or at the same point.
- I would like to increase the resolution of the luxmeter in the low-light range.
As a result, a number of solutions are proposed for use in creating the second version of the device. Since one of the main disadvantages of the first version of the device is the large mass, a number of measures have been proposed to reduce weight and improve usability:
- Refuse the continuous display to reduce the required capacity and weight of the battery.
- Reduce the thickness of the side walls of the device.
- Abandon wireless charging in favor of a lighter and more compact pressure seal.
- Reduce the size of the board and the internal compartment to the screen size (this is possible due to the reduction of the battery), transfer the sensor plates to the side wall.
- Reduce the size of the sensor block and the light protection of the pressure sensor. Get out of the humidity sensor cap.
- Provide for such a casing design and rope fastening scheme so that the casing can stand vertically on flat horizontal surfaces.
To expand the functionality of the device, it was decided to transfer the project to AVR Studio and GCC, switch to using the ATmega1284p processor with 16kb of RAM and 128kb of ROM. This will complicate the program and implement the following features:
- Storage of weather data for the last 4 days with a resolution of 1 countdown in 2 minutes.
- Displaying data on a chart at several time scales with the ability to move the displayed window throughout the stored data set.
- Ability to display pressure data either as a pressure graph or as a height graph.
- The ability to display humidity data either as a graph of relative humidity or as a graph of dew point temperature.
- Storing the history of pressure changes at zero altitude.
Boards, source codes, curves for milling, and other information can be downloaded here .
PS At the moment, the second version of the device is assembled and is being tested. Coming soon.