HP Software: Application Monitoring Systems
 Recall the early two thousandths: the IT world already knows and is not afraid to use the terms - ITIL, IT processes, automation, an integrated system, etc., and the expression “Monitoring and Control System” is a fairly simple and concise concept associated with a pair of three simple tasks and systems.
 Ten years have passed and the expression “Monitoring and Management System” no longer contains the whole variety of tasks and concepts that are invested in it, and at the same time, it also began to “rub” the language of IT specialists, consultants and salesmen who carry the bright “Value” in IT masses.
Today we propose to deal with the analysis of the concept of “Monitoring and Management System”. There are three types that most often appear as separate entities:
Type No. 1 - “Bridge” . (Synonyms: “Umbrella system”, “Manager's manager”).
May be useful for companies moving away from infrastructure monitoring.
It is important that investments in existing systems (well performing monitoring tasks of individual parts of the infrastructure) are utilized, and the systems themselves become information agents.
 What could be a prerequisite for the implementation of a system like "Bridge":
 • The IT department decided to consolidate disparate monitoring systems that could not show the whole picture
• A serious application failure was not diagnosed by monitoring the infrastructure (although each individual element was “green”)
• Too a lot of warnings / alarms, lack of uniform coverage, prioritization and identification of causation.
Implementation Results
Automated collection of all available events and IT infrastructure metrics -> comparison (correlation) of conditions and their impact on the "health" of the service -> search for the root cause -> Display for the operator of the "dashboard" highlighting the root cause of the failure with recommendations for resolving it. Or in the case of a typical failure, you can go further and assign a script that automates the necessary actions of the operator.
Type 2 - “Anomaly Analyst”
Imagine that, as in the first case, we collect events and metrics from a number of infrastructure monitoring systems, we even went ahead and set up the collection of logs (not only IT, but also security). Every minute we have a lot of information and we want to get the benefits from its disposal as soon as possible.
 What can become a prerequisite for the implementation of an anomaly analytics system:
 • It is difficult to keep up with everything new in the company’s IT environment, but there is a need to collect, store and analyze all the data
• The need to reactivate unknown problems
• It is impossible to easily identify information that is important for elimination failures
• Significant manual effort is required to search for individual logs throughout the IT environment
• Deviations and recurring failures need to be identified
Implementation results
Automated collection of events, metrics, logs -> storage of this information for the necessary period of time -> analysis of any information, including logs, performance data and system data -> forecasting and resolution of any types of problems, known and unknown. As well as the ability to prevent known failures.
Type 3 - “Application Performance Management” (identifying and eliminating failures in end-user transactions)
This type of solution can be a useful addition working in close contact with the previous two. But its charm is that in itself, it can also give a quick result from implementation.
We presume that the company has applications that are important for business. A business takes care of the availability and quality of a service, one of the key elements of which is the application (for example: Internet banking, CRM, billing ...).
Business is very nervous if the availability or quality of the service is degrading. And the worst thing is that the business learns about this problem 10 minutes after its occurrence, which greatly upsets IT staff.
The concepts of “proactivity” and “quick recovery” immediately begin to climb into the head of IT.
 What can be a prerequisite for the introduction of such a system:
 • It is necessary to increase the availability of application services and productivity, as well as reducing the average recovery time
• Business speaks of “profit protection” (preventing customers from leaving)
• It is necessary to eliminate unnecessary costs and reduce the risks associated with a service level agreement (SLA)
Implementation results may vary depending on the main task, but in the general case it is:
performing typical actions a user with a “robot” from different regions / network segments + analysis of “mirrored” traffic -> checking the availability and quality of services with identification of “bottlenecks” -> informing the operator about the need to restore work bbn, indicating the place of degradation -> if necessary, deep diagnostics of the application to search for the causes of systematic degradation.
Next, we suggest that you familiarize yourself with the implementation of the above types of monitoring using HP Software products.
HP Software products will help to solve monitoring tasks at all levels, ranging from monitoring infrastructure: network equipment, servers, storage systems and up to quality control of business services and business processes.
The evolutionary path of development allows solving problems in stages, gradually increasing the capabilities of the system.
In this case, you can start with infrastructure monitoring, and with monitoring services.
Bridge HP Software
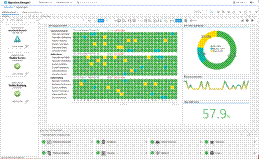
HP Operations Bridge represents the latest generation of “umbrella monitoring systems,” combining monitoring data from proprietary agents, various HP Software monitoring modules, and non-HP monitoring tools. The flow of events from all sources of information is superimposed on the resource-service model, correlation mechanisms are applied to it to determine which events are the causes, symptoms and consequences.
Separately, we should dwell on the resource-service model. The completeness and relevance of this model determines the possibility of a decision to correlate the flow of events. To maintain the relevance of the models, intelligence tools based on agents and agentless technologies are used, which allow obtaining detailed information about the components of the service, the relationships between them and the mutual influence. There is also the possibility of importing data on the service topology from external sources - monitoring systems.
Another important aspect is ease of use. In complex and rapidly changing environments, it is important to adjust the monitoring system when changing the structure of systems, adding new services. Operations Bridge includes the Monitoring Automation component, which allows you to automatically configure systems that are newly entered into the monitoring perimeter, which uses data on service-resource models. At the same time, the configuration and modification of previously performed monitoring settings are supported. If earlier administrators could perform the same settings of the same infrastructure components (for example, metrics on Windows or UNIX servers), which required considerable time and effort, now it is possible to dynamically and centrally configure threshold values for a metric in the context of a service or a service.
HP Software application analytics
Using a traditional monitoring approach implies that we know what to look for:
• what parameters to monitor
• what events to monitor The
growing complexity and dynamics of the development of IT systems makes us look for other approaches, as it becomes increasingly difficult to control all aspects of the system. What to do when something unexpected happens?
Operations analytics allows you to collect and save all data about the application: log files, telemetry, business metrics and performance metrics, system events, etc. and use analytical mechanisms to identify trends and forecast. HP OA converts the collected data to a single format and then, making a contextual selection, on the basis of the data of log files displays on the timeline what, at what moment and on which system it happened.
HP OA provides several forms of data visualization (for example, an interactive heatmap and topology of log file relationships) and uses the helper function to find the entire set of data collected for a specific period in the context of an event or by a query entered in the search bar. This helps the operator understand what led to the failure (or, when using HP SHA data with HP OA data, to make an appropriate forecast), and also to identify both the culprit and the root cause of the failure. HP OA allows you to reproduce the picture of the service and the environment at the time of the failure and isolate it in context and time.
Another Analytical Tool - HP Service Health Analyzer. HP SHA provides detection of abnormal behavior of controlled infrastructure elements in order to prevent possible denial of services or violation of the specified parameters for their provision. The product uses special algorithms for statistical data analysis based on the topological service-resource model HP BSM. With their help, it is possible to build a profile of normal values of performance parameters collected both from software and hardware platforms, and from other BSM modules (for example, HP RUM, HP BPM) characterizing the status of services. Typical parameter values are entered into such profiles taking into account the days of the week and time of day. SHA performs historical analysis of accumulated data and statistical analysis (to understand the essence of the identified data),
HP Software Application Performance Monitoring
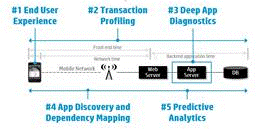
When it comes to application performance monitoring, the following components of an HP solution should be highlighted:
- HP Real User Monitoring (HP RUM) - monitoring the flow of transactions of real users
- HP Business Process Monitoring (HP BPM) - monitoring application availability by emulating actions user experience
- HP Diagnostics - query flow control within the
HP RUM application and HP BPM allow you to evaluate the availability of the application from the perspective of the HP RUM end user
parses network traffic, revealing in it the transactions of real users. In this case, you can control the exchange of data between application components: the client part - the application server - the database. This makes it possible to track user activity, the processing time of various transactions, to determine the relationship between user activity and business metrics.
Using HP RUM, monitoring service operators will not only be able to instantly receive operational notifications about problems in the availability of services, but also information about errors that users have encountered.
HP BPM is an active monitoring tool; HP BPM performs synthetic user transactions that are indistinguishable from real systems for controlled systems.
HP BPM monitoring data is very convenient to use for calculating a real SLA, since the "robot" performs the same checks at the same time intervals, providing constant quality control of processing typical (or most critical) requests.
By setting up samples to perform synthetic transactions from several points, for example, from different company offices, you can also evaluate the availability of the service for various users, taking into account their location and used communication channels.
To simulate activity, HP BPM uses the Virtual User Generator (VuGen) tool, which is also used in the popular HP LoadRunner stress testing tool. VuGen supports a huge range of different protocols and technologies, so you can control the availability of almost any service, as well as use a single set of scripts for testing and monitoring.
Diagnostics the HP . What to do when the causes of service failures or slowdowns are located inside the application, technologies such as Java, .NET?
HP Diagnostics provides in-depth control of Java, .NET, Python applications on Windows, Linux and Unix platforms, supports a variety of application servers (Tomcat, Jboss, WebLogic, Oracle, etc.), MiddleWare and databases. HP Diagnostics specialized agents install on application servers and collect technology-specific data. For example, for a Java application, you can see what requests are being executed, what methods are being used, and how much time is being spent on them.
The application structure is automatically drawn, it becomes clear how its components are involved. HP Diagnostics allows you to track the progress of business transactions within complex applications, identify bottlenecks and provides experts with the necessary information for decision-making.
Related links:
HP Gelion Presentation
What is SDN Networking - Software Defined Networking
The nearest training courses in Kiev ( TC MUK ) on HP technologies:
April 15-17 , Introduction to OpenStack Foundations
April 20-21, Cloud Computing Foundation (EXIN)
April 20-24, HP BladeSystem / Implementing Server Implementation HP BladeSystem Server Solutions
April, 2015, Brocade / HP B-Series Switch Administration (BCFA) Administration
April, 2015, Brocade / Fiber Channel / HP B-Series Fabric Professional (BCFP) Advanced Administration
Distribution of HP solutions in Ukraine , Georgia and Tajikistan
MUK-Service - all types of IT repair: warranty, non-warranty repair, sale of spare parts, contract service
