What is Business Intelligence?
There are a huge number of terms: analytics, data mining, data analysis, business intelligence and the difference between them is not always so obvious even for people who are associated with it. Today we will talk about what Business Intelligence (BI) is in an accessible and understandable language. The topic is unconditionally huge and cannot be covered by just one short article, but our task is to help take the first step and interest the reader in the topic. An interested reader will also find an exhaustive list for further steps.
Article structure

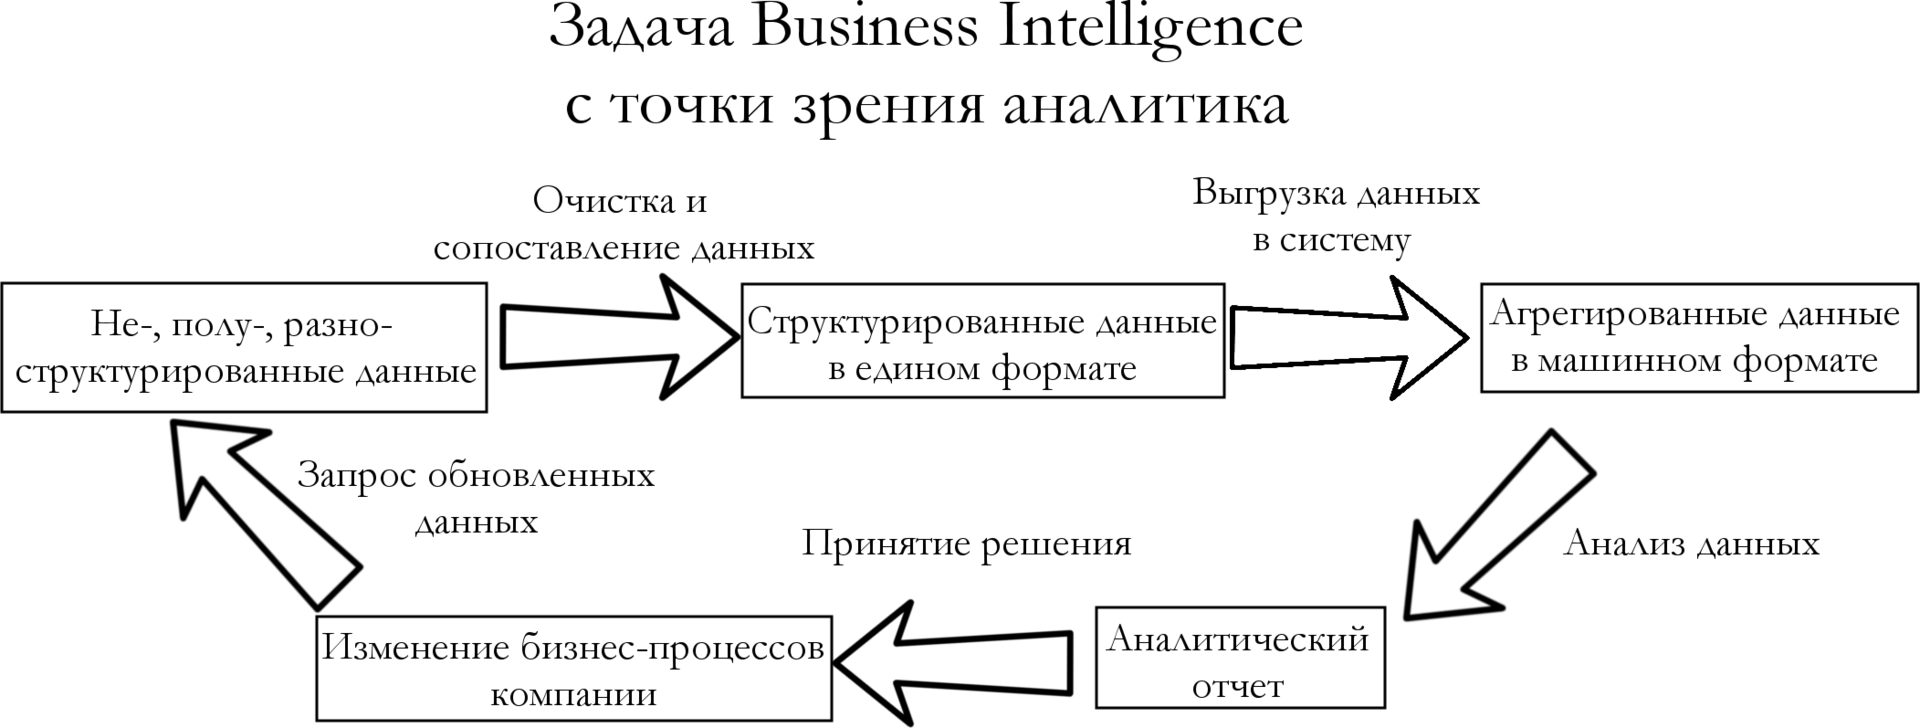
Imagine that we (a certain analyst Petrovich at the supplier Tsvetochka) are faced with the task of evaluating the sales of a number of stores (where we deliver the goods) and each store maintains its own inventory of goods sold. The reality is that the accounting forms will not be filled in as you don’t understand, that is, they will have a different structure and different storage format (some form of tables). Schematically, this task is depicted in the diagram above.
It would seem a simple task and therefore consider the frontal solution: suppose we have N tables and we need to collect them together into one table, then we will write N scripts that convert these tables and one collector that collects them together.
Cons of this approach:
If we rise to the level of the whole organization, we will see that there are even more problems.
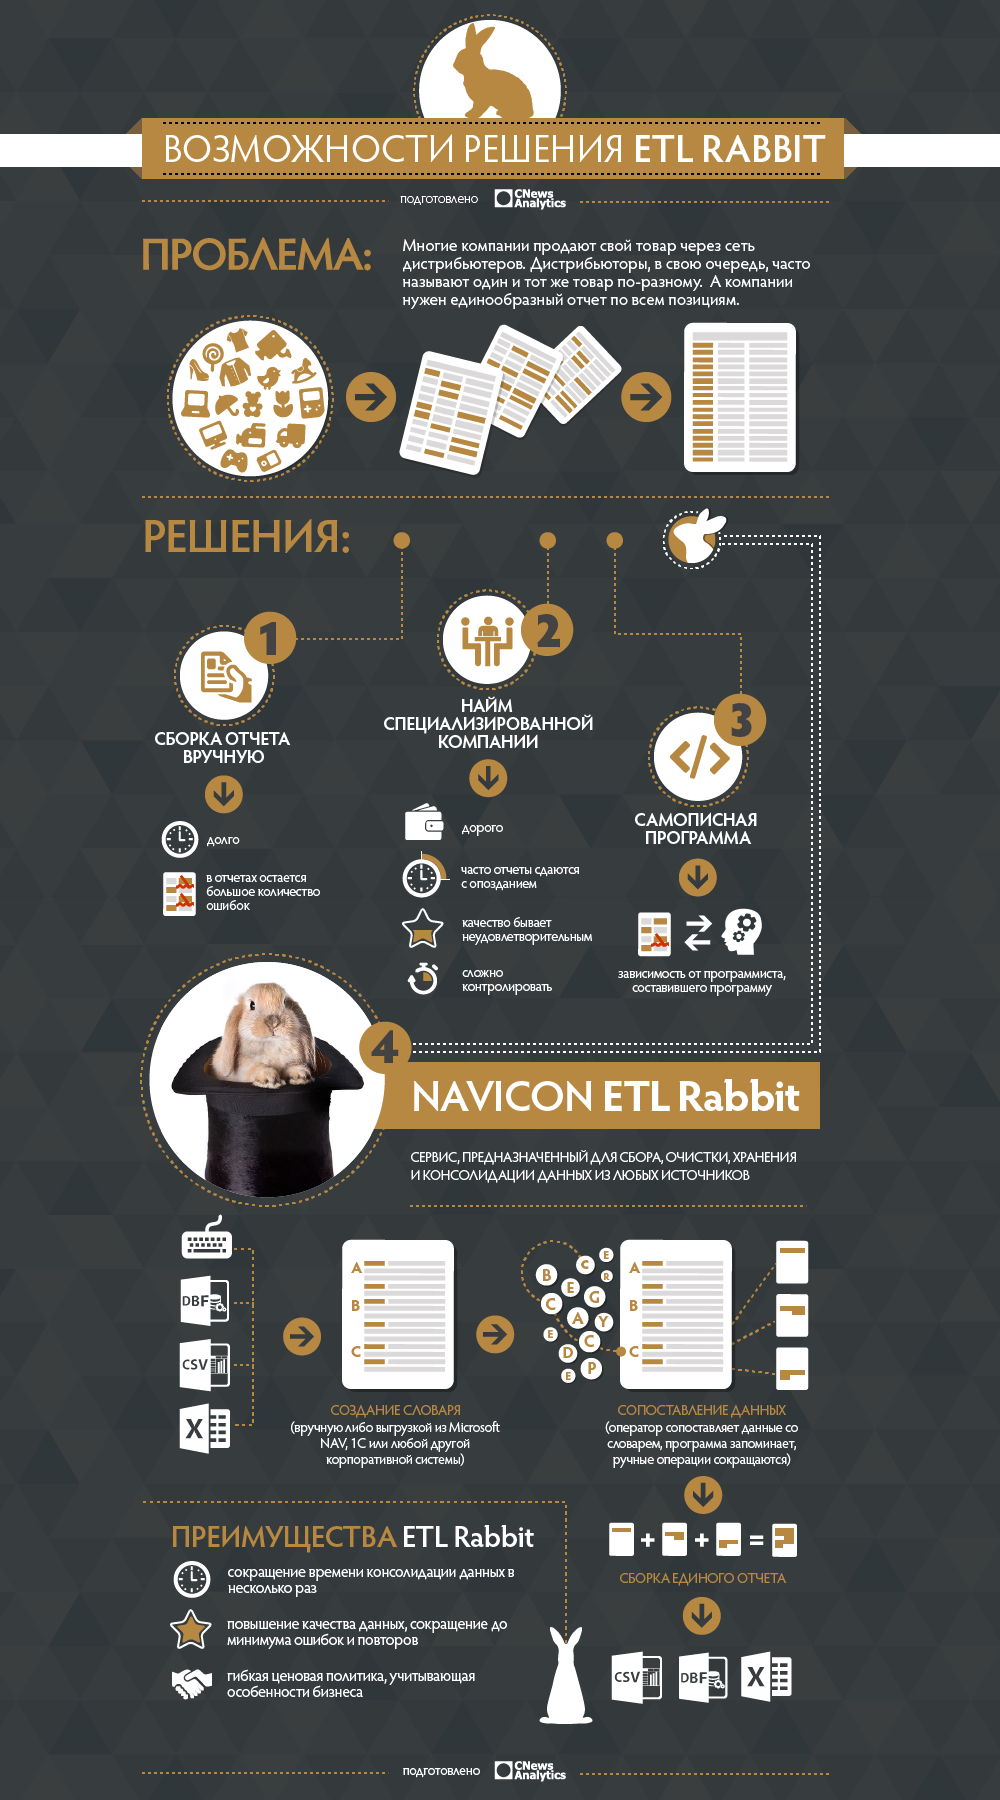
(clickable) Manufacturer Flower does not actually work directly with stores, but through some intermediaries. Intermediaries visit stores and directly try to stimulate sales through their actions. Accordingly, they are financially interested persons and the information that they issue, has to be double-checked. Fundamentally, the task looks similar: if we have N stores and K distributors, can we aggregate store data and compare them with distributor results? (Everyone has a different structure and format.)
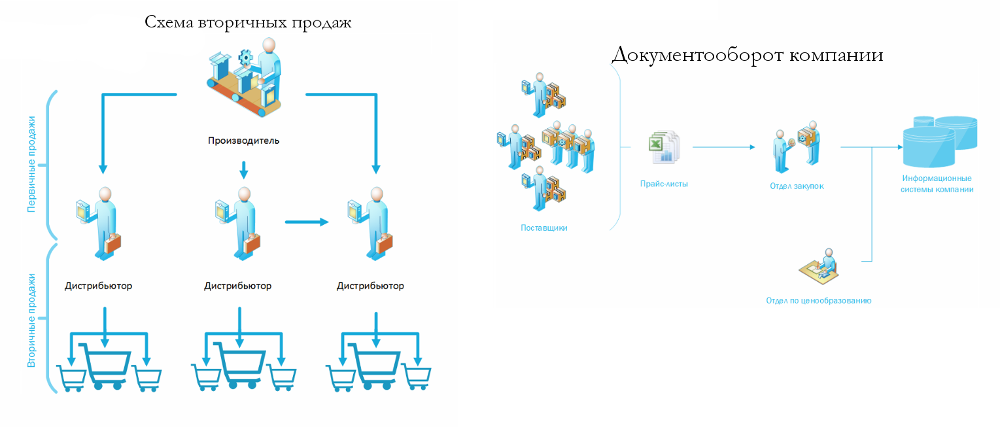
Here, in addition to tables, we may already encounter a whole zoo of formats, to which distributor reports are added. Typically, a task is characterized by very poor data quality, including duplication, inconsistency, and errors. Based on the results obtained and data comparison, the procurement department makes decisions about how much, to whom and why to ship. That is, the solution to this problem directly affects the financial performance of the company, which is certainly important.
Consider several solutions at the company level:
In general, if we are talking about a small or medium-sized manufacturer, then from the point of view of integration time, price and quality of the solution, the service looks like the best option, since the pricing is dynamic and integration is minimal via the web. As a rule, the advantage of corporate software is customizability and cryptomotion (each business considers itself unique), but the described task is quite typical and standard for a fairly wide range of companies. Of course, there is no single solution for everyone, but for each one it can be found.
More on the topic here .
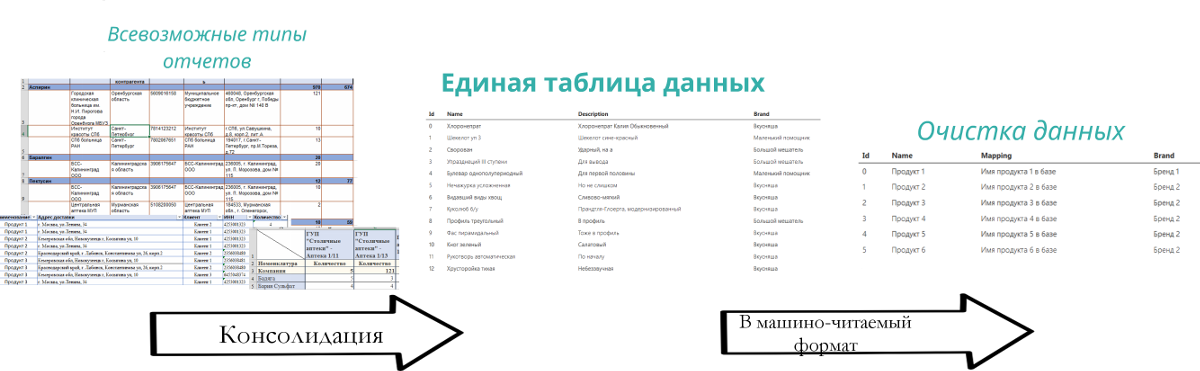
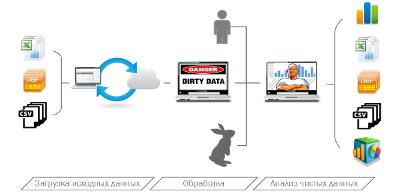
The process itself at the company level looks similar: data is consolidated, transformed (aggregated) in a certain way, and loaded into the system for analysis.
(clickable)
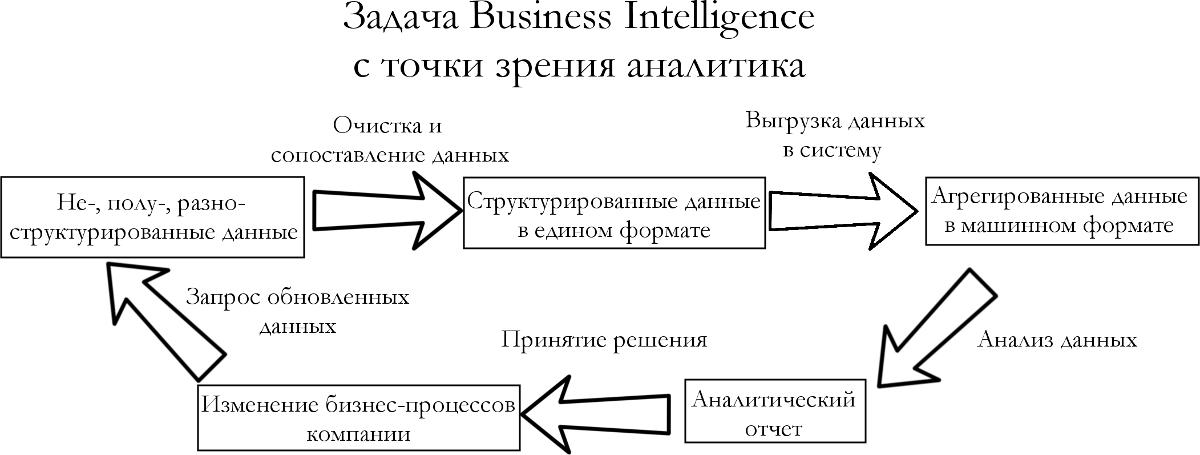
(clickable) What is the difference between analytics, data mining and business intelligence (BI)? The first includes a set of methods for analyzing already clean data, and in practice, cleaning and converting data into a format convenient for analysis is an important and integral process. In addition to working with data transformation and consolidation, the main task of BI is to make decisions for the business.
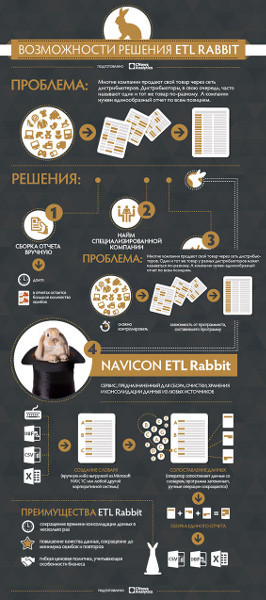
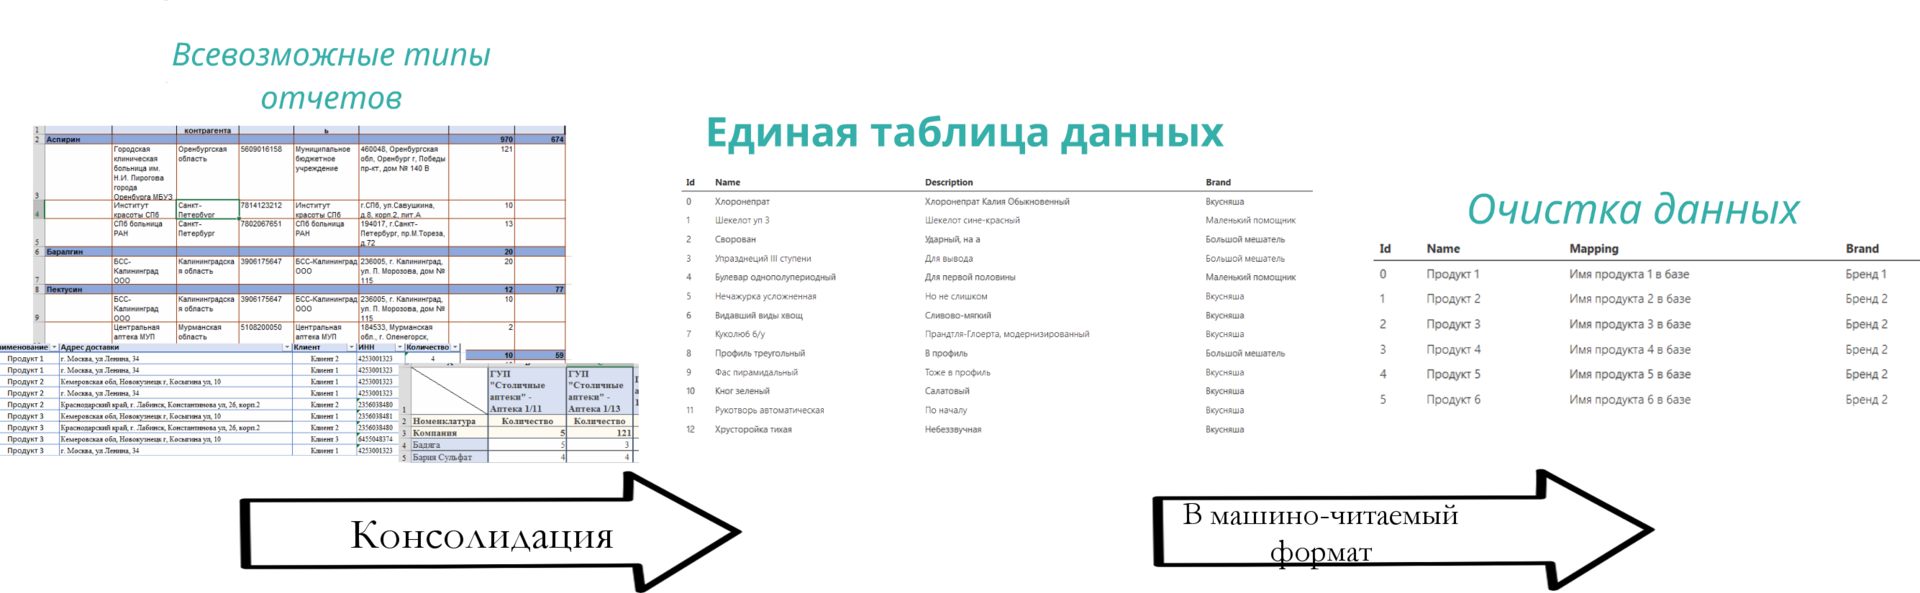
The data consolidation task is described in a schematic and slightly simplified form. If it is not possible to study the topic in detail, then this infographic gives a good first approximation of the problem and possible methods of solution. (clickable; taken from here )
(clickable) The service is free and available through a web link .
Article structure
- Why all this is needed: from the life of an analyst
- What is the challenge: a problem at the company level
- Summarize the task: all these are links of one chain
- Big infographic
- What you can experiment with
- What to read? Must read by Business Intelligence
Why all this is needed: from the life of an analyst
(clickable)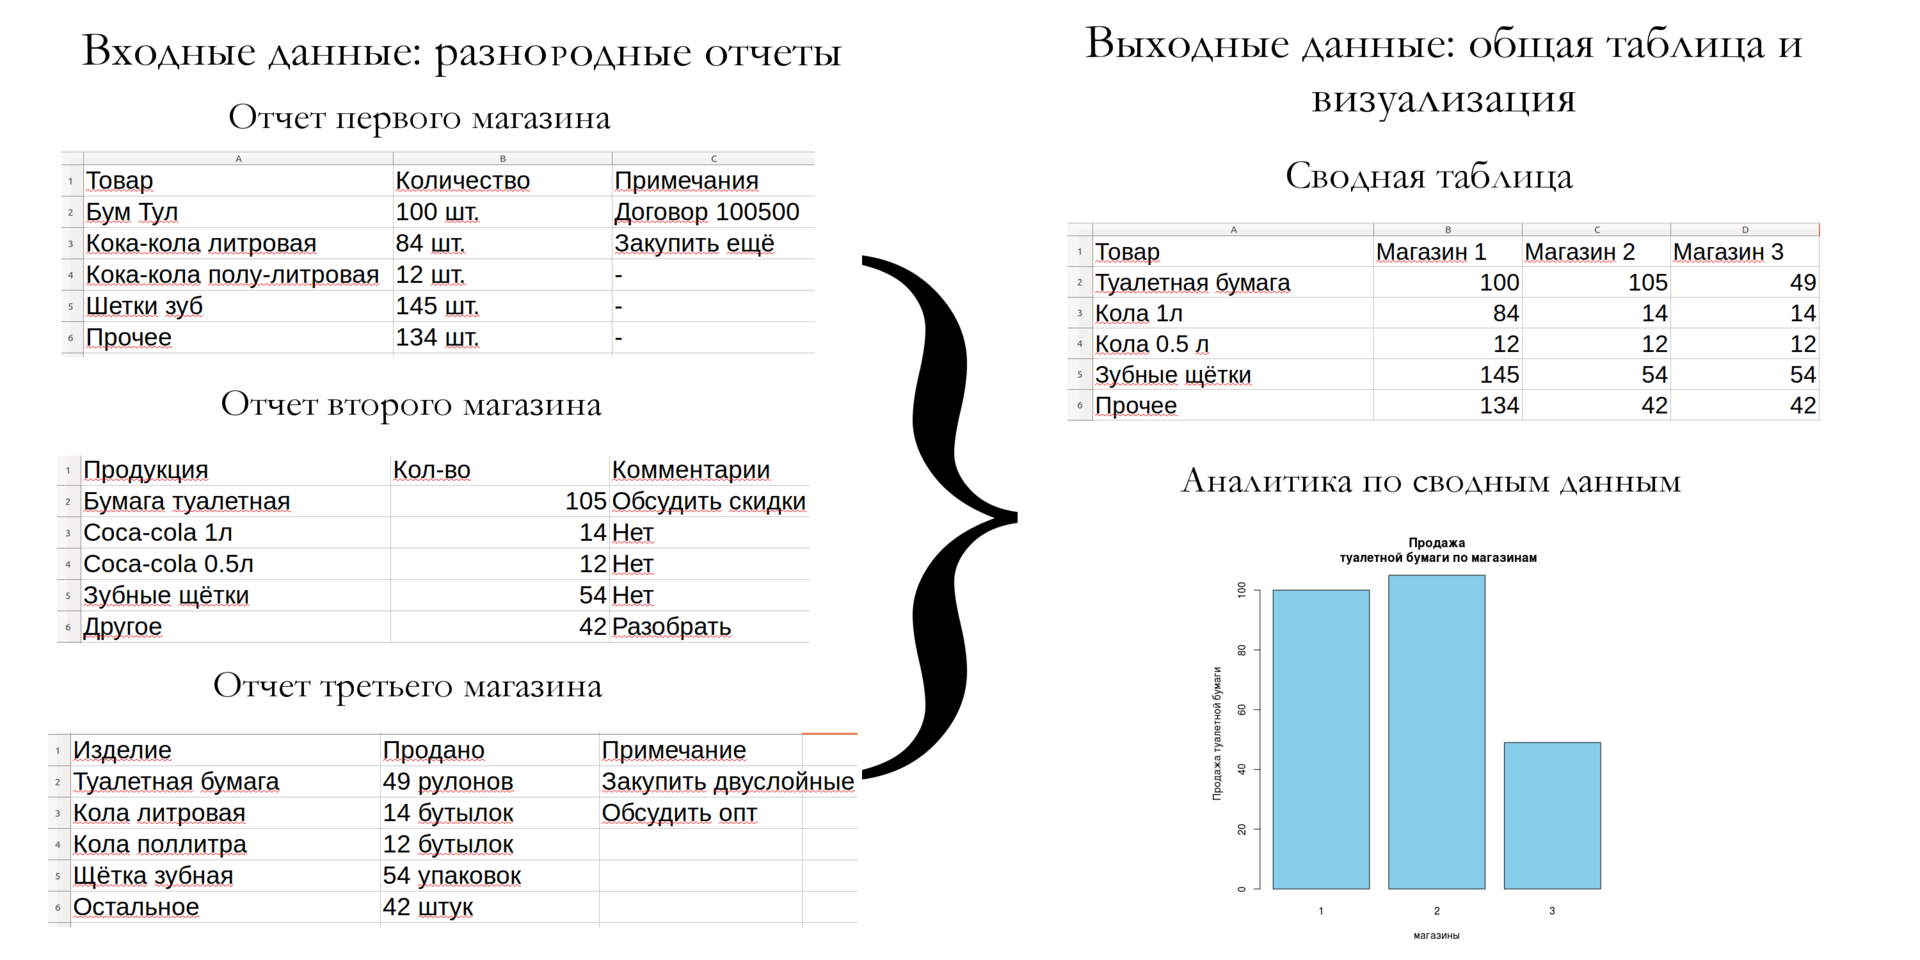
Imagine that we (a certain analyst Petrovich at the supplier Tsvetochka) are faced with the task of evaluating the sales of a number of stores (where we deliver the goods) and each store maintains its own inventory of goods sold. The reality is that the accounting forms will not be filled in as you don’t understand, that is, they will have a different structure and different storage format (some form of tables). Schematically, this task is depicted in the diagram above.
It would seem a simple task and therefore consider the frontal solution: suppose we have N tables and we need to collect them together into one table, then we will write N scripts that convert these tables and one collector that collects them together.
Cons of this approach:
- it is necessary to support N scripts at the same time (where N is in the order of thousands);
- when changing the structure of store reports over time (for example, a new employee has appeared in the store), it is necessary to search and rewrite individual scripts;
- when a new store appears, you must write a new script;
- when changing our reporting (supplier of Flower), it is necessary to make changes to all scripts;
- complex debugging and support, as stores do not notify about a change in structure and do not follow any specifications.
If we rise to the level of the whole organization, we will see that there are even more problems.
What is the challenge: a problem at the company level
(clickable) Manufacturer Flower does not actually work directly with stores, but through some intermediaries. Intermediaries visit stores and directly try to stimulate sales through their actions. Accordingly, they are financially interested persons and the information that they issue, has to be double-checked. Fundamentally, the task looks similar: if we have N stores and K distributors, can we aggregate store data and compare them with distributor results? (Everyone has a different structure and format.)
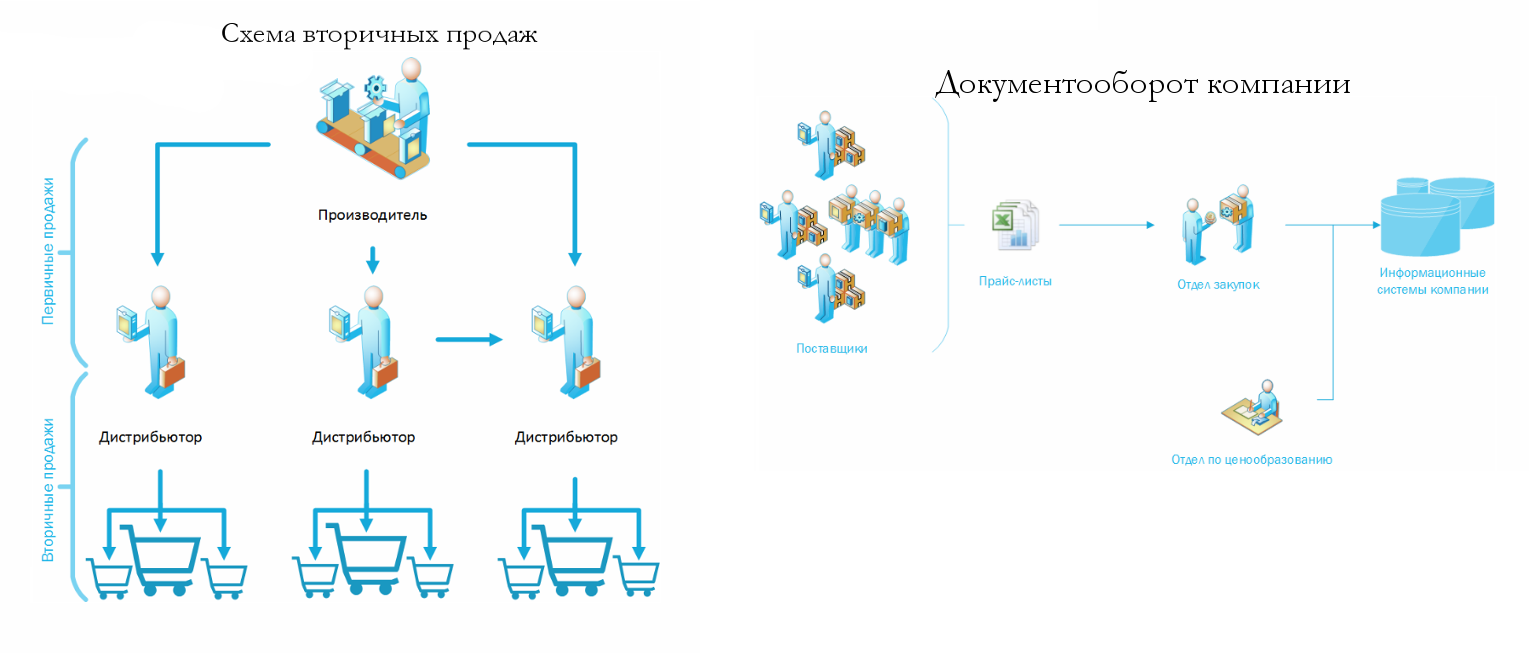
Here, in addition to tables, we may already encounter a whole zoo of formats, to which distributor reports are added. Typically, a task is characterized by very poor data quality, including duplication, inconsistency, and errors. Based on the results obtained and data comparison, the procurement department makes decisions about how much, to whom and why to ship. That is, the solution to this problem directly affects the financial performance of the company, which is certainly important.
Consider several solutions at the company level:
- a self-written solution: the company manufacturer will need to hire a specialist not on the profile of the company and critical software will depend on this specialist. If he leaves, the company will be forced to urgently seek a replacement that can support the software and the quality will directly depend on the specialist hired;
- to purchase software from a third party, there are three key factors: price, quality and integration time. As a rule, the price and integration time are too high for the average manufacturer, and also requires significant time costs for employees. The choice of supplier is also not trivial;
- SaaS solutions: the methodology is still new for the market and many companies are skeptical of such services.
In general, if we are talking about a small or medium-sized manufacturer, then from the point of view of integration time, price and quality of the solution, the service looks like the best option, since the pricing is dynamic and integration is minimal via the web. As a rule, the advantage of corporate software is customizability and cryptomotion (each business considers itself unique), but the described task is quite typical and standard for a fairly wide range of companies. Of course, there is no single solution for everyone, but for each one it can be found.
More on the topic here .
The process itself at the company level looks similar: data is consolidated, transformed (aggregated) in a certain way, and loaded into the system for analysis.
(clickable)
Summarize the task: all these are links of one chain
(clickable) What is the difference between analytics, data mining and business intelligence (BI)? The first includes a set of methods for analyzing already clean data, and in practice, cleaning and converting data into a format convenient for analysis is an important and integral process. In addition to working with data transformation and consolidation, the main task of BI is to make decisions for the business.
Big infographic
The data consolidation task is described in a schematic and slightly simplified form. If it is not possible to study the topic in detail, then this infographic gives a good first approximation of the problem and possible methods of solution. (clickable; taken from here )
What you can experiment with
(clickable) The service is free and available through a web link .

What to read? Must read by Business Intelligence
Only registered users can participate in the survey. Please come in.