December 28, 2014 at 18:02
Implementation of the Sunburst Chart in JavaScript and HTML5 Canvas

Hello! Today I would like to talk about how you can make your own graphics on js + canvas in just a couple of hundred lines of code. But at the same time remember the school course of geometry.
What for
There are enough cool libraries that can build graphs in the browser. And d3js has actually become the de facto standard. However, I really needed the sunburst diagram, so I didn’t want to drag tens or hundreds of kilobytes of library code with me. There was also a need for such a diagram to work quickly in mobile browsers, therefore, the implementation on svg was not suitable due to the lower performance of the latter compared to canvas. Scaling of the chart was not provided. Also, writing such a thing is a great way to follow the abc path .
What we visualize
Data for visualization has approximately the following format:
Sample data
{
    name: 'day',
    value: 24 * 60 * 60,
    children: [
        {
            name: 'work',
            value: 9 * 60 * 60,
            children: [
                {
                    name: 'coding',
                    value: 6 * 60 * 60,
                    children: [
                        {name: 'python', value: 4 * 60 * 60},
                        {name: 'js', value: 2 * 60 * 60}
                    ]
                },
                {name: 'communicate', value: 1.5 * 60 * 60}
            ]
        },
        {name: 'sleep', value: 7 * 60 * 60},
        ...
};
Those. we have a hierarchical structure, each node of which has a name and some value (value). You need to display them in something like this:
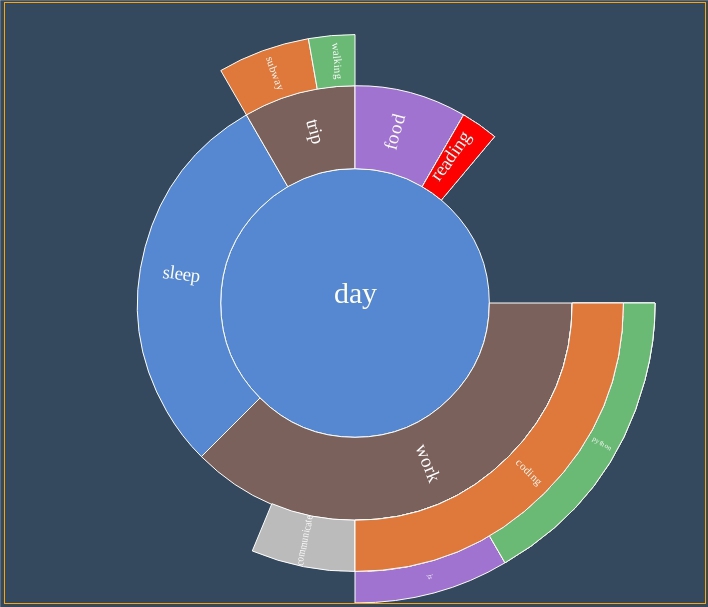
In this case, it is necessary to provide for the possibility of scaling the diagram by clicking on various areas, i.e. actually navigating through the data tree. As well as data editing, i.e. adding and removing nodes.
Opportunities
- The data should be relatively evenly distributed on the canvas, in compliance with the proportions - the farther the node is from the center, the less space it should take.
- Clicking on a node that is not currently root should increase the detail of the diagram.
- Clicking on the central node should reduce the detail of the diagram.
- The reaction of the diagram when hovering over is necessary, and two modes of selecting nodes: a separate node and the path from the center of the diagram to the selected node.
As a result, I would like to get some hybrid of this and this .
Implementation
Data location
In order to evenly distribute the data on the canvas, you must first find out their maximum nesting. This is fairly easy to do using the following recursive function:
function maxDeep(data) {
    var deeps = [];
    for (var i = 0, l = (data.children || []).length; i < l; i++) {
        deeps.push(maxDeep(data.children[i]));
    }
    return 1 + Math.max.apply(Math, deeps.length ? deeps : [0]);
};
The nesting depth of the data determines the number of layers (rings) in the diagram. All rings in total should occupy min (canvas.width, canvas.height) . Reducing the width of the rings from the center (maximum size) to the edges of the canvas (minimum size) occurs according to the golden ratio rule. Each subsequent ring is 1.62 times thinner than the previous one. Thus we have a recursive expression:
x + x / 1.62 + x / (1.62^2) + ... + x / (1,62^(n-1)) = min(canvas.width, canvas.height)
where n is the number of layers and x is the thickness of the root node. Thus x can be easily found using the following function:
function rootNodeWidth(n, canvasWidth, canvasHeight) {
    var canvasSize = Math.min(canvasWidth, canvasHeight), div = 1;
    for (var i = 1; i < n; i++) {
        div += 1 / Math.pow(1.62, i);
    }
    return canvasSize / 2 / div; // на 2 делим, так как ищем радиус корневого узла.
};
Further, when drawing the chart, we will simply divide the thickness of the current layer by 1.62 to get the thickness of the subsequent one.
Visualizing Chart Nodes
Before proceeding directly to rendering nodes, you need to perform some calculations. In particular, it is necessary to calculate the height of each of the nodes, determine the length of the node, the angle of the beginning and assign a color.
About determining the height has already been written above. The angles are calculated as follows: the central node is a circle, i.e. the angle between its lateral components is 360 degrees (2 Pi radians) and they merge into one line (we do not visualize it). The thickness of the central node is the radius of this circle.
All subsequent nodes are arcs wrapped around a central node.
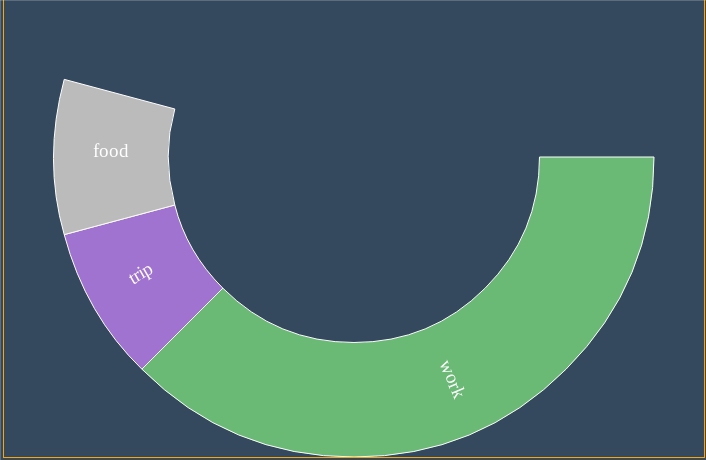
Nodes of the first (not central) level.
The length of the arc (i.e., the angle between its lateral components) is calculated based on the ratio of the value of the data (value) that corresponds to this arc and the data value of the parent node for this arc. Thus, if the central node has the value value = 100, and the first level node embedded in it has the value = 50, then the angle of the latter will be 180 degrees (50/100 = Pi / 2 Pi). This rule is applied recursively for each node in relation to its parent. If a node has 2 or more heirs, then the maximum angle of its first heir will be the minimum angle of the second and so on. All calculations go clockwise.
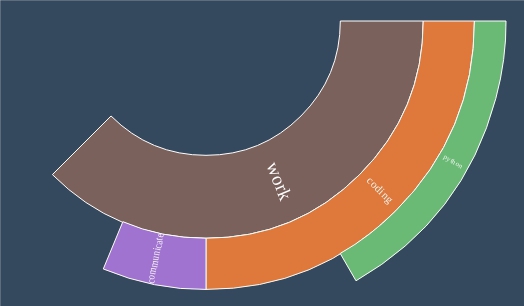
The ratio of the lengths of the arcs of nodes and value.
The color of nodes is assigned sequentially from the set of available. The above calculations can be performed by the following function:
function calcMetaData(dataRootNode, rootNodeWidth) {
    var startWidth = rootNodeWidth,
        meta = {
            root: {
                data: dataRootNode,
                color: pickColor(),
                angles: {begin: 0, end: 2 * Math.PI, abs: 2 * Math.PI}, // корневой узел - круг
                width: startWidth,
                offset: 0,
                children: [],
                scale: 1
            }
        },
        sibling;
    function calcChildMetaData(childDatum, parentMeta, sibling, scale) {
        var meta = {
            data: childDatum,
            color: pickColor(),
            parent: parentMeta,
            width: parentMeta.width / scale,
            offset: parentMeta.offset + parentMeta.width,
            children: [],
            scale: parentMeta.scale / scale
        }, childSibling;
        meta.angles = {abs: parentMeta.angles.abs * childDatum.value / parentMeta.data.value};
        meta.angles.begin = sibling ? sibling.angles.end : parentMeta.angles.begin;
        meta.angles.end = meta.angles.begin + meta.angles.abs;
        for (var i = 0, l = (childDatum.children || []).length; i < l; i++) {
            childSibling = calcChildMetaData(childDatum.children[i], meta, childSibling, scale);
            meta.children.push(childSibling);
        }
        return meta;
    }
    for (var i = 0, l = (dataRootNode.children || []).length; i < l; i++) {
        if (dataRootNode.children[i].value > dataRootNode.value) {
            console.error('Child value greater than parent value.', dataRootNode.children[i], dataRootNode);
            continue;
        }
        sibling = calcChildMetaData(dataRootNode.children[i], meta.root, sibling, 1.62);
        meta.root.children.push(sibling);
    }
    return meta;
};
The easiest way to draw a central node. To do this, make a closed arc using the arc () function , and then fill it with color.
var nodeMeta = {width: 20px, color: 'green', angles: {begin: 0, end: 2 * Math.PI}}; // параметры визуализации узла
var origin = {x: 250, y: 250};  // центр холста
var ctx = canvas.getContext('2d');
function drawRootNodeBody(nodeMeta, origin, ctx) {
        ctx.beginPath();
        ctx.arc(origin.x, origin.y, nodeMeta.width, nodeMeta.angles.begin, nodeMeta.angles.end); // окружность
        ctx.fillStyle = nodeMeta.color; // рисуем круг - заполняем окружность цветом
        ctx.fill();
        ctx.strokeStyle = 'white'; // рисуем границу узла - белого цвета
        ctx.stroke();
}
The remaining nodes draw a little more interesting. In fact, you need to draw a closed path of the desired shape, and then fill it with color.
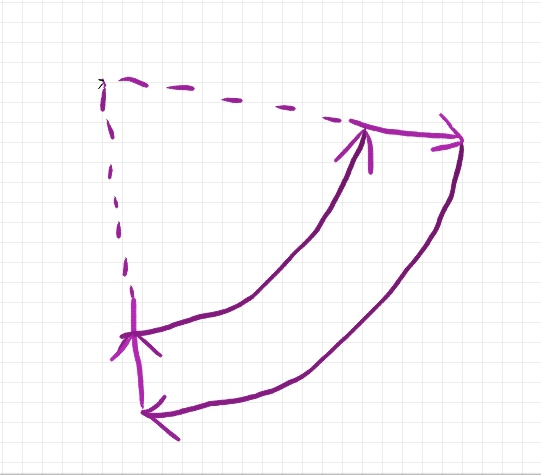
The path to the canvas that forms the node.
The sequence of drawing sections is indicated by arrows. Which side to start the drawing does not matter. We will start from the outer arc. Off-center nodes rendering function:
function drawChildNodeBody(nodeMeta, origin, ctx) {
        ctx.beginPath();
        ctx.arc(origin.x, origin.y, nodeMeta.offset, nodeMeta.angles.begin, nodeMeta.angles.end);  // внешняя дуга
        // нижняя боковая грань
        ctx.save();
        ctx.translate(origin.x, origin.y);  // перенос начала системы координат холста в центр диаграммы
        ctx.rotate(nodeMeta.angles.end);    // поворот холста, чтобы можно было провести
                                            // прямую линию от крайней точки дуги к центру диаграммы
        ctx.lineTo(nodeMeta.offset + nodeMeta.width, 0);
        ctx.restore(); // восстанавливаем начало системы координат и угол холста
        // внутренняя дуга
        ctx.arc(origin.x, origin.y, nodeMeta.offset + nodeMeta.width,
                nodeMeta.angles.end, nodeMeta.angles.begin, true);
        // замыкаем внутреннюю и внешнюю дуги - фактическ верхняя боковая грань.
        ctx.closePath();
        ctx.fillStyle = nodeMeta.hover ? 'red' : nodeMeta.color;
        ctx.fill();
        ctx.strokeStyle = 'white';
        ctx.stroke();
    }
Instead of turning the context to draw one of the side arcs, one could use Math.sin () (or Math.cos ()) the angle between the vertical (or horizontal) and the angle of rotation of the side component of the node. True, thanks to the rotation of the canvas, the code is greatly simplified. I wonder how this point affects rendering performance.
Defining a chart node by given coordinates
In order to further realize the scaling of the diagram with a click (or touch) and hover nodes, you need to learn how to determine the diagram node by coordinates on the canvas. This is easy to do, using the transition from the Cartesian to the polar coordinate system.
First, we determine the distance from the center of the chart (calculated before the start of rendering) to the click point (coordinates are known from the onclick event object) and the angle between the X axis and the segment connecting the center of the chart and this point.
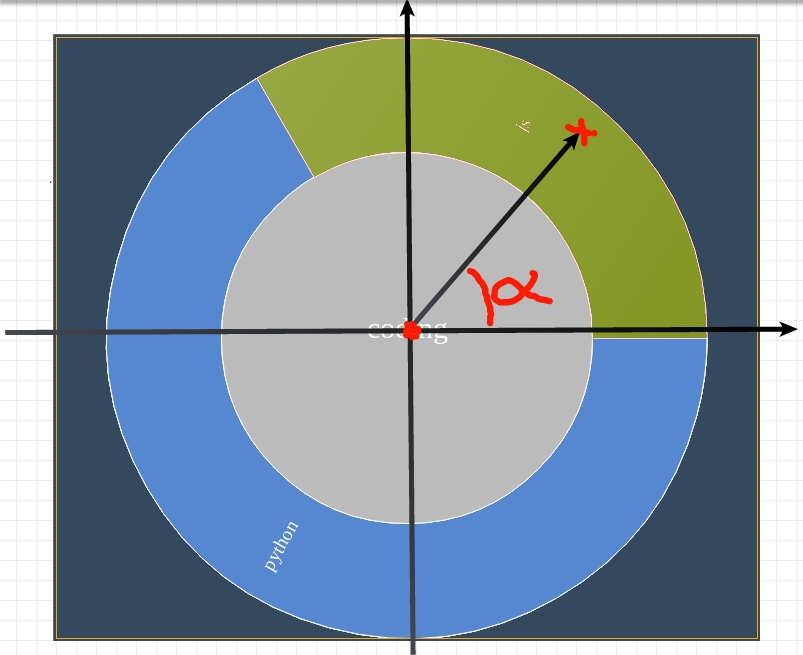
To do this, we need the following function:
function cartesianCoordsToPolarCoords(point, origin) {
    var difX = point.x - origin.x,
        difY = point.y - origin.y,
        distance = Math.sqrt(difX * difX + difY * difY),
        angle = Math.acos(difX / distance);
    if (difY < 0) {
        angle = 2 * Math.PI - angle;
    }
    return {dist: distance, angle: angle};
};
Now, if you recall that we previously made calculations of some metadata about each node, and they include the level width, the start angle and the length of each of the arcs of the nodes, you can find the node under the pointer by its polar coordinates in a very simple way:
function getNodeByPolarCoords(point, origin, metaData) {
    function _findNode(point, nodeMeta) {
        // Для начала проверяем текущий узел
        if (nodeMeta.offset >= point.dist) {
            // Если смещение его уровня относительно центра больше, чем distance,
            // то ни он, ни его наследники не могут быть нашей целью.
            return null;
        }
        if (nodeMeta.offset < point.dist && point.dist <= nodeMeta.offset + nodeMeta.width) {
            // Нашли уровень, теперь ищем узел в нем по углу.
            if (nodeMeta.angles.begin < point.angle && point.angle <= nodeMeta.angles.end) {
                return nodeMeta;
            }
        } else {
            // We need to go deeper. Поиск в наследниках текущего узла.
            var node;
            for (var i = 0, l = (nodeMeta.children || []).length; i < l; i++) {
                if (node = _findNode(point, nodeMeta.children[i])) {
                    return node;
                }
            }
        }
        return null;
    }
    return _findNode(point, metaData.root);
};
Chart Detail Change
For a more detailed examination of nodes located at the edges of the diagram, it is necessary to implement scaling by clicking on the node. In fact, this scenario is equivalent to re-drawing the diagram, but as the root data node, the one that was clicked should be selected. Similarly, when clicking on the central node, it is enough to find its ancestor in the data structure, and if it exists, draw a diagram, choosing the latter as the root node. Code reuse 100%.
Conclusion
Implementing graphics on js + canvas was actually not such a difficult task. It is enough to draw a little
A working example can be found at github.io .
The code is available in the github repository .