Npm universe
Hello friends!
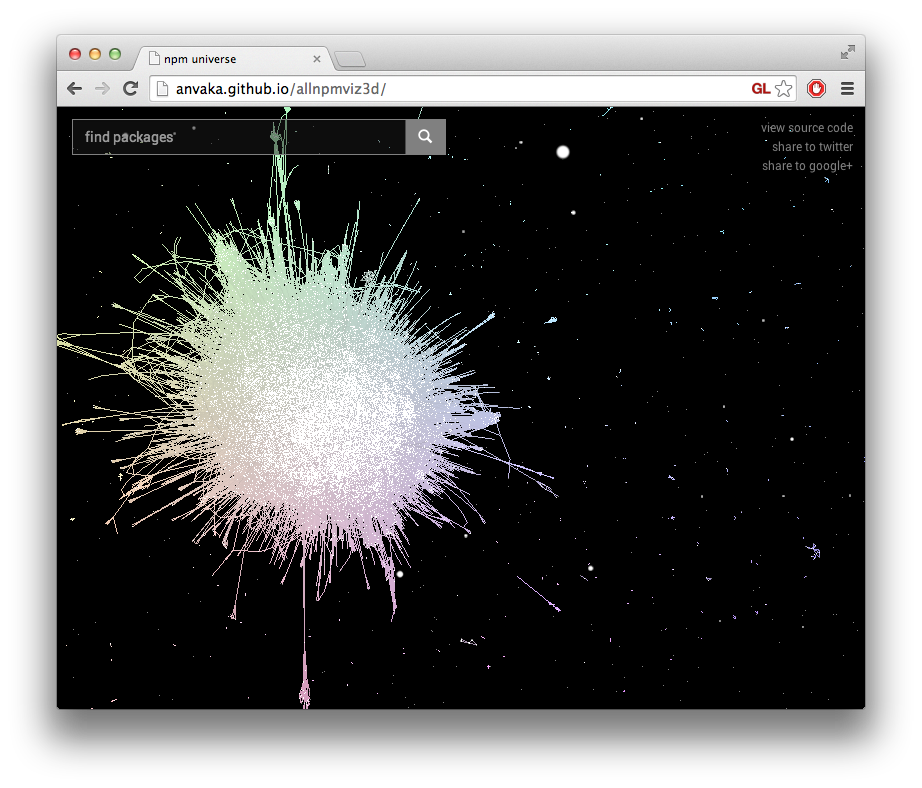
I wanted to share with you my latest mini-project: three-dimensional visualization of all npm. The universe looks something like this:

You can fly with the WASD keys, or if you watch it from the phone - just rotate the phone around (the phone must support WebGL).
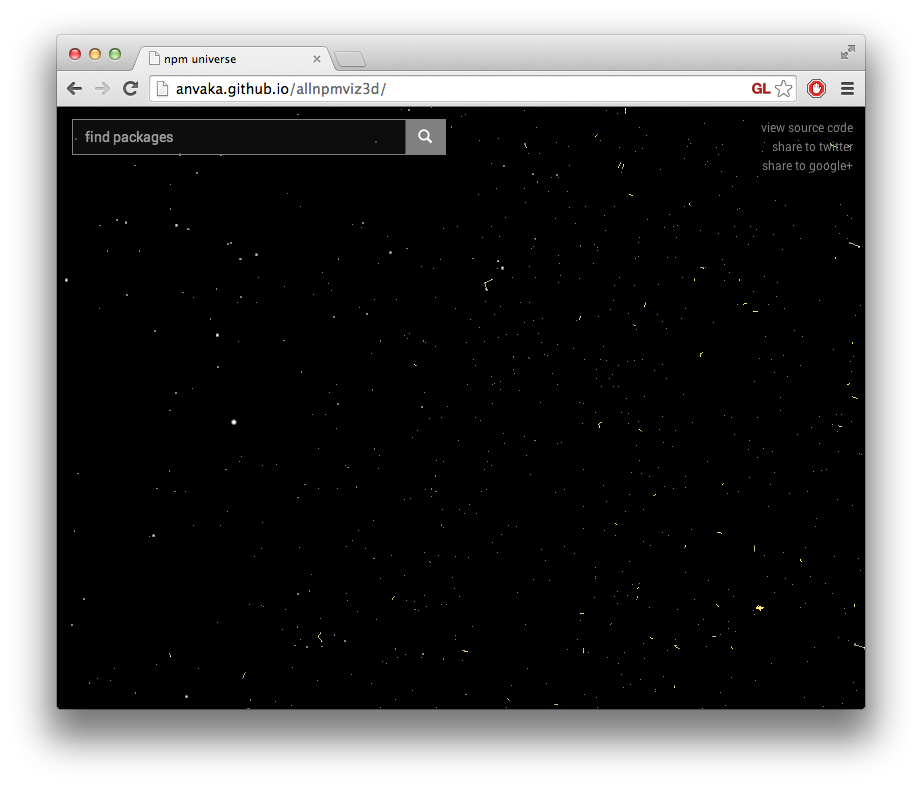
Many packages in the center, depend on monsters like lodash, request. A lot of isolated packages that form the asteroid ring:

All sources are here: github.com/anvaka/allnpmviz3d/
An interactive version is available here: anvaka.github.io/allnpmviz3d/
Video demonstration:
I hope you will like it! Under the cutter a little technical details on how this is done
The project is based on angular.js, twitter bootstrap and three.js. All project sources are written in CommonJS style, which makes it easy to structure the program and use ready-made modules from npm. I use gulp to create the final file. In gulpfile runs browserify for processing commonjs packages, and less to construct bootstrap styles.
The entire graph is initially stacked on the server, using modules from ngraph and the utilities from the allnpm package .
It was expensive to send a graph with information about 100 thousand nodes and 200+ thousand links in the forehead (for example, as JSON) - the graph is too large. Therefore, he came up with a special binary format for compact graph storage.
In this format, each node is specified by three 32-bit integers: the coordinates of the node x, y, z. The position of the nodes is sent in a continuous stream to the client. The client reads triples and remembers their index:
As soon as the client received this data, he begins to draw nodes in space. But how to convey the connection? Links are stored in a separate binary file. The file consists of sequentially written int32. Some numbers are negative, some are positive. By negative numbers, I mark the beginning of the next node, and positive numbers indicate which indices are associated with the last negative one.
For instance:
This means that vertex 1 is connected to vertex 2, and vertex 3 is connected to vertices 4 and 5. As a result, the entire graph is placed in 2.5 MB.
And finally, information about all names is sent in a separate json array. The index in the array corresponds to the index in the file with positions.
Watching for what. Angular.js is a great library for creating UIs. I use angular only to display search results and tooltips in the interface. The scene itself is drawn completely independently of angular.
Many of my colleagues say that choosing angular you choose all or nothing. It is difficult to refuse / replace angular if you have already started writing on it. I think they are right, because the implementation of dependencies and the module system in angular are extremely narrowly targeted.
But, if you refuse to use angular.module (), the code suddenly stops looking angular code. These are ordinary javascript functions, with normal parameters. And if so, they can also be easily created and shared on npm'e.
So I did. Replaced angular.module with a simple package that “accumulates” anuglar-like functions:
and then in one fell swoop it registers the accumulated functions when the site starts:
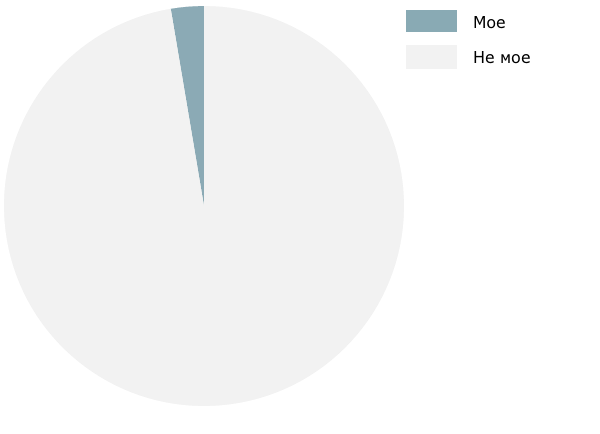
Thanks to npm and commonjs, the project consists of approximately 1,700 of my lines of code and 63,300 of mine:

I know that measuring code with lines is so-so scientific, but in general, the perception of the complexity of the project has been significantly improved using a modular approach.
The project also has an Easter egg. Since you, dear reader, have reached the very end, try entering in the search field
: i love npm
and the stars should answer you.
I hope you enjoyed it! I will be glad to your advice and comments!
I wanted to share with you my latest mini-project: three-dimensional visualization of all npm. The universe looks something like this:

You can fly with the WASD keys, or if you watch it from the phone - just rotate the phone around (the phone must support WebGL).
Many packages in the center, depend on monsters like lodash, request. A lot of isolated packages that form the asteroid ring:

All sources are here: github.com/anvaka/allnpmviz3d/
An interactive version is available here: anvaka.github.io/allnpmviz3d/
Video demonstration:
I hope you will like it! Under the cutter a little technical details on how this is done
How is this done?
The project is based on angular.js, twitter bootstrap and three.js. All project sources are written in CommonJS style, which makes it easy to structure the program and use ready-made modules from npm. I use gulp to create the final file. In gulpfile runs browserify for processing commonjs packages, and less to construct bootstrap styles.
The entire graph is initially stacked on the server, using modules from ngraph and the utilities from the allnpm package .
We send the graph to the client
It was expensive to send a graph with information about 100 thousand nodes and 200+ thousand links in the forehead (for example, as JSON) - the graph is too large. Therefore, he came up with a special binary format for compact graph storage.
In this format, each node is specified by three 32-bit integers: the coordinates of the node x, y, z. The position of the nodes is sent in a continuous stream to the client. The client reads triples and remembers their index:
Index  Position
1      x1, y1, z1
2      x2, y2, z2
As soon as the client received this data, he begins to draw nodes in space. But how to convey the connection? Links are stored in a separate binary file. The file consists of sequentially written int32. Some numbers are negative, some are positive. By negative numbers, I mark the beginning of the next node, and positive numbers indicate which indices are associated with the last negative one.
For instance:
-1 2 -3 4 5
This means that vertex 1 is connected to vertex 2, and vertex 3 is connected to vertices 4 and 5. As a result, the entire graph is placed in 2.5 MB.
And finally, information about all names is sent in a separate json array. The index in the array corresponds to the index in the file with positions.
Isn't angular slow?
Watching for what. Angular.js is a great library for creating UIs. I use angular only to display search results and tooltips in the interface. The scene itself is drawn completely independently of angular.
Many of my colleagues say that choosing angular you choose all or nothing. It is difficult to refuse / replace angular if you have already started writing on it. I think they are right, because the implementation of dependencies and the module system in angular are extremely narrowly targeted.
But, if you refuse to use angular.module (), the code suddenly stops looking angular code. These are ordinary javascript functions, with normal parameters. And if so, they can also be easily created and shared on npm'e.
So I did. Replaced angular.module with a simple package that “accumulates” anuglar-like functions:
module.exports = require('an').controller(myController);
function myControlelr($scope) {
  $scope.message = "Привет Хабр!";
}
and then in one fell swoop it registers the accumulated functions when the site starts:
var ngApp = angular.module('allnpmviz3d', []);
require('an').flush(ngApp);
angular.bootstrap(document, [ngApp.name]);
// Теперь myController - вполне закономерный житель в мире angular.js
Final notes
Thanks to npm and commonjs, the project consists of approximately 1,700 of my lines of code and 63,300 of mine:

I know that measuring code with lines is so-so scientific, but in general, the perception of the complexity of the project has been significantly improved using a modular approach.
The project also has an Easter egg. Since you, dear reader, have reached the very end, try entering in the search field
: i love npm
and the stars should answer you.
I hope you enjoyed it! I will be glad to your advice and comments!
