Configuring PostgreSQL monitoring in Zabbix

PostgreSQL is a modern, dynamically developing DBMS with a very large set of features that allow you to solve the widest range of tasks. Using PostgreSQL usually refers to a very critical segment of the IT infrastructure that is associated with the processing and storage of data. Given the special place of the DBMS in the infrastructure and the degree of criticality of the tasks assigned to it, the question arises of monitoring and proper control over the operation of the DBMS. In this regard, PostgreSQL has extensive internal tools for collecting and storing statistics. The collected statistics allows you to get a fairly detailed picture of what is happening under the hood during the operation of the DBMS. These statistics are stored in special system view tables and are constantly updated.
Below I describe the method and tools for monitoring PostgreSQL in the Zabbix monitoring system. I like this monitoring system because it provides ample opportunities for implementing the most custom monitoring of a wide variety of systems and processes.
Monitoring will be based on SQL queries to statistics tables. The queries themselves are executed as an additional configuration file for the zabbix agent, in which SQL queries are wrapped in the so-called UserParameters - user monitoring parameters. The user parameter in Zabbix is a great way that allows you to configure monitoring for non-standard things, such things in our case will be PostgreSQL operation parameters. Each user parameter consists of two elements: the name of the key andTeam . A key name is a unique name that does not intersect with other key names. A command is the actual action command that the zabbix agent must execute. In an extended version, various parameters can be passed to this command. In the zabbix configuration, it looks like this:
UserParameter=custom.simple.key,/usr/local/bin/simple-script
UserParameter=custom.ext.key[*],/usr/local/bin/ext-script $1 $2
Thus, all queries to PostgreSQL statistics are psql client queries wrapped in user parameters.
Strengths:
- minimum requirements for configuring the monitored node - in the simplest case, add the config and restart the zabbix agent (a difficult case involves adjusting the access rights to PostgreSQL);
- the settings for connecting to PostgreSQL, as well as threshold values for triggers, are performed through macro variables in the web interface - this way you do not need to get into triggers and produce a template in case of different threshold values for different hosts (macros can be assigned to the host);
- a wide range of data collected (connections, transaction times, statistics on databases and tables, streaming replication, etc.);
- low-level discovery for databases, tables, and stand-by servers.
Weaknesses:
- there are a lot of observed parameters, maybe someone wants to disable something.
- Depending on the version of PostgreSQL, some things will not work. In particular, this concerns replication monitoring, as some functions are simply not available in older versions. It was written with an eye on version 9.2 and higher.
- Also, for some things, the presence of the installed extensions pg_stat_statements and pg_buffercache is required - if the extensions are not installed, some of the parameters will be inaccessible for observation.
Monitoring Capabilities:
- information on the volume of allocated and recorded buffers, checkpoints and recording time in the process of checkpoints - pg_stat_bgwriter
- general information on shared buffers - the pg_buffercache extension is required here . I also want to note that requests for these statistics are resource-intensive, which is reflected in the documentation for the extension, so depending on the needs, you can either increase the polling interval or turn off the parameters completely.
- general information on the service - uptime, response time, cache hit ratio, average request time.
- information on client connections and query / transaction execution time - pg_stat_activity .
- database size and summary statistics for all databases (commits / rollbacks, read / write, temporary files) - pg_stat_database
- private statistics (read / write, number of service tasks such as vacuum / analyze) - pg_stat_user_tables , pg_statio_user_tables .
- information on streaming replication (server status, number of replicas, lag with them) - pg_stat_replication
- other things (number of rows in the table, trigger existence, configuration parameters, WAL logs)
Additionally, it is worth noting that in order to collect statistical data, it is necessary to include the following parameters in postgresql.conf:
track_activities - includes tracking commands (queries / statements) by all client processes;
track_counts - includes collecting statistics on tables and indexes;
Installation and setup.
Everything you need to configure is in the Github repository.
# git clone https://github.com/lesovsky/zabbix-extensions/
# cp zabbix-extensions/files/postgresql/postgresql.conf /etc/zabbix/zabbix_agentd.d/
Further, it should be noted that in order to execute requests from the agent, it is necessary that the appropriate access is defined in the pg_hba configuration - the agent must be able to establish connections with the postgres service in the target database and execute requests. In the simplest case, you need to add the following line to pg_hba.conf (for different distributions, the file location may differ) - allow connections on behalf of postgres to mydb database with localhost.
host mydb postgres 127.0.0.1/32 trust
It is unforgettable that after changing pg_hba.conf, the postgresql service needs to do reload (pg_ctl reload). However, this is the easiest option and not entirely secure, so if you want to use a password or more complex access scheme, then carefully read pg_hba and .pgpass again .
So the configuration file is copied, it remains to load it into the main configuration, make sure that in the main agent configuration file, there is an Include line with the path indicated where the additional configuration files are located. Now we restart the agent, after which we can check the work by performing the simplest check - we use pgsql.ping and in square brackets specify the options for connecting to postgres, which will be passed to psql to the client.
# systemctl restart zabbix-agent.service
# zabbix-get -s 127.0.0.1 -k pgsql.ping['-h 127.0.0.1 -p 5432 -U postgres -d mydb']
If you correctly registered the access, then the service response time in milliseconds will be returned to you. If an empty string is returned, then there is a problem with access to pg_hba. If the string ZBX_NOTSUPPORTED is returned - the configuration did not load, check the agent config, the paths to Include and the rights set to the config.
When the verification team returns the correct answer, it remains to download the template and upload it to the web interface and assign it to the target host. You can also download the template from the repository (postgresql-extended-template.xml). After importing, you need to go to the macros settings tab of the template and configure them.

Below is a list and a brief description:
- PG_CONNINFO - these are the connection parameters that will be passed to the psql client when executing the request. This is the most important macro since defines the parameters for connecting to the postgres service. The default string is more or less universal for any cases, however, if you have several servers and each server has different settings, then you can define a macro with the same name for the hosts in the zabbix and set it to an individual value. When checking, the host macro takes precedence over the template macro.
- PG_CONNINFO_STANDBY - these are the connection parameters that will be passed to the psql utility when executing a request to the stanby server (determining the replication lag).
- PG_CACHE_HIT_RATIO - this is the threshold value for the trigger on the percentage of successful hit in the cache; the trigger will work if the hit percentage is below this mark;
- PG_CHECKPOINTS_REQ_THRESHOLD - threshold for on-demand checkpoints
- PG_CONFLICTS_THRESHOLD - threshold value for conflicts that occurred when executing requests on standby servers;
- PG_CONN_IDLE_IN_TRANSACTION - threshold value for connections that opened a transaction and do nothing at the same time (bad transactions);
- PG_CONN_TOTAL_PCT - threshold value for the percentage of open connections to the maximum possible number of connections (if 100%, then everything, the connections are over);
- PG_CONN_WAITING - threshold value for blocked requests that are waiting for other requests to complete;
- PG_DATABASE_SIZE_THRESHOLD - threshold value for the database size;
- PG_DEADLOCKS_THRESHOLD - threshold value for deadlocks (fortunately they are resolved automatically, but it is advisable to be aware of their availability, as this is direct evidence of poorly written code);
- PG_LONG_QUERY_THRESHOLD - threshold value for query execution time; the trigger will work if there are requests whose execution time is longer than this mark;
- PG_PING_THRESHOLD_MS - threshold value for the response time of the service;
- PG_SR_LAG_BYTE - threshold value for replication lag in bytes;
- PG_SR_LAG_SEC - threshold value for replication lag in seconds;
- PG_UPTIME_THRESHOLD - uptime threshold value, if uptime below the mark means the service was restarted;
From the text of the triggers it should become clear why these threshold values are needed:
- PostgreSQL active transaction to long - fixed a long transaction or query;
- PostgreSQL cache hit ratio too low - cache hit rate too low;
- PostgreSQL deadlock occured - deadlock fixed;
- PostgreSQL idle in transaction connections to high - many connections in idle in transaction state;
- PostgreSQL idle transaction to long - fixed a long transaction in idel in transaction state;
- PostgreSQL number of waiting connections to high - a query or transaction is pending;
- PostgreSQL recovery conflict occured - conflict detected during recovery on the replica;
- PostgreSQL required checkpoints occurs to frequently - checkpoints happen too often;
- PostgreSQL response to long - long response time;
- PostgreSQL service not running - the service is not running;
- PostgreSQL service was restarted - the service has restarted;
- PostgreSQL total number of connections to high - the total number of connections is too large and approaches max_connections;
- PostgreSQL waiting transaction to long - a request is too long or a transaction is pending;
- PostgreSQL database {#DBNAME} to large - database size is too large;
- PostgreSQL streaming lag between {HOSTNAME} and {#HOTSTANDBY} to high - the replication lag between the servers is too large.
Low Level Discovery Rules
- PostgreSQL databases discovery - detection of existing databases with the ability to filter by regular expressions. When detected, a size chart is added;
- PostgreSQL database tables discovery - detection of existing tables in a monitored database with the ability to filter by regular expressions. Be careful with the filter and add only those tables that are really interesting to you, because this rule generates 21 parameters for each table found. When detected, graphs are added about sizes, scans, row changes and reading statistics.
- PostgreSQL streaming stand-by discovery - discovery of connected replicas. Upon detection, a schedule with replication lag is added.
Available graphs, if we talk about graphs, I tried to group the observed parameters, while not overloading the graphs with an excessively large number of parameters. So the information from pg_stat_user_tables is spaced into 4 graphs.
- PostgreSQL bgwriter - general information about what happens with buffers (how much is allocated, how much and how is written).
- PostgreSQL buffers - general information on the status of shared buffers (how many buffers, how many are used, how many dirty buffers).
- PostgreSQL checkpoints - information on occurring checkpoints.
- PostgreSQL connections - information on client connections.
- PostgreSQL service responce - service response time and average query execution time.
- PostgreSQL summary db stats: block hit / read - read from cache and from disk.
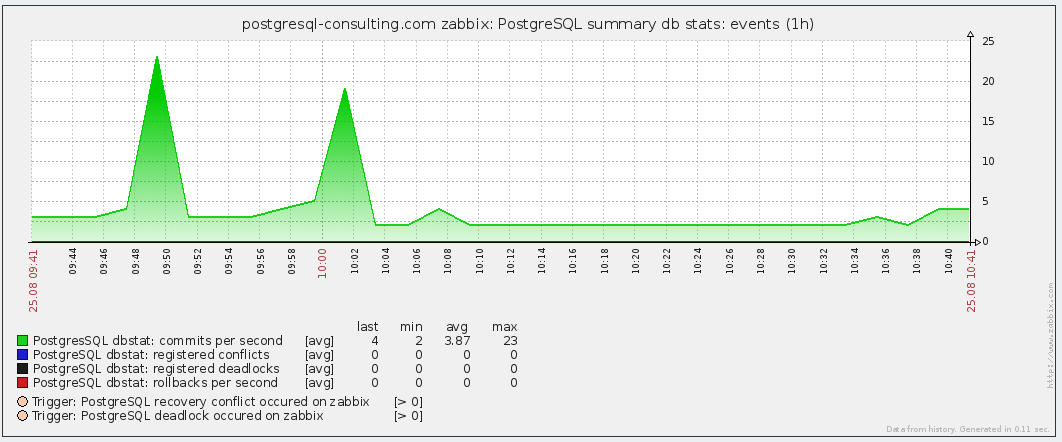
- PostgreSQL summary db stats: events - events in the database (deadlocks, conflicts, commits, rollbacks).
- PostgreSQL summary db stats: temp files - information on temporary files.
- PostgreSQL summary db stats: tuples - general information on row changes.
- PostgreSQL transactions - query execution time.
- PostgreSQL uptime - uptime and percentage of cache hit.
- PostgreSQL write-ahead log - information on the WAL log (recording volume and number of files).
- PostgreSQL: database {#DBNAME} size - information on resizing the database.
- PostgreSQL table {#TABLENAME} maintenance - table maintenance operations (autovacuum, autoanalyze, vacuum, analyze).
- PostgreSQL table {#TABLENAME} read stats - statistics on reading from the cache, disk.
- PostgreSQL table {#TABLENAME} rows - change in rows.
- PostgreSQL table {#TABLENAME} scans - scan information (sequential / index scans).
- PostgreSQL table {#TABLENAME} size - information on the size of tables and their indexes.
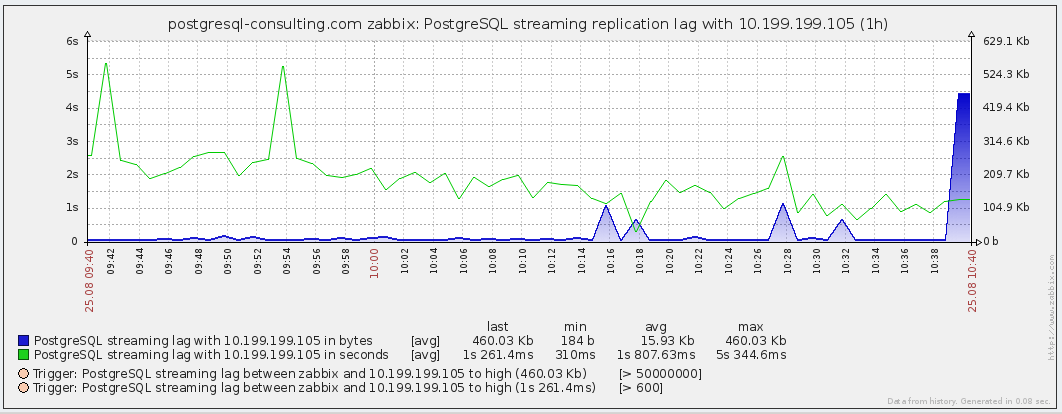
- PostgreSQL streaming replication lag with {#HOTSTANDBY} - size of replication lag with replica servers.
In conclusion, a few example graphs:
Here, as we can see, temporary files are regularly created in the database, you should look for the culprit in the log and review work_mem.

Here the events taking place in the database - commits / rollbacks and conflicts / deadlocks - in general, everything is fine here.
Here the state of streaming replication with one of the servers is the lag time in seconds and bytes.
And the final schedule is the service response time and the average request time.

That's all, thank you all for your attention!