August 19, 2014 at 16:01
Testing NetApp E2700
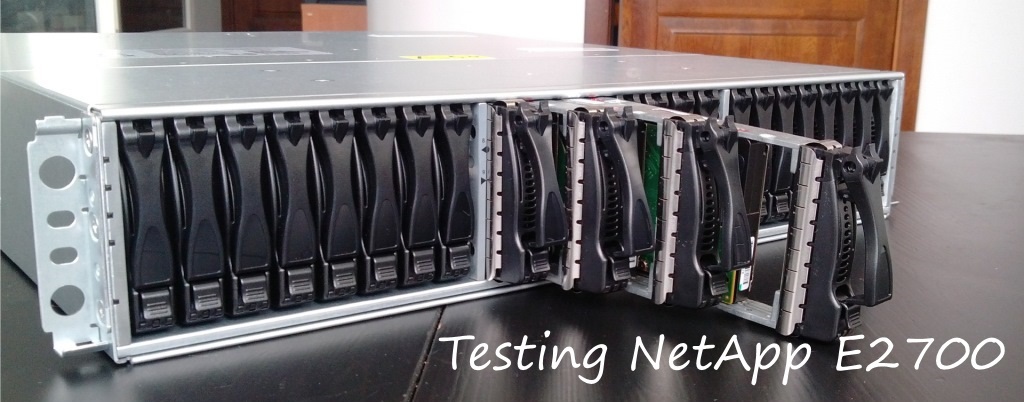
For a long time I didn’t come across tests of an entry-level array, capable of passing up to 1.5 Gb / s through a single controller with streaming load. NetApp E2700 just coped with this task. In June, I hosted the Unboxing NetApp E2700 . And now I am ready to share with you the results of testing this storage system. Below I present the results of load tests and the resulting quantitative performance indicators of the NetApp E-Series 2700 array (IOps, Throughput, Latency).
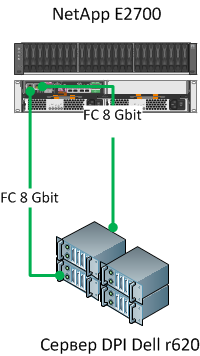
The configuration of the disk array is as follows:
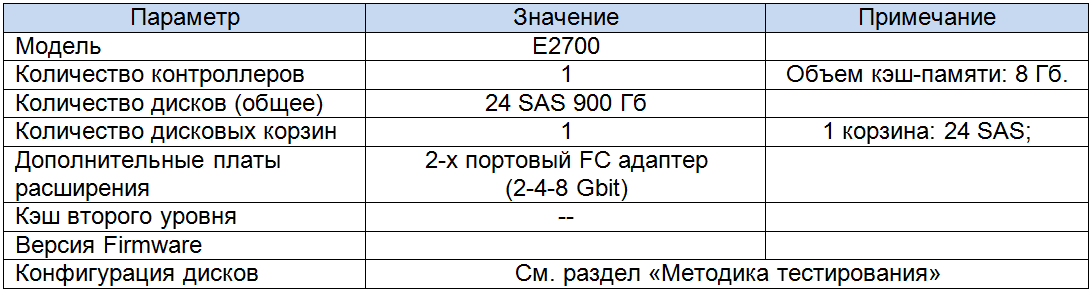
The scheme for connecting the array to the server:
And the configuration of the test server:

Testing Methodology
As a load generator I use FIO benchmark, as the most “true” benchmark under Linux. I want to get data on average speed (bandwith, Mb / s) and average delays (latency, ms) under the following types of load:
- 100% sequential reading, in blocks of 256 kb, 512 Kb and 1024 Kb;
- 100% sequential recording, in blocks of 256 kb, 512 Kb and 1024 Kb;
- Mixed sequential read / write (50/50), in blocks of 256 kb, 512 Kb and 1024 Kb;
- 100% random reading, in blocks of 4 kb, 8 Kb and 16 Kb;
- 100% random recording, in blocks of 4 kb, 8 Kb and 16 Kb;
- Mixed random read / write (50/50), in blocks of 256 kb, 512 Kb and 1024 Kb;
In this case, I will use two LUNs from the array, each 1 TB in size, which are available at the server level as RAW devices: sdb and sdc.
An important point of my tests is comparing the performance of the different RAID levels that the array supports. Therefore, I will alternately apply the load to the LUNs created on: DDP, RAID6, RAID10. And I will create Dynamic Disk Pool and Volume Groups on the basis of all 24 disks.
In order not to make the results dependent on the operation algorithm of the notorious “Linux memory cache”, I use block devices without organizing a file system on top of them. Of course, this is not the most standard configuration for streaming applications, but it is important for me to understand what exactly an array is capable of. Although, looking ahead, I’ll say that when using the direct = 1 and buffered = 0 parameters in the FIO load pattern, working (writing) with files at EXT4 level shows almost the same results with bandwith block devices. At the same time, latency indicators when working with the file system are 15-20 percent higher than when working with raw devices.
The load pattern for FIO is configured as follows:
[global]
description = seq-reads
ioengine = libaio
bs = cm. above
direct = 1
buffered = 0
rw = [write, read, rw, randwrite, randread, randrw]
runtime = 900
thread
[sdb]
filename = / dev / sdc
iodepth = see below
[sdc]
filename = / dev / sdb
iodepth = see below
If I understood correctly, man by fio, the iodepth parameter, determines the number of independent threads working with the disk at the same time. Accordingly, in the configuration, I get the number of threads equal to X * 2 (4, 8, 16).
As a result, the test suite I got the following: We
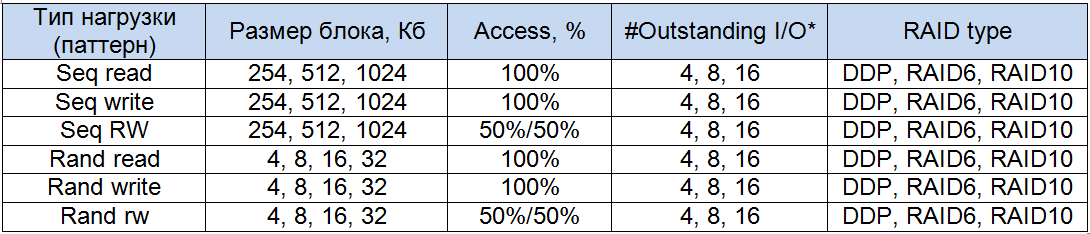
figured out the techniques, determined the patterns, give the load. To facilitate the work of the administrator, you can cut a set of FIO patterns in the form of separate files, in which the values of two parameters - bs and iodepth - will change. Then you can write a script that, in a double cycle (changing the values of two parameters), will run all our patterns with saving the indicators we need into separate files.
Yes, I almost forgot a couple of points. At the array level, I configured the cache settings as follows:
- for streaming recording, I turned off the read cache;
- for streaming reading, turned off, respectively, the write cache, and did not use the dynamic read prefetch algorithm;
- for mixed read and write operations, the cache is fully activated.
At the Linux level, I changed the regular I / O scheduler to noop for streaming operations and to deadline for random operations. In addition, to correctly balance the traffic at the HBA level, I installed the multipath driver from NetApp, MPP / RDAC. The results of his work pleasantly surprised me, the flow of data between the HBA ports was balanced almost 50-by-50, which I have never seen with Qlogic or with regular linux multipathd.
SANTricity has a number of tuning parameters (I wrote above, for example, about managing data caching at the volume level). Another potentially interesting parameter is the Segment Size, which can be set and changed at the volume level. Segment Size is a block that the controller writes to one disk (data inside the segment is written in blocks of 512 bytes). If I use DDP, then the size of this parameter for all volumes created in the pool is the same, (128k) and it cannot be changed.
For volumes created on the basis of VolumeGroup, I can choose pre-configured load patterns for the volume (FileSystem, Database, Multimedia). In addition, I can choose the SegmentSize size myself in the range from 32 Kb to 512 Kb.
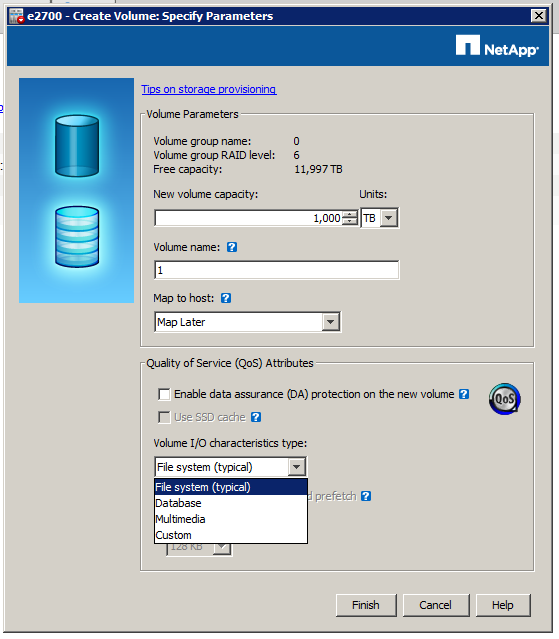
In general, for the built-in Volume I / O characteristics type, the size of the Segment Size is not very diverse:
- For the pattern File system = 128 Kb;
- For the pattern Database = 128 Kb;
- For the pattern Multimedia = 256 Kb.
I did not change the default (File system) pattern when creating the volume so that the Segment Size for the volumes created on the DDP and on the regular VolumeGroup is the same.
Of course, I played around with the Segment Size to understand how it affects the performance of write operations (for example). The results are quite standard:
- With the smallest size, SS = 32 Kb, I get higher performance in operations with small block sizes;
- With the largest size, SS = 1024 Kb, I get higher performance in operations with large block sizes;
- If I align the SS size and the block size that FIO operates with, the results are even better;
- There is one “but.” I noticed that when streaming recording in large blocks and SS = 1024 Kb, the latency values are higher than with the size SS = 128 Kb or 256 Kb.
In total, the usefulness of this parameter is obvious, and if we assume that we will have many random operations, then it makes sense to set it to 32 Kb (unless, of course, we use DDP). For streaming operations, I see no reason to set the SS value to the maximum, because I did not observe a dramatic increase in data transfer speed, and latency indicators can be critical for the application.
Results (evaluation and comparison of results)
DDP
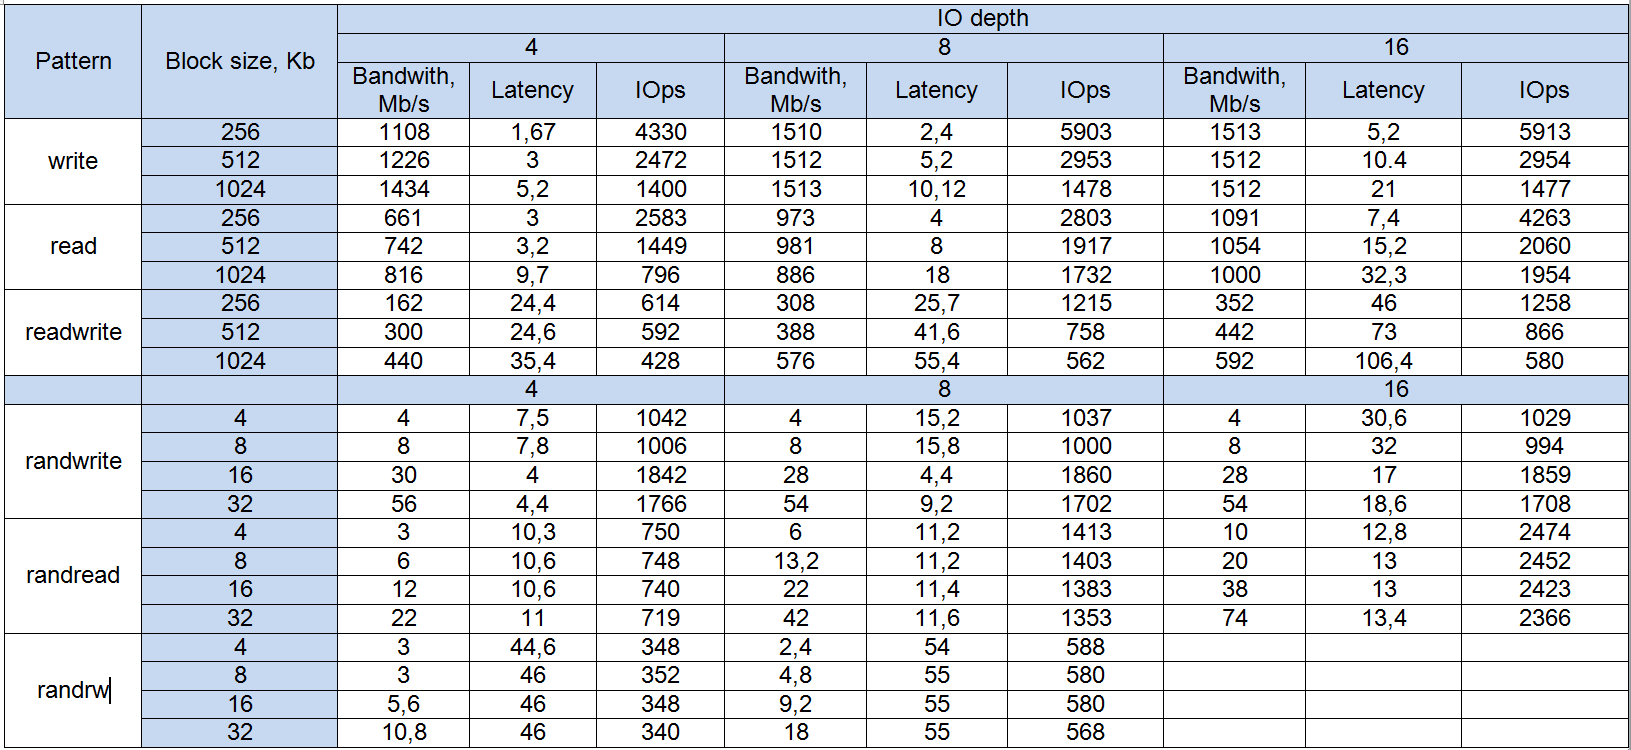
Test Results RAID6 Test

Results RAID10 Test Results
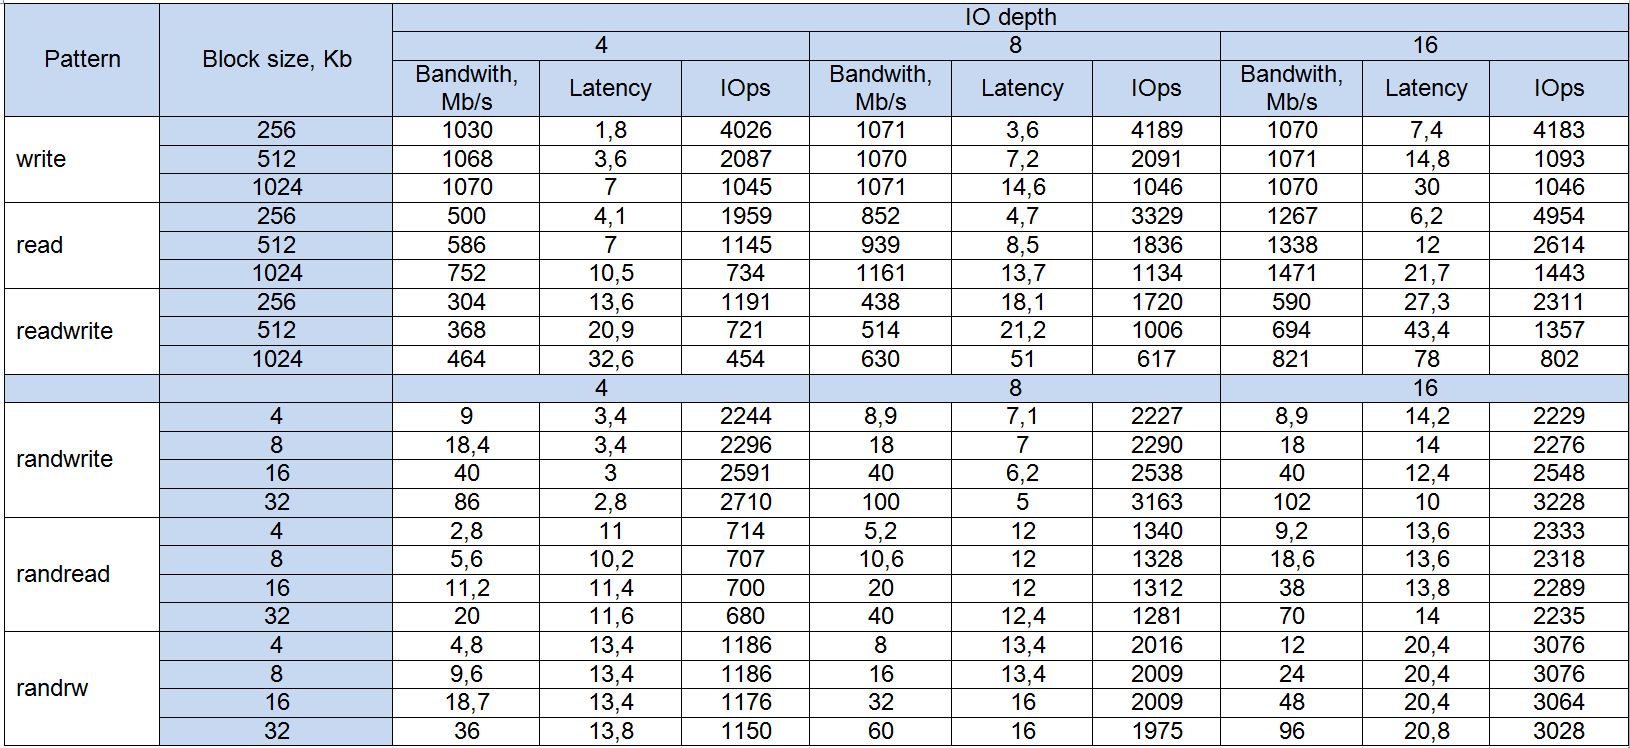
Evaluation of the results
- The first point that I immediately drew attention to is the 0% use of the read cache for any pattern (and even when the write cache is completely turned off). It was not possible to understand what it was connected with, but the results on read operations sagged significantly compared with write operations. Perhaps this is due to the single-controller configuration of the test array, as the read cache should be mirrored between the two controllers.
- The second point is the rather low rates for random operations. This is explained by the fact that the size of the Segment Size (as I wrote above) was used by default equal to 128 Kb. For small block sizes, this SS size is not suitable. For verification, I ran a random load on volumes in RAID6 and RAID10 with SS = 32 Kb. The results were much more interesting. But in the case of DDP, we are not able to change the size of the SS, so a random load on the DDP is contraindicated.
- If we compare the performance of DDP, RAID6, and RAID10 with the size of SS = 128 Kb, then we can track the following patterns:
- In general, there is no significant difference between the three different logical representations of the blocks;
- RAID10 more stable holds the load, even mixed, giving at the same time the best latency, but loses in the write and read speeds of RAID6 and DDP;
- RAID6 and DDP during random operations with increasing block size show the best latency and IOps values. Most likely, this is due to the size of the SS (see above). However, RAID10 did not show such an effect;
- As I wrote above, a random load for DDP is contraindicated, in any case, with block sizes less than 32 Kb.
conclusions
For a long time I did not come across tests of an entry-level array, capable of passing up to 1.5 Gb / s through a single controller with streaming load. It can be assumed that the dual-controller configuration will be able to handle up to 3 Gb / s. And this is a data stream up to 24 Gb / s.
Of course, the tests used by us are synthetic. But the results shown are very good. As expected, the array weakly holds a mixed load during random operations, but there are no miracles :-).
In terms of usability and the ability to optimize settings for a specific load pattern for an entry-level array, the E2700 has proved to be on top. SANTricity has a clear and fairly simple interface, a minimum of glitches and brakes. There are no unnecessary settings for values that are often not clear (I recall the control interface of the IBM DS 4500 - it was something)). In general, everything is solid “4”.