Plotting a wavy line through the Bezier Curves
Good time of day, Khabrovsk residents. Today I want to tell you about drawing a symmetrical wavy line using Bezier Curves using only 2 points.
When creating CAD-systems, often there is a need to draw not just straight lines, but wavy or broken lines. Since in both cases the line is symmetrical with respect to the line passing through the start and end points, it is necessary to calculate points lying on parallel main lines. How to do this will be discussed below.
Consider a small segment. The Bezier curve for this segment should remotely resemble a sine wave. Although it will not appear to her.
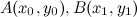
Let A be the starting point and B the end point.
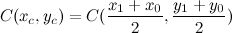
Point C is the midpoint of segment AB
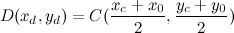
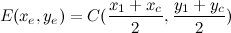
Points D and E are the midpoints of segments AC and CB, respectively.
Now it is necessary to obtain points D 'and E'. These points have one property - they belong to segments that are parallel to AB, but are at a distance from it.
Consider a vector . It is necessary to find two vectors that are perpendicular to the vector .


This is an ordinary linear equation with two variables, which, as you know, has an infinite number of solutions.
To find the first solution, we take for a parameter that affects the length of the vector.
Then the coordinates of the first vector will be equal: The

second perpendicular vector is calculated based on the first.

To obtain the coordinates of points D 'and E', must be added to the coordinates of the point coordinates of the vector Dand to the coordinates of the point E - coordinates of the vector  .
.
Knowing the coordinates of points A, D ', E' and B, we can construct a zigzag or Bezier curve.
Draw a Bezier curve using GDI + technology using Windows Forms.
To start, let's describe the Vector2 class
We also declare a couple of variables for storing parameters
Now write the code to draw.
Now it remains to call this method for your Graphics object.
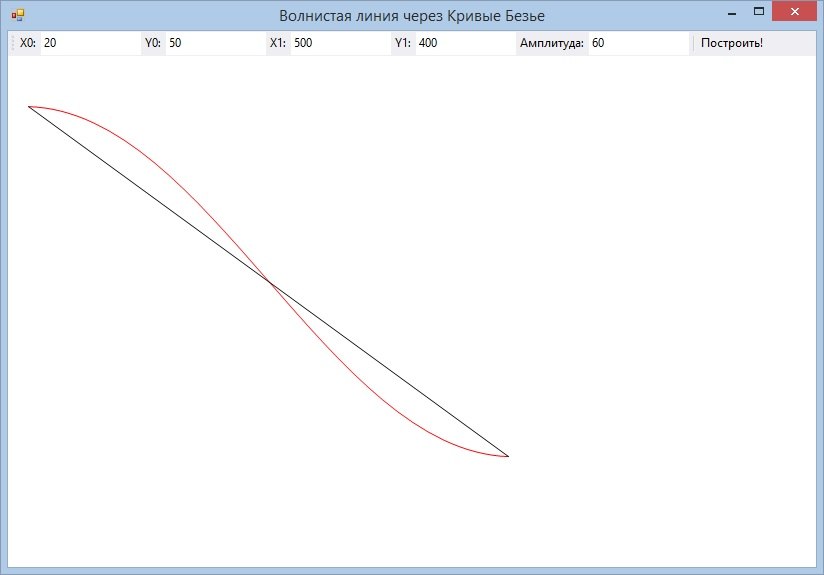
As a result of the method, something like this should turn out:
And now we change the “Amplitude” parameter (aka parameter a). We get another result:
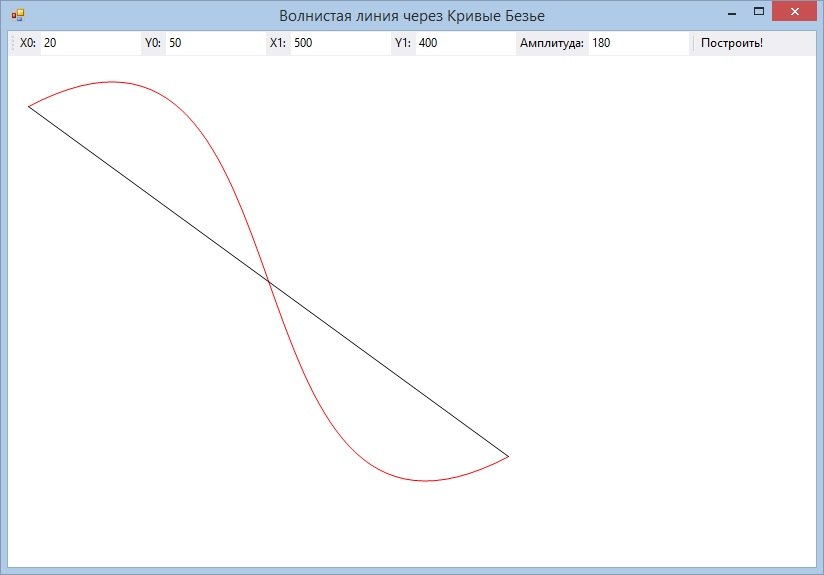
Obviously, this parameter influences the Bezier curve itself quite strongly, resembling the strength of the thread tension or the amplitude of the sinusoid.
To make the curve dependent on amplitude, you cannormalize the vector before calculating , and then multiply it by a scalar - by amplitude.
Then the length of the perpendicular vectors is equal to the amplitude.
Thank you all for your attention.
Foreword
When creating CAD-systems, often there is a need to draw not just straight lines, but wavy or broken lines. Since in both cases the line is symmetrical with respect to the line passing through the start and end points, it is necessary to calculate points lying on parallel main lines. How to do this will be discussed below.
A bit of math
Consider a small segment. The Bezier curve for this segment should remotely resemble a sine wave. Although it will not appear to her.
Let A be the starting point and B the end point.
Point C is the midpoint of segment AB
Points D and E are the midpoints of segments AC and CB, respectively.
Now it is necessary to obtain points D 'and E'. These points have one property - they belong to segments that are parallel to AB, but are at a distance from it.
Consider a vector
. It is necessary to find two vectors that are perpendicular to the vector . This is an ordinary linear equation with two variables, which, as you know, has an infinite number of solutions.
To find the first solution, we take
for a parameter that affects the length of the vector.Then the coordinates of the first vector
will be equal: The second perpendicular vector is calculated based on the first.
To obtain the coordinates of points D 'and E', must be added to the coordinates of the point coordinates of the vector D
and to the coordinates of the point E - coordinates of the vector . Knowing the coordinates of points A, D ', E' and B, we can construct a zigzag or Bezier curve.
A bit of programming
Draw a Bezier curve using GDI + technology using Windows Forms.
To start, let's describe the Vector2 class
public class Vector2
{
  public int X,Y //координаты вектора
  //конструктор
  public Vector2(int x,  int y)
  {
     X=x;
     Y=y;
  }
}
We also declare a couple of variables for storing parameters
 int x0,y0;//координаты первой точки
 int x1,y1;//координаты второй точки
 int amplitude;//параметр a
 Pen pen = new Pen(new SolidBrush(Color.Black)); //кисть для рисования простой линии
  Pen pen2 = new Pen(new SolidBrush(Color.Red));//кисть для рисования кривой.
Now write the code to draw.
 public void Draw(Graphics g)
 {
            g.SmoothingMode = SmoothingMode.HighQuality; //включаем Anti-Aliasing
            // координаты стартовой точки
            Point mainStart = new Point(x0, y0);
            // координаты конечной точки
            Point mainEnd = new Point(x1, y1);
            //С - середина отрезка AB
            Point mainCenter0 = new Point((mainStart.X + mainEnd.X) / 2, (mainStart.Y + mainEnd.Y) / 2);
            //D- середина отрезка AС
            Point mainCenter1 = new Point((mainStart.X + mainCenter0.X) / 2, (mainStart.Y + mainCenter0.Y) / 2);
            //E- середина отрезка СB
            Point mainCenter2 = new Point((mainCenter0.X + mainEnd.X) / 2, (mainCenter0.Y + mainEnd.Y) / 2);
            //Вектор AB
            Vector2 lineVector = new Vector2(mainEnd.X - mainStart.X,  mainEnd.Y - mainStart.Y );
            //вектор a1
            Vector2 orthoVector1 = new Vector2( amplitude,  -lineVector.X * amplitude / lineVector.Y );
            //вектор a2
            Vector2 orthoVector2 = new Vector2(-orthoVector1.X, -orthoVector1.Y);
            //очищаем экран
            g.Clear(Color.White);
            //транслируем точку D в точку D'
            mainCenter1.Offset(orthoVector1.x, orthoVector1.y);
            //транслируем точку E в точку E'
            mainCenter2.Offset(orthoVector2.x, orthoVector2.y);
            //рисуем кривую Безье
            g.DrawBezier(pen2, mainStart, mainCenter1, mainCenter2, mainEnd);
            //рисуем простую линию
            g.DrawLine(pen, mainStart, mainEnd);
}
Now it remains to call this method for your Graphics object.
As a result of the method, something like this should turn out:
And now we change the “Amplitude” parameter (aka parameter a). We get another result:
Obviously, this parameter influences the Bezier curve itself quite strongly, resembling the strength of the thread tension or the amplitude of the sinusoid.
To make the curve dependent on amplitude, you can
normalize the vector before calculating , and then multiply it by a scalar - by amplitude. Then the length of the perpendicular vectors is equal to the amplitude.
Thank you all for your attention.