How to draw a black hole. Geodesic ray tracing in a curved space-time
- Transfer
“It's easy. We take the Schwarzschild metric, look for the Christoffel symbols, calculate their derivative, write the geodesic equation, change some Cartesian coordinates (so as not to suffer), obtain a large multi-line ODE - and solve it. Like that".
Now it is clear that black holes sucked me. They are infinitely exciting. The last time I dealt with the visualization of Schwarzschild geometry. I was absorbed by the problem of accurately representing how the curvature of such a space-time affects the appearance of the sky (since photons from distant sources move along geodetic lines bent by a black hole) to create interactive modeling. Here is the result
(works in the browser). The trick is to maximize the pre-calculated deflection of light rays. Everything works more or less normally, but of course, such a simulation is far from ideal, because in reality no tracing is done there (for non-specialists: restoring the location of the light rays falling into the camera back in time).
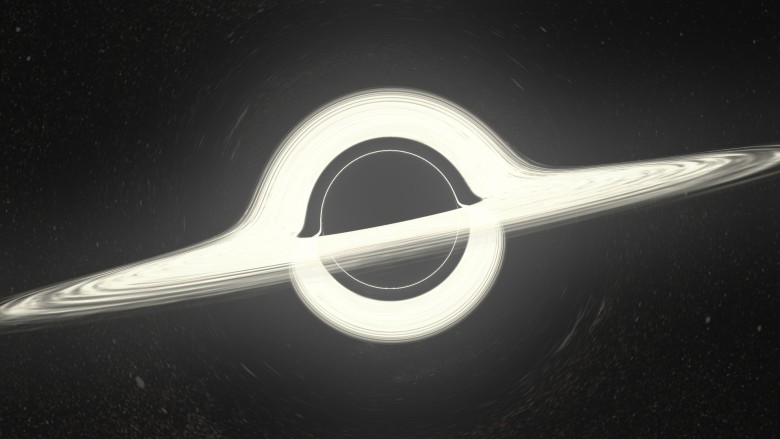
My new project corrects this flaw by discarding efficiency / interactivity in the simplest way: it is a raytracer purely on the CPU . Tracing is performed as accurately and as long as possible. The rendering of the image at the top took15 5 minutes (thanks, RK4) on my laptop.
There is no improvement compared with similar works. I just really like to do it. I am writing this article to share not only the results, like the image above ( especially as others did better ), but also the process of creating these images , with a discussion / explanation of physics and implementation. Ideally, it can inspire or become a guide for people with similar interests.
Look for fresh renders on the starless tag on the tumlr.
If you have already tried my applet , then you are familiar with this picture: The main features are well marked on it: a black disk and a strange ring of distortions. In discussions, people often pay attention: it is wrong to say that the black disk is the event horizon. It is actually wrong to say that the image area is an object . This is an image of an object. Indeed, there are trajectories that when tracked from your eye to the source will be in the event horizon (HS). These are black pixels, because no photon can travel along this path from a black hole (BH) to your eye. Thus, this black disc is a very clear image of the event horizon.
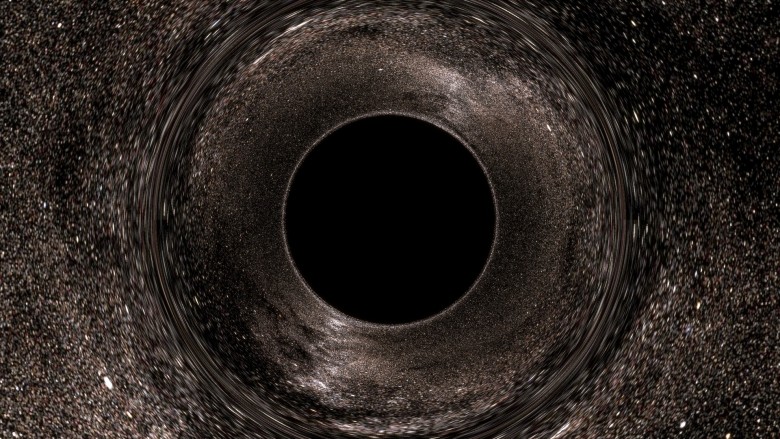
, in the sense that if you draw (in the distant past) something right above the horizon, external observers will be able to see it directly on this black disk (we will actually perform this experiment later). In some publications, this black region is also called the “shadow” of the black hole.

However, it is interesting to note that this is also the image of the photon sphere(FS). The gnuplot graph at the top depicts the geodesy of incoming photons from infinity (looking at the BHs from afar when zooming) along with the HS (black) and FS (green). The radius of the photon sphere is 1.5 times larger than the radius of the event horizon (in the Schwarzschild geometry) and here circular orbits of photons around the BH are allowed (although unstable). On the graph, some rays fall into nonexistence, while others are scattered (and, thus, turn out to be at another point in the celestial sphere). It is seen that in the absorbed rays, the exposure parameter is less than ~ 2.5 radii. This is the apparent radius of the black disk, and it is much larger than the HS and FS.
In any case, the following fact is important:
This means that the image of the photon sphere is included in the image of the event horizon. But since the HS is clearly located inside the FS, the image of the former should also be a subset of the latter. Then the two images must match.
Why do we check that the black disk is also an image of the file system? Because it means that the edge of the black disk is filled with photons that slide along the photon sphere. A pixel immediately outside the black disk corresponds to a photon, which (when traced back) spirals into the photon sphere, getting closer and closer to an unstable circular orbit, spinning many times (the closer you look, the faster it twists), and then spontaneously jumps out - because the orbit is unstable - and runs away to infinity.
Such behavior will cause an interesting optical effect similar to a separatrix in a dynamical system. Theoretically, if the beam is launched exactly along the edge, it will forever spiral into a spiral, closer and closer to the circular orbit of the photon sphere.
We will not dwell on this topic, because the last applet is dedicated to it , and it gives a much better idea of the distortions in the sky (including the UV grid option for clearer distortions).
Just a few words about Einstein's ring. The gravitational lens is optically distinguishable, because it is an image of a single point, which is directly opposite the observer. The ring is formed at a viewing angle when the rays from the observer are bent in parallel. The outer rays do not bend strongly enough and remain divergent; inside they bend too much, converge, and in reality they can even go backwards or in a circle, as we have seen.
But think about this: if you get close enough to the black disk, the light rays can make one circle and then go parallel. There we must see Einstein's secondary ring. In fact, there may be rings of any order (any number of windings). Also between them there should be “odd” rings where the rays of light bend in parallel, but directed towards the viewer. This infinite series of rings exists, but it is completely invisible in our image (in fact, in most of these images), because it is too close to the edge of the disk.
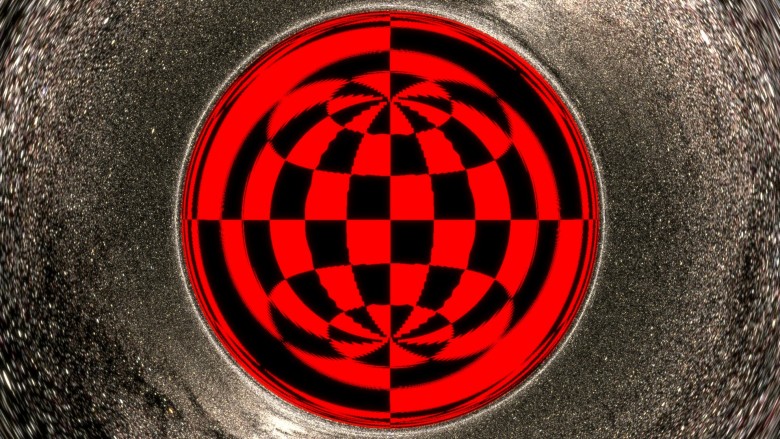
In this new picture, something has changed. First of all, it is made in the best resolution and with background filtering to make it more distinguishable. Then I zoomed into the BH image (without approaching, we are still at a distance of ~ 10 radii from it, just a zoom). But most importantly, I drew a grid on the horizon .
The horizon is "just a sphere." Technically, it is not a standard Riemann sphere with a spatial metric. The horizon is light-like! This is a colorful way to say that it spreads at the speed of light. However, in the Schwarzschild coordinates, it is still a surface and we can use
  and
and  as longitude and latitude. Thus, it is possible to apply a coordinate grid in a canonical way. You see it in the image.
The grid allows you to see a special effect that can be inferred by analyzing the photon scattering / absorption graph above:
It is very interesting. When you look at a fixed sphere in a standard flat space-time, you see no more than 50% of its surface at any time (if you get closer, then less than 50% because of the perspective). But the horizon is completely visible at the same time as a black disk: pay attention, in particular, to the North and South Poles. Nevertheless, although the entire surface fits on a black disk, it does not cover it entirely : if you zoom to the edge, you will see that the image of the GE ends upthe end of the shadow. You will find a ring located very close to the outer edge, but not completely. This is the image of a point opposite the observer and it defines the boundaries of this “first” image of the GE inside. So what is between this ring and the actual edge? I have not yet generated a zoomed image, but there is another whole image of the event horizon . And then another, and one more, ad infinitum. There are endless concentric images of the entire horizon compressed in the shadows. (Thank you very much / u / xXxDeAThANgEL99xXx for pointing out this phenomenon, which I missed) .
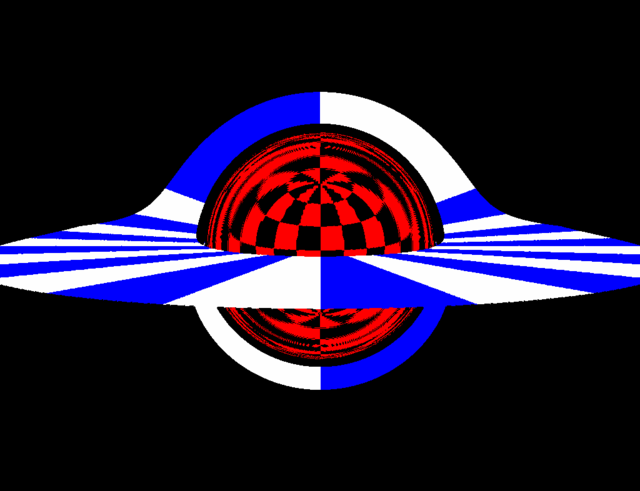
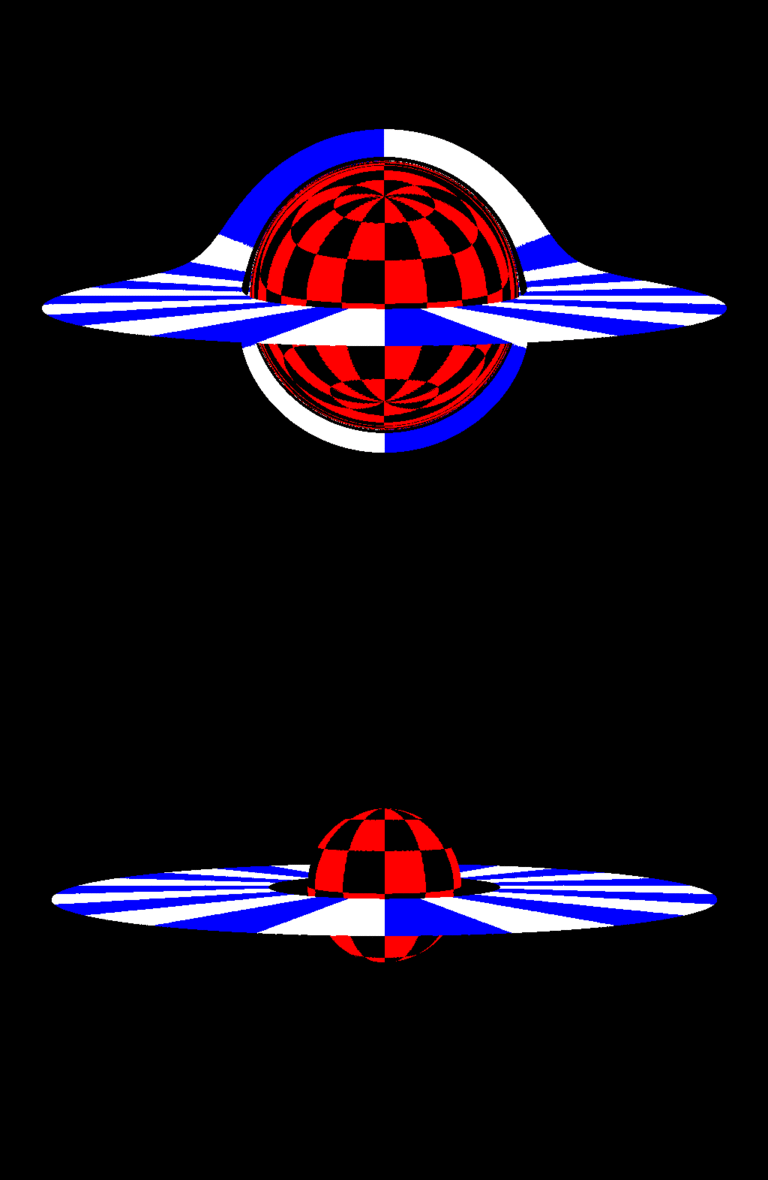
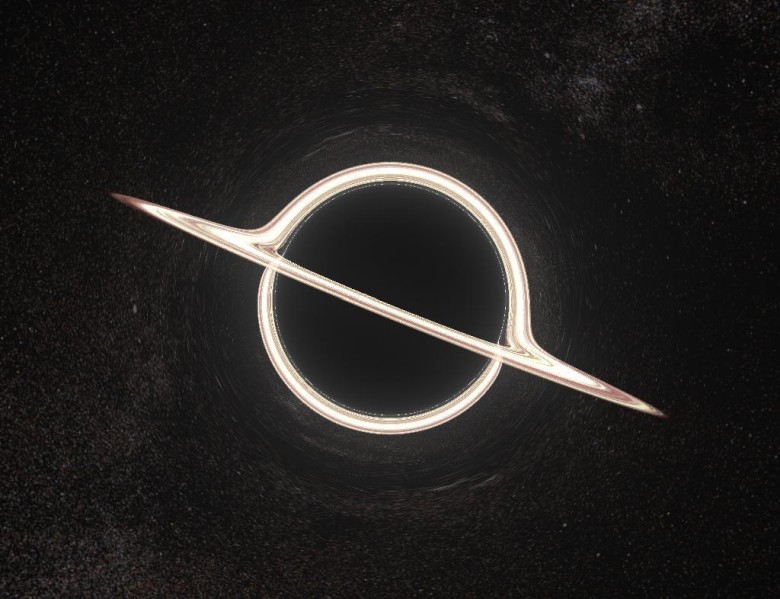
What modern BH rendering will do without an accretion disk? Although it is clearly a controversial question, is Nolan's Interstellar available for observation, not to mention accuracy, but we definitely have to thank the blockbuster for popularizing a specific distortion of the accretion disk. Here we have an infinitely thin, flat, horizontal accretion disk, extending from the photon sphere (although this is very unrealistic, because the orbits are lower unstable, as described below) up to 4 radii, painted in white and blue cell. With this color it is obvious that we are faced with another case where 100% of the object's surface is visible at the same time.
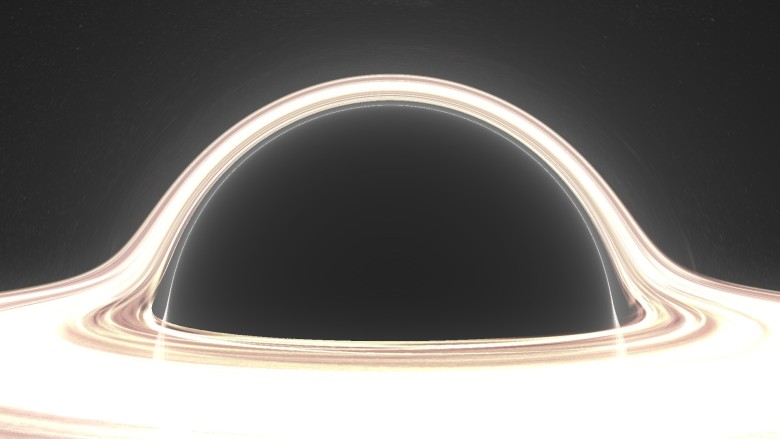
For this image, I moved the observer a little higher to look at the disk a little higher. You see images of two faces of the disk : the top and bottom. The image is bent over the shadow of the BH shadow, because the beam directed directly above the black hole leans down to meet the upper surface of the disk behind the hole opposite the observer.
This also explains the very existence of the lower image: the rays going under the BH are bent to the lower surface of the disk, which is behind the BH. If you look closely, the image spreads throughout the shadow, but at the top it is much thinner. This corresponds to the light rays that go above the BH, make an almost complete circle around the hole and hit the lower surface in front of the disk.
Of course, it is easy to conclude that there is an infinite series of images of accretion disks, which very quickly become thinner as they approach the edge. The image of the next order is already very thin, barely visible at the bottom of the edge.
In this convulsive animation, I turn on / off the deflection of the light (formally Schwarzschild / Minkowski) to clarify some points that we talked about.
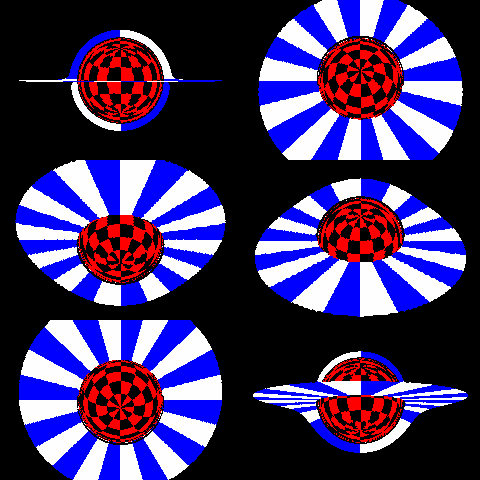

These two strange gifs are created at the request of readers. In the first, the observer circles around a black hole at a distance of 10 radii. This should not be understood as an actual orbit, since in reality there is no aberration when moving in orbit. Here is a series of stationary BH snapshots from several points, where the observer moves from place to place between frames; this is an “adiabatic” orbit, if you like.
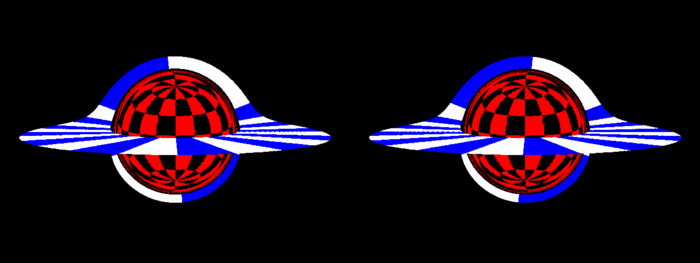
Interestingly, the shadow looks pretty flat.
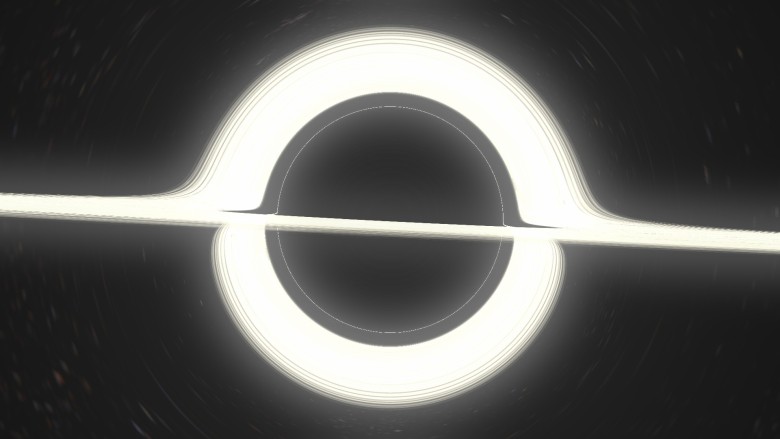
Enough with us informative pictures in the style of the 90s in low resolution with poisonous colors. Here are a few "pop" renders (click for full size). This image is generated by / n / dfzxh with fourfold oversampling A close-up Larger Image ring Cult effect of "light ring" when viewed from the equatorial plane If you download the program, it is the current default scene is much broader drive Well, nothing special. There is no artwork here, just renders from the program. Let's temporarily return to science: the third image
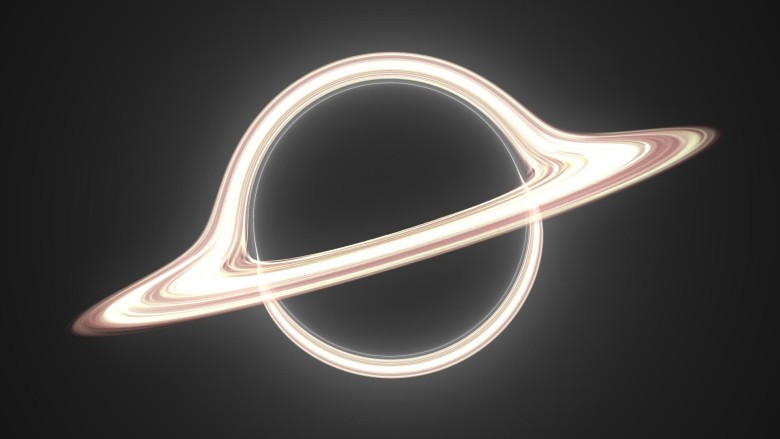
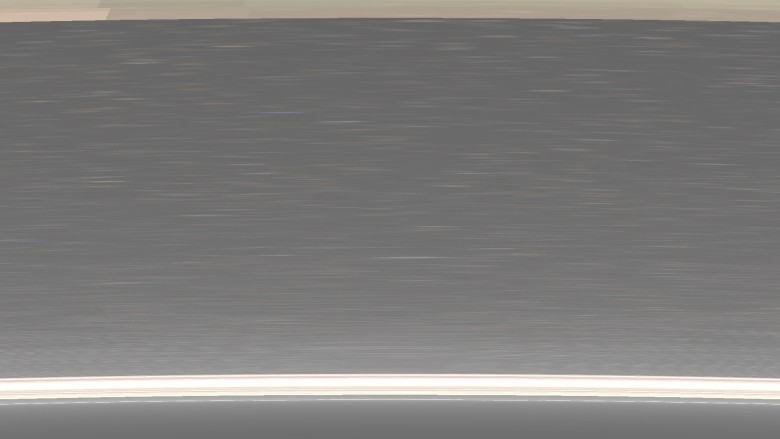

which doesn't seem to make any sense, is actually very valuable. This is an enlarged area between the upper edge of the black disk and the main image of the accretion disk. The observer is on the outer edge of the accretion disk itself and zooms the picture. The goal was to depict as many rings of different order as possible. Three orders are visible: the brighter zone in the upper part is only the lower edge of the first image of the upper distal surface of the disk. The strip below, under the calm sea of sprawling stars, is the upper part of the image of the lower front part of the disk. At the very bottom is a thin line of light with a width of no more than a pixel glued to the black disk of the photon sphere. This is basically the third image: the upper far surface again, but after the light has completed an additional rotation around the black hole. Merged with him but ever thinner images are higher order rings. Well, this is also worthy of the <blockquote> tag:
Wonderful.
Accept rendering requests
Interested in a specific visualization, but not ready to go through the difficulties of installing the program and rendering yourself? Just email me reddit or mail. Rendering 1080p on my laptop takes no more than 10-20 minutes.
Accretion disk in renders is quite cartoonish. It's just a wacky texture disc. What happens when real physics is included in the visual appearance of the disk? What happens when you consider the redshift from the orbital motion, for example?
A popular model of an accretion disk is an infinitely thin disk of matter in an almost circular orbit. It starts with ISCO (the innermost stable circular orbit, ) with a temperature profile according to a power law
  . I will use a very simple option:
which is definitely abnormal in the general theory of relativity for realistic liquids, but here it is (in any case, you will not notice the difference).
Now the free parameter is a common scale for temperatures, for example, the temperature in ISCO. This temperature is huge for most black holes. We are talking about hundreds of millions of Kelvin; it's hard to imagine any human artifact that could existby being exposed to disk radiation (peak in X-rays) at such temperatures, not to mention photographing. So we obviously need to reduce the temperature. Obviously, supermassive black holes are colder, but not enough. We need to go down to 10,000 K in ISCO so that we can see at least something. This is very inaccurate, but that's all I can do.
Two questions should be asked. First: what is the color of the black body at this temperature? Second: how bright is it ? Formally, the answer to these two questions is in the scalar product of functions describing the R, G, B channels with a black body spectrum. In practice, some approximations are used.
For the color is quite accurate and effective, this formulaTanner Helland, but it includes numerous conditions that are impossible with my ray tracing (see below for more details). The fastest way is to use a simple texture:

This texture is one of many useful things in the Mitchell Charity compilation of “What is the color of a black body?” . For reference, it corresponds to the white point E (whitepoint E).
The scale shows the color of the black body at temperatures from 1000 K to 30 000 K, with higher temperatures corresponding to approximately the same shade of blue. Since there is a huge difference in brightness between temperatures, this texture cannot transmit and does not transmit brightness; rather, it normalizes the colors. Our task is to calculate the relative brightness and apply it. An analytical formula is suitable for this. If we assume that the visible spectrum is very narrow, then the total apparent intensity is proportional to the spectrum of the black body itself:
where I got rid of the stupid common constants (we're still going to scale the brightness to see something). You can simply insert approximately for the visible range of the spectrum, and we obtain that the brightness is proportional to the temperature according to the following formula:
It is quite simple. As a test, we note that the relative intensity quickly drops to zero as T approaches zero, and practically does not change when T goes to infinity.
We discussed orbital velocities in Schwarzschild geometry in the applet description. To calculate the redshift, use the redshift formula from the SRT:
Where as Is the cosine of the angle between the direction of the beam emitted by the disk and the local speed of the disk, calculated in the local Schwarzschild local inertial coordinate system. The formula is correct in this context due to the equivalence principle.
It must be multiplied by the coefficient of gravitational redshift:
this coefficient does not depend on the trajectory of the light beam, but only on the radius of the radiation, since the Schwarzschild geometry is stationary.
It also means that the contribution of the observer position to the gravitational redshift is constant over the entire field of view. Our entire image has a constant total blue offset, because we are deep in BH. Therefore, this effect gives only a faint tint that can be ignored.
We also neglect the redshift from the observer's movement, because our observer is stationary in the Schwarzschild geometry. Here is the final result:
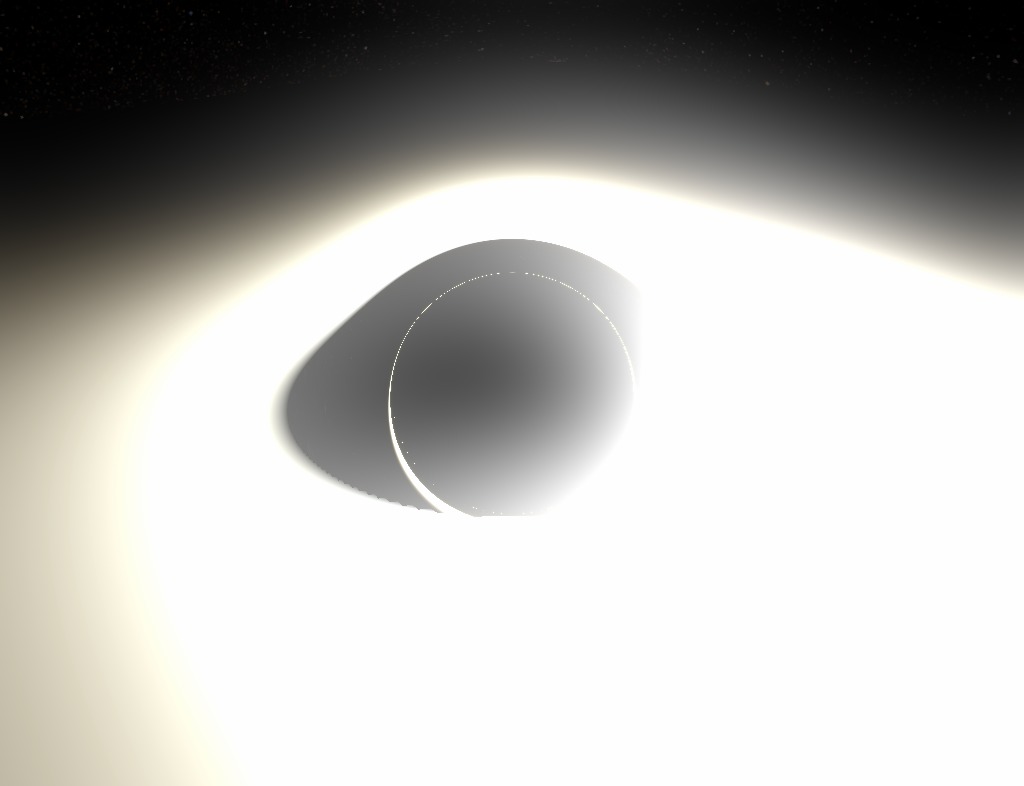
As you can see, most of the disk is completely white due to the maximum brightness in the color channels. If you lower these channels to the range of 0.0-1.0, then the outer parts of the disk will become pale or black. The increase in brightness is too great to see and appreciate. I tried to show the effect through post-processing, so that the brightest parts showed a transition of colors, but this is hardly enough.
Pretty messy picture. Here is an image without brightness, where you can evaluate colors:
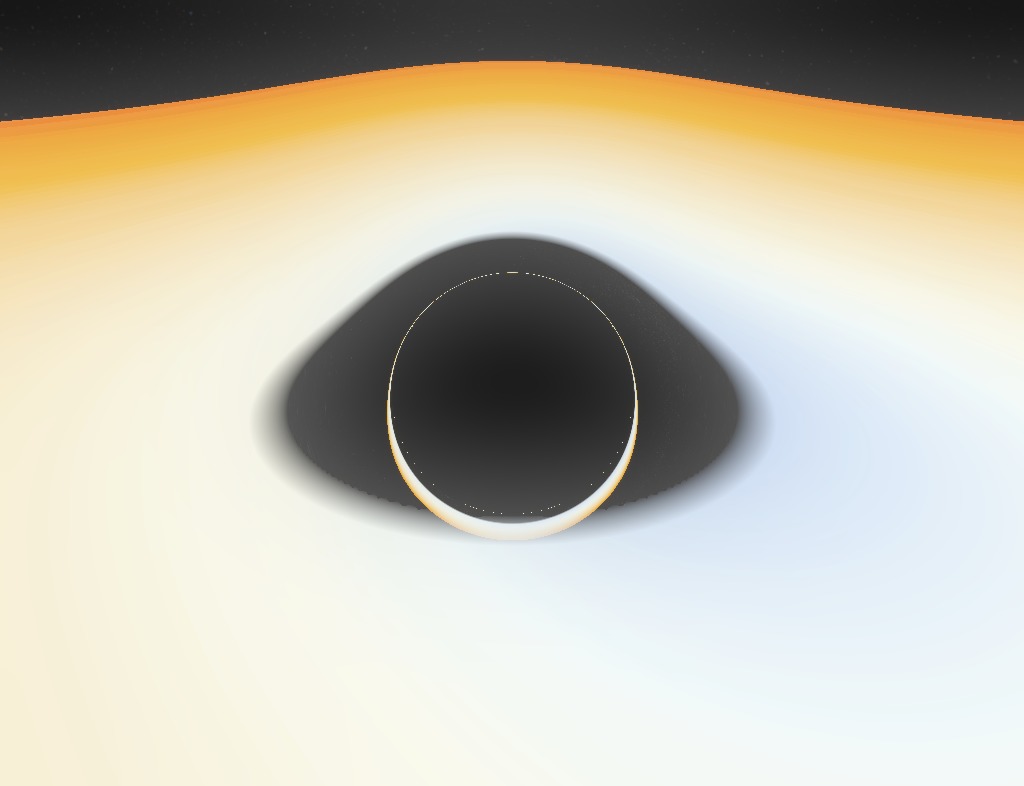
These pictures have lower resolution, because they are rendered on my laptop for a very long time (square roots are bad, children).
In any case, this render is a thousand times less spectacular than others (mainly because the inner edge of the disc is already far enough from the GE, so that the lens is too large), but the render is at least accurate . If you find a black hole with a temperature of 10,000 K and good sunglasses, you will see exactly that.
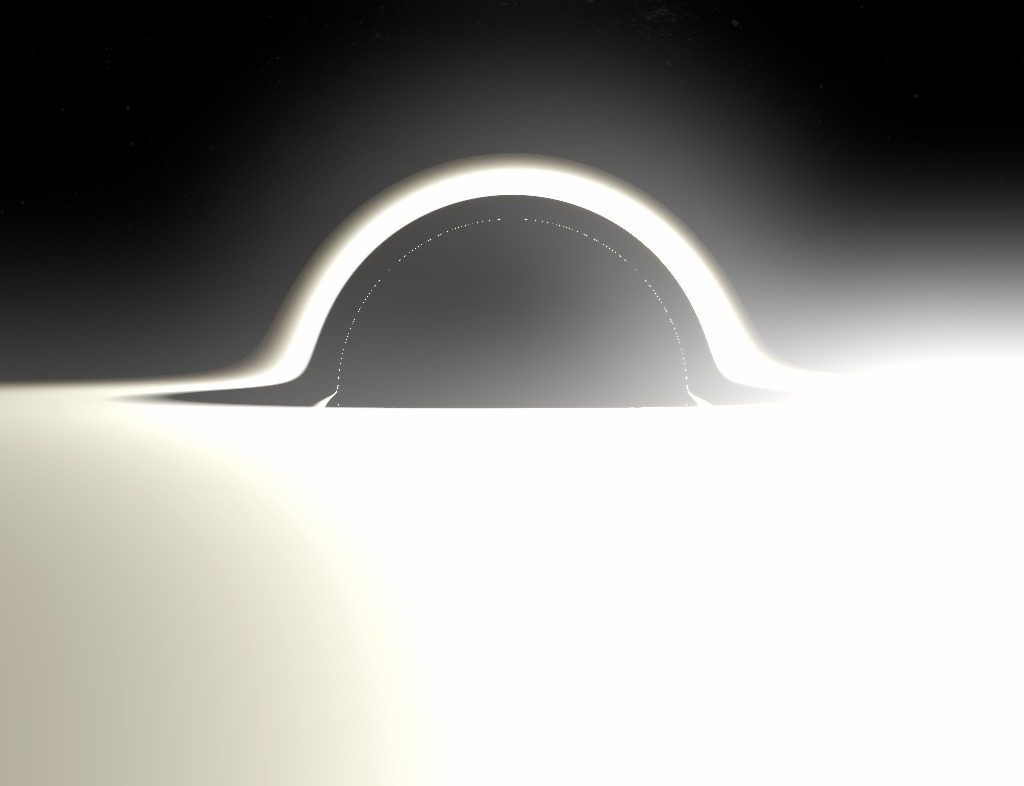
Another shot from close range. I unnaturally raised saturation for beauty:
There is a very big and obvious difference between the optics of black holes and the numerical integrator, which produces beautiful wallpapers for the desktop with a resolution of 1080p. Last time I did not publish my reasoning, but just picked up a big and dirty git repository. Now I want to explain in a bit more detail, and also try to keep the code more accurate and with comments.
My tracer was not created good, powerful, fast. First of all, I wanted it to be easy to set up, so that it was simple, so that people could get inspiration and see the potential for improvement: even its imperfection can push someone to decide to write their own version. Here is a brief overview of the algorithms and their implementation.
So, the general theory of relativity, everything is clear. It is easy. We take the Schwarzschild metric, look for the Christoffel symbols, calculate their derivative, write the geodesic equation, change some Cartesian coordinates to avoid endless suffering, we get a huge multi-line ODE, solve it. Like that.
Just kidding. Of course, there is one trick.
If you remember, last time I derived the following equation for the orbit of a massless particle in its orbital plane in Schwarzschild geometry ( ):
):
The trick is to see the Binet formula here . For having a mass of Newtonian particles in the Newtonian potential of the field of central forces:
then the particle will obviously move in its orbital plane and corresponds to the Binet formula for :
:
Where - Prime number,
  - mass, and
  - angular momentum per unit mass. This is the equation for the orbit, not the equation of motion. It says nothing about
 or
or  , only shows the relationship between
  and
and  .
.
Let's stop for a moment to think about what we actually got. The equation says that if we imagine a hypothetical mechanical system of a particle under the action of a certain central force, then its trajectory will be a solution to the Binet formula. Then the mechanical system becomes a formula calculation tool.
That is what I offer here. We specified and took (nonphysical, whatever) a simple system of a point particle in this particular force field:
Where - some constant, and already numerically solve the equation is very simple. Then the solution
 where
where  - the abstract temporal coordinate for this system is actually a parameterization of a single solution for the corresponding Binet equation, which is exactly a geodesic equation .
Therefore, we solve the Newtonian equation in Cartesian coordinates, which is generally the simplest (I decided to use the Runge – Kutta method in order to increase the step size and reduce the rendering time, but in the future the user will be able to choose a different solution method). Then we get just the actual light-like geodesy, where - the parameter that runs along it (in contrast to the Schwarzschild
  , and from normal time, which does not exist).
This is much better than the previous method, which worked with the polar coordinates in the orbit plane. Here calculations are performed very efficiently.
If you look at the sources, you will see a Python script. Horror! Why write ray tracing in Python? Everyone knows how slow the cycles run in Python, which always (almost) puts an end to work. The fact is that we perform calculations in numpy - and in parallel. That is why this program cannot gradually display already drawn parts on the screen: it renders everything at the same time.
First, create an array of initial conditions. For example, an array
This method is terrible for standard ray tracing, where objects have diffuse, reflective, refractive parts, and it is important to take the lighting conditions into account. For example, the selective reflection of parts of an array of rays is a real nightmare; tracking boolean values or loop indices requires multiple masks, and loops cannot be split. But here is another case: all objects in our scene only emit light: the sky, a hot accretion disk, a pitch black event horizon and bright dust. They are not affected by the incident light, and the light itself also quietly passes through them, unless it reduces the intensity. This leads us to the color determination algorithm:
It's easy: you just need to mix all the objects between us and the source of the beam with their corresponding alpha values, and place them one above the other, where the furthest will be below. We initialize the color buffer with alpha-transparent black color, then at the intersection with the object we update the buffer by mixing the color from the object under our color buffer. We perform the same steps for dust (use the density profile ) and continue to iterate to the end. Note that the alpha channel also works as a Z-buffer, because the object stops contributing after the ray has crossed the opaque object (which thus set the alpha value of the buffer to 1.0).
The obvious disadvantage of this method is that it is impossible to stop the ray tracing after it has been calculated, because it is part of an array where other ray tracing continues. For example, after a collision with the horizon, the rays continue to randomly wander after they hit the singularity - you can see what happens if you explicitly turn off the horizon object. The alpha blending algorithm ensures that they do not affect the final image, but these rays still load the CPU.

(works in the browser). The trick is to maximize the pre-calculated deflection of light rays. Everything works more or less normally, but of course, such a simulation is far from ideal, because in reality no tracing is done there (for non-specialists: restoring the location of the light rays falling into the camera back in time).
My new project corrects this flaw by discarding efficiency / interactivity in the simplest way: it is a raytracer purely on the CPU . Tracing is performed as accurately and as long as possible. The rendering of the image at the top took
There is no improvement compared with similar works. I just really like to do it. I am writing this article to share not only the results, like the image above ( especially as others did better ), but also the process of creating these images , with a discussion / explanation of physics and implementation. Ideally, it can inspire or become a guide for people with similar interests.
Look for fresh renders on the starless tag on the tumlr.
Some pseudo-Riemann optics
Shadow
If you have already tried my applet , then you are familiar with this picture: The main features are well marked on it: a black disk and a strange ring of distortions. In discussions, people often pay attention: it is wrong to say that the black disk is the event horizon. It is actually wrong to say that the image area is an object . This is an image of an object. Indeed, there are trajectories that when tracked from your eye to the source will be in the event horizon (HS). These are black pixels, because no photon can travel along this path from a black hole (BH) to your eye. Thus, this black disc is a very clear image of the event horizon.

, in the sense that if you draw (in the distant past) something right above the horizon, external observers will be able to see it directly on this black disk (we will actually perform this experiment later). In some publications, this black region is also called the “shadow” of the black hole.

However, it is interesting to note that this is also the image of the photon sphere(FS). The gnuplot graph at the top depicts the geodesy of incoming photons from infinity (looking at the BHs from afar when zooming) along with the HS (black) and FS (green). The radius of the photon sphere is 1.5 times larger than the radius of the event horizon (in the Schwarzschild geometry) and here circular orbits of photons around the BH are allowed (although unstable). On the graph, some rays fall into nonexistence, while others are scattered (and, thus, turn out to be at another point in the celestial sphere). It is seen that in the absorbed rays, the exposure parameter is less than ~ 2.5 radii. This is the apparent radius of the black disk, and it is much larger than the HS and FS.
In any case, the following fact is important:
A light beam freely falling into the photon sphere will also reach the event horizon.
This means that the image of the photon sphere is included in the image of the event horizon. But since the HS is clearly located inside the FS, the image of the former should also be a subset of the latter. Then the two images must match.
Why do we check that the black disk is also an image of the file system? Because it means that the edge of the black disk is filled with photons that slide along the photon sphere. A pixel immediately outside the black disk corresponds to a photon, which (when traced back) spirals into the photon sphere, getting closer and closer to an unstable circular orbit, spinning many times (the closer you look, the faster it twists), and then spontaneously jumps out - because the orbit is unstable - and runs away to infinity.
Such behavior will cause an interesting optical effect similar to a separatrix in a dynamical system. Theoretically, if the beam is launched exactly along the edge, it will forever spiral into a spiral, closer and closer to the circular orbit of the photon sphere.
Influence on the sky
We will not dwell on this topic, because the last applet is dedicated to it , and it gives a much better idea of the distortions in the sky (including the UV grid option for clearer distortions).
Just a few words about Einstein's ring. The gravitational lens is optically distinguishable, because it is an image of a single point, which is directly opposite the observer. The ring is formed at a viewing angle when the rays from the observer are bent in parallel. The outer rays do not bend strongly enough and remain divergent; inside they bend too much, converge, and in reality they can even go backwards or in a circle, as we have seen.
But think about this: if you get close enough to the black disk, the light rays can make one circle and then go parallel. There we must see Einstein's secondary ring. In fact, there may be rings of any order (any number of windings). Also between them there should be “odd” rings where the rays of light bend in parallel, but directed towards the viewer. This infinite series of rings exists, but it is completely invisible in our image (in fact, in most of these images), because it is too close to the edge of the disk.
Distortion of the event horizon

In this new picture, something has changed. First of all, it is made in the best resolution and with background filtering to make it more distinguishable. Then I zoomed into the BH image (without approaching, we are still at a distance of ~ 10 radii from it, just a zoom). But most importantly, I drew a grid on the horizon .
The horizon is "just a sphere." Technically, it is not a standard Riemann sphere with a spatial metric. The horizon is light-like! This is a colorful way to say that it spreads at the speed of light. However, in the Schwarzschild coordinates, it is still a surface
The grid allows you to see a special effect that can be inferred by analyzing the photon scattering / absorption graph above:
The entire surface of the horizon is visible simultaneously from any point.
It is very interesting. When you look at a fixed sphere in a standard flat space-time, you see no more than 50% of its surface at any time (if you get closer, then less than 50% because of the perspective). But the horizon is completely visible at the same time as a black disk: pay attention, in particular, to the North and South Poles. Nevertheless, although the entire surface fits on a black disk, it does not cover it entirely : if you zoom to the edge, you will see that the image of the GE ends upthe end of the shadow. You will find a ring located very close to the outer edge, but not completely. This is the image of a point opposite the observer and it defines the boundaries of this “first” image of the GE inside. So what is between this ring and the actual edge? I have not yet generated a zoomed image, but there is another whole image of the event horizon . And then another, and one more, ad infinitum. There are endless concentric images of the entire horizon compressed in the shadows. (Thank you very much / u / xXxDeAThANgEL99xXx for pointing out this phenomenon, which I missed) .
Add accretion disk

What modern BH rendering will do without an accretion disk? Although it is clearly a controversial question, is Nolan's Interstellar available for observation, not to mention accuracy, but we definitely have to thank the blockbuster for popularizing a specific distortion of the accretion disk. Here we have an infinitely thin, flat, horizontal accretion disk, extending from the photon sphere (although this is very unrealistic, because the orbits are lower
For this image, I moved the observer a little higher to look at the disk a little higher. You see images of two faces of the disk : the top and bottom. The image is bent over the shadow of the BH shadow, because the beam directed directly above the black hole leans down to meet the upper surface of the disk behind the hole opposite the observer.
This also explains the very existence of the lower image: the rays going under the BH are bent to the lower surface of the disk, which is behind the BH. If you look closely, the image spreads throughout the shadow, but at the top it is much thinner. This corresponds to the light rays that go above the BH, make an almost complete circle around the hole and hit the lower surface in front of the disk.
Of course, it is easy to conclude that there is an infinite series of images of accretion disks, which very quickly become thinner as they approach the edge. The image of the next order is already very thin, barely visible at the bottom of the edge.
GIFs are still relevant

In this convulsive animation, I turn on / off the deflection of the light (formally Schwarzschild / Minkowski) to clarify some points that we talked about.


These two strange gifs are created at the request of readers. In the first, the observer circles around a black hole at a distance of 10 radii. This should not be understood as an actual orbit, since in reality there is no aberration when moving in orbit. Here is a series of stationary BH snapshots from several points, where the observer moves from place to place between frames; this is an “adiabatic” orbit, if you like.
And the stereo is also still relevant

Interestingly, the shadow looks pretty flat.
Enough science
Enough with us informative pictures in the style of the 90s in low resolution with poisonous colors. Here are a few "pop" renders (click for full size). This image is generated by / n / dfzxh with fourfold oversampling A close-up Larger Image ring Cult effect of "light ring" when viewed from the equatorial plane If you download the program, it is the current default scene is much broader drive Well, nothing special. There is no artwork here, just renders from the program. Let's temporarily return to science: the third image


which doesn't seem to make any sense, is actually very valuable. This is an enlarged area between the upper edge of the black disk and the main image of the accretion disk. The observer is on the outer edge of the accretion disk itself and zooms the picture. The goal was to depict as many rings of different order as possible. Three orders are visible: the brighter zone in the upper part is only the lower edge of the first image of the upper distal surface of the disk. The strip below, under the calm sea of sprawling stars, is the upper part of the image of the lower front part of the disk. At the very bottom is a thin line of light with a width of no more than a pixel glued to the black disk of the photon sphere. This is basically the third image: the upper far surface again, but after the light has completed an additional rotation around the black hole. Merged with him but ever thinner images are higher order rings. Well, this is also worthy of the <blockquote> tag:
Here are endless images of both the upper and lower surfaces of the accretion disk, and they all show the entire surface of the disk simultaneously. Moreover, except for the very first one, these images do not pass either in front of the black disk or in front of each other, and therefore are “concentric”.
Wonderful.
Accept rendering requests
Interested in a specific visualization, but not ready to go through the difficulties of installing the program and rendering yourself? Just email me reddit or mail. Rendering 1080p on my laptop takes no more than 10-20 minutes.
Realistic accretion disk
Accretion disk in renders is quite cartoonish. It's just a wacky texture disc. What happens when real physics is included in the visual appearance of the disk? What happens when you consider the redshift from the orbital motion, for example?
A popular model of an accretion disk is an infinitely thin disk of matter in an almost circular orbit. It starts with ISCO (the innermost stable circular orbit,
which is definitely abnormal in the general theory of relativity for realistic liquids, but here it is (in any case, you will not notice the difference).
Now the free parameter is a common scale for temperatures, for example, the temperature in ISCO. This temperature is huge for most black holes. We are talking about hundreds of millions of Kelvin; it's hard to imagine any human artifact that could existby being exposed to disk radiation (peak in X-rays) at such temperatures, not to mention photographing. So we obviously need to reduce the temperature. Obviously, supermassive black holes are colder, but not enough. We need to go down to 10,000 K in ISCO so that we can see at least something. This is very inaccurate, but that's all I can do.
Two questions should be asked. First: what is the color of the black body at this temperature? Second: how bright is it ? Formally, the answer to these two questions is in the scalar product of functions describing the R, G, B channels with a black body spectrum. In practice, some approximations are used.
For the color is quite accurate and effective, this formulaTanner Helland, but it includes numerous conditions that are impossible with my ray tracing (see below for more details). The fastest way is to use a simple texture:

This texture is one of many useful things in the Mitchell Charity compilation of “What is the color of a black body?” . For reference, it corresponds to the white point E (whitepoint E).
The scale shows the color of the black body at temperatures from 1000 K to 30 000 K, with higher temperatures corresponding to approximately the same shade of blue. Since there is a huge difference in brightness between temperatures, this texture cannot transmit and does not transmit brightness; rather, it normalizes the colors. Our task is to calculate the relative brightness and apply it. An analytical formula is suitable for this. If we assume that the visible spectrum is very narrow, then the total apparent intensity is proportional to the spectrum of the black body itself:
where I got rid of the stupid common constants (we're still going to scale the brightness to see something). You can simply insert
It is quite simple. As a test, we note that the relative intensity quickly drops to zero as T approaches zero, and practically does not change when T goes to infinity.
Redshift
We discussed orbital velocities in Schwarzschild geometry in the applet description. To calculate the redshift, use the redshift formula from the SRT:
Where as
It must be multiplied by the coefficient of gravitational redshift:
this coefficient does not depend on the trajectory of the light beam, but only on the radius of the radiation, since the Schwarzschild geometry is stationary.
It also means that the contribution of the observer position to the gravitational redshift is constant over the entire field of view. Our entire image has a constant total blue offset, because we are deep in BH. Therefore, this effect gives only a faint tint that can be ignored.
We also neglect the redshift from the observer's movement, because our observer is stationary in the Schwarzschild geometry. Here is the final result:

As you can see, most of the disk is completely white due to the maximum brightness in the color channels. If you lower these channels to the range of 0.0-1.0, then the outer parts of the disk will become pale or black. The increase in brightness is too great to see and appreciate. I tried to show the effect through post-processing, so that the brightest parts showed a transition of colors, but this is hardly enough.
Pretty messy picture. Here is an image without brightness, where you can evaluate colors:

These pictures have lower resolution, because they are rendered on my laptop for a very long time (square roots are bad, children).
In any case, this render is a thousand times less spectacular than others (mainly because the inner edge of the disc is already far enough from the GE, so that the lens is too large), but the render is at least accurate . If you find a black hole with a temperature of 10,000 K and good sunglasses, you will see exactly that.
Another shot from close range. I unnaturally raised saturation for beauty:

We write the black hole ray tracer
Source code on github
There is a very big and obvious difference between the optics of black holes and the numerical integrator, which produces beautiful wallpapers for the desktop with a resolution of 1080p. Last time I did not publish my reasoning, but just picked up a big and dirty git repository. Now I want to explain in a bit more detail, and also try to keep the code more accurate and with comments.
My tracer was not created good, powerful, fast. First of all, I wanted it to be easy to set up, so that it was simple, so that people could get inspiration and see the potential for improvement: even its imperfection can push someone to decide to write their own version. Here is a brief overview of the algorithms and their implementation.
"Magical" potential
So, the general theory of relativity, everything is clear. It is easy. We take the Schwarzschild metric, look for the Christoffel symbols, calculate their derivative, write the geodesic equation, change some Cartesian coordinates to avoid endless suffering, we get a huge multi-line ODE, solve it. Like that.
Just kidding. Of course, there is one trick.
If you remember, last time I derived the following equation for the orbit of a massless particle in its orbital plane in Schwarzschild geometry (
The trick is to see the Binet formula here . For having a mass of Newtonian particles in the Newtonian potential of the field of central forces:
then the particle will obviously move in its orbital plane and corresponds to the Binet formula for
Where
Let's stop for a moment to think about what we actually got. The equation says that if we imagine a hypothetical mechanical system of a particle under the action of a certain central force, then its trajectory will be a solution to the Binet formula. Then the mechanical system becomes a formula calculation tool.
That is what I offer here. We specified
Where
Therefore, we solve the Newtonian equation in Cartesian coordinates, which is generally the simplest (I decided to use the Runge – Kutta method in order to increase the step size and reduce the rendering time, but in the future the user will be able to choose a different solution method). Then we get just the actual light-like geodesy, where
This is much better than the previous method, which worked with the polar coordinates in the orbit plane. Here calculations are performed very efficiently.
Ray tracing in numpy
If you look at the sources, you will see a Python script. Horror! Why write ray tracing in Python? Everyone knows how slow the cycles run in Python, which always (almost) puts an end to work. The fact is that we perform calculations in numpy - and in parallel. That is why this program cannot gradually display already drawn parts on the screen: it renders everything at the same time.
First, create an array of initial conditions. For example, an array
(numPixel, 3)with vectors for all image pixels (numPixel - image width × image height). Then the calculation of each ray is reduced to arrays of the type(numPixel, ...). Since the operations with arrays in numpy are performed very quickly, and everything is statically typed here (I hope I’m not saying anything stupid right now), it should be calculated fairly quickly. Maybe it's not C, but still fast. At the same time, we have the flexibility and clarity of Python.This method is terrible for standard ray tracing, where objects have diffuse, reflective, refractive parts, and it is important to take the lighting conditions into account. For example, the selective reflection of parts of an array of rays is a real nightmare; tracking boolean values or loop indices requires multiple masks, and loops cannot be split. But here is another case: all objects in our scene only emit light: the sky, a hot accretion disk, a pitch black event horizon and bright dust. They are not affected by the incident light, and the light itself also quietly passes through them, unless it reduces the intensity. This leads us to the color determination algorithm:
Mixing colors
It's easy: you just need to mix all the objects between us and the source of the beam with their corresponding alpha values, and place them one above the other, where the furthest will be below. We initialize the color buffer with alpha-transparent black color, then at the intersection with the object we update the buffer by mixing the color from the object under our color buffer. We perform the same steps for dust (use the density profile
The obvious disadvantage of this method is that it is impossible to stop the ray tracing after it has been calculated, because it is part of an array where other ray tracing continues. For example, after a collision with the horizon, the rays continue to randomly wander after they hit the singularity - you can see what happens if you explicitly turn off the horizon object. The alpha blending algorithm ensures that they do not affect the final image, but these rays still load the CPU.
