11 JavaScript libraries for data visualization that you should know about in 2018
- Transfer
We live in a time of explosive growth in the amounts of data generated and consumed by mankind. Practically in each of the applications developed today, the data is either used somewhere inside them, or visualized. Programmers, using data, seek to make work with their programs as comfortable as possible.
Sometimes it can happen that the most valuable and interesting things that an application can give to a user are some data. However, if you present them in the form of something like a list or table, working with such data will most likely be tedious. In addition, if there is a lot of data, seeing only their simplest representation, the user will face difficulties in analyzing them and making any decisions based on them.
Data that represents an application to a user should not only have value for it by itself. They should be designed in such a way that it is quick, convenient and pleasant to work with them.

Today we present to your attention a translation of the material, which considers open-source JavaScript libraries for data visualization.
Library D3
Perhaps the open source D3 library(also called D3.js) can be called the most popular of the existing JS libraries for data visualization. This project, in particular, has collected almost 80 thousand stars on GitHub. The library is designed to visualize data using technologies such as HTML, SVG, and CSS.
Thanks to the attention of the creators of the library to web standards, D3 gives developers a holistic, suitable for use in modern browsers environment for data visualization, eliminating the need to find some paid solutions. The D3 library combines components for data visualization and an approach to working with the DOM, which is based on, again, data. D3 allows you to output arbitrary data to the DOM, and then apply suitable transformations to the document. Here is an excellent gallery of examples of using this library.
By the way, pay attention to the fact that there is an opinion according to which D3 is not a library for data visualization at all . We believe you can decide for yourself what to consider it and whether to use it in your project.
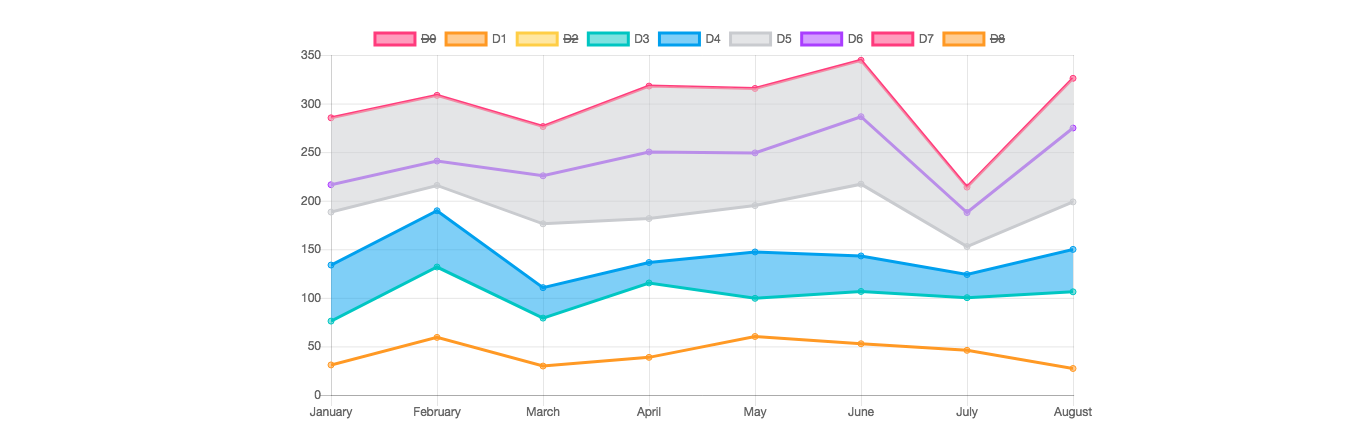
Chart.js
Library Chart.js , attended by approximately 40 thousand stars on GitHub, is a very popular solution for creating the HTML5-graphs and charts based on the element
Three.js
Library Three.js is a very popular solution (about 45 000 stars on GitHub; contribution to the project made more than 1,000 people) to create a 3D-animation WebGL means. Flexibility and abstractness of the project means the possibility of using Three.js for data visualization in 2 and 3 dimensions. For example, here is a specialized module for Three.js, designed to create three-dimensional graphs. Here is an online sandbox for data visualization experiments. If you are thinking about visualizing data using WebGL - sure, it will be useful for you to take a look at Three.js.
An example of working with ECharts (image taken from here )
ECharts - the Baidu project, which gathered about 30 thousand stars on GitHub, is a library for visualizing data and plotting graphs in the browser. It is written in pure JavaScript using the zrender libraryfor working with the element
The library supports plotting output using
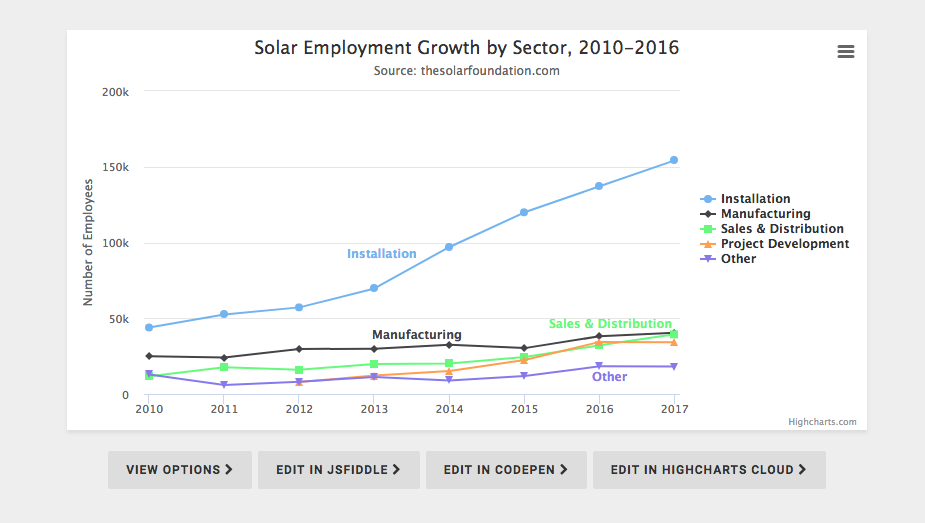
Highcharts JS
Library Highcharts JS is widely used, it has collected about 8000 stars on GitHub. The main mechanism it uses for data visualization is SVG technology, with the ability to switch to VML and

MetricsGraphics.js
Library MetricsGraphics.js (about 7 to thousands of stars GitHub) is a solution that is optimized for visualization in calculating time series. It differs in a relatively small size (80 Kb in minifitsirovanny form) and gives the developer a small but thoughtful set of highly specialized tools, among which are tools for constructing linear graphs, scatterplots, histograms, bar graphs, tables with data. Here is an interactive gallery of examples of working with this library.
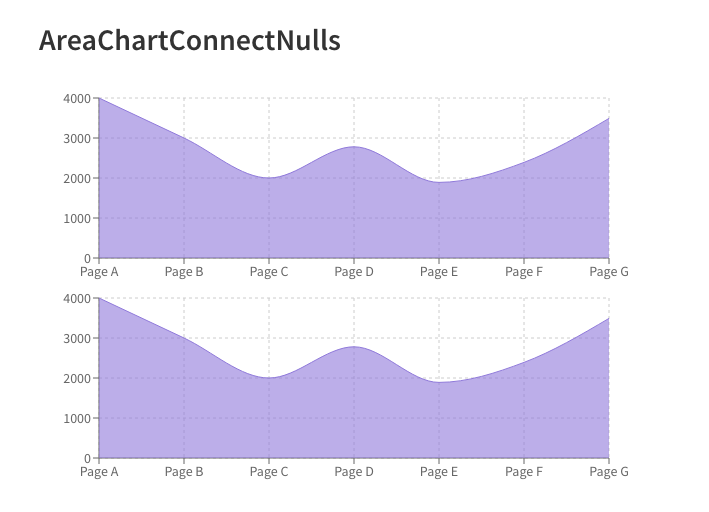
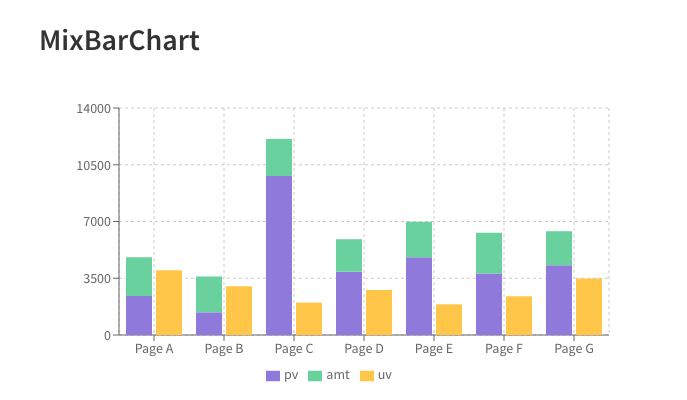
Recharts
Library Recharts , with nearly 10,000 stars on GitHub - is the solution for charting based on React and D3, the use of which looks like work with declarative React-components. The library gives the developer support for SVG. Its lightweight dependency tree (based on D3 submodules) is tweaking through the properties of the components. Here you can find examples of its use.
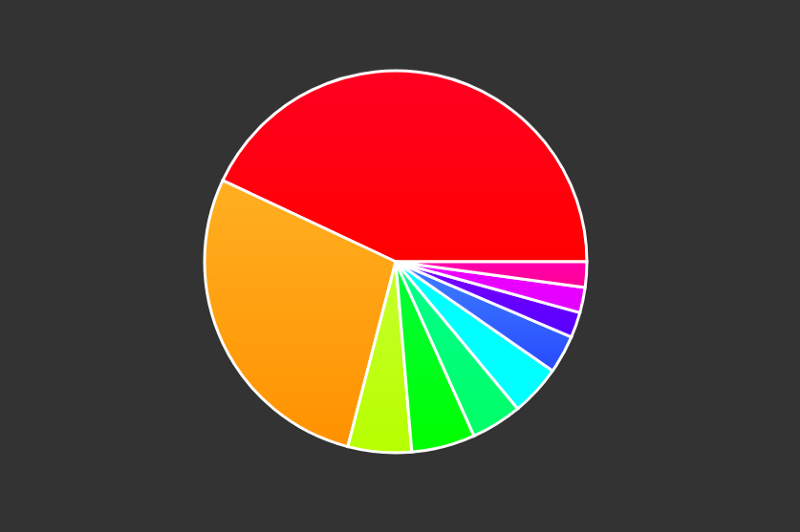
The Raphaël
"Vector" Raphaël library(about 10 thousand stars on GitHub) is designed to work with vector graphics in the web environment. It uses SVG and VML as basic technologies for creating graphic objects. As a result, graphic objects are also DOM objects to which you can connect, using JavaScript, event handlers. The library currently supports browsers such as Firefox 3.0+, Safari 3.0+, Chrome 5.0+, Opera 9.5+, and Internet Explorer 6.0+.
An example of the use of C3 Library
LibraryC3(about 8000 stars on GitHub) based on the D3, it gives the developer the ability to use classes for all of its elements, which allows you to define your own style class facilities and benefit from the opportunities D3. In addition, it supports various APIs and callbacks for organizing interactive interaction with graphics. Using them, you can update graphs even after they are displayed on the page. Here areexamples of using this library.
A set of components React-Vis
collection of components React-Vis (about 4 thousand stars on GitHub) developed by Uber and is intended for the organization of a uniform data visualization system React-applications. This solution supports the presentation of data in various forms, in particular, in the form of heat maps and scatterplots. To work with this library does not require prior acquaintance, say, with something like D3. It provides the developer with low-level modular building blocks like X / Y axes.
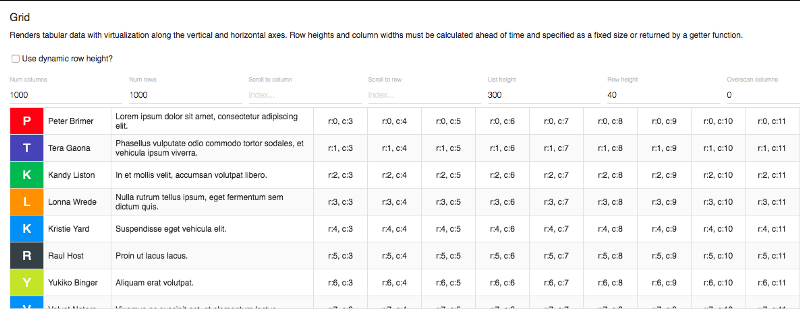
A set of components React virtualized
set of components React virtualized (about 12 thousand stars on GitHub) is designed for effective rendering large sets of table data. ES6, CommonJS and UMD assemblies are available React virtualized, the project supports Webpack 4. If you are going to use this set of components, pay attention to the Dependencies sectionin its documentation.
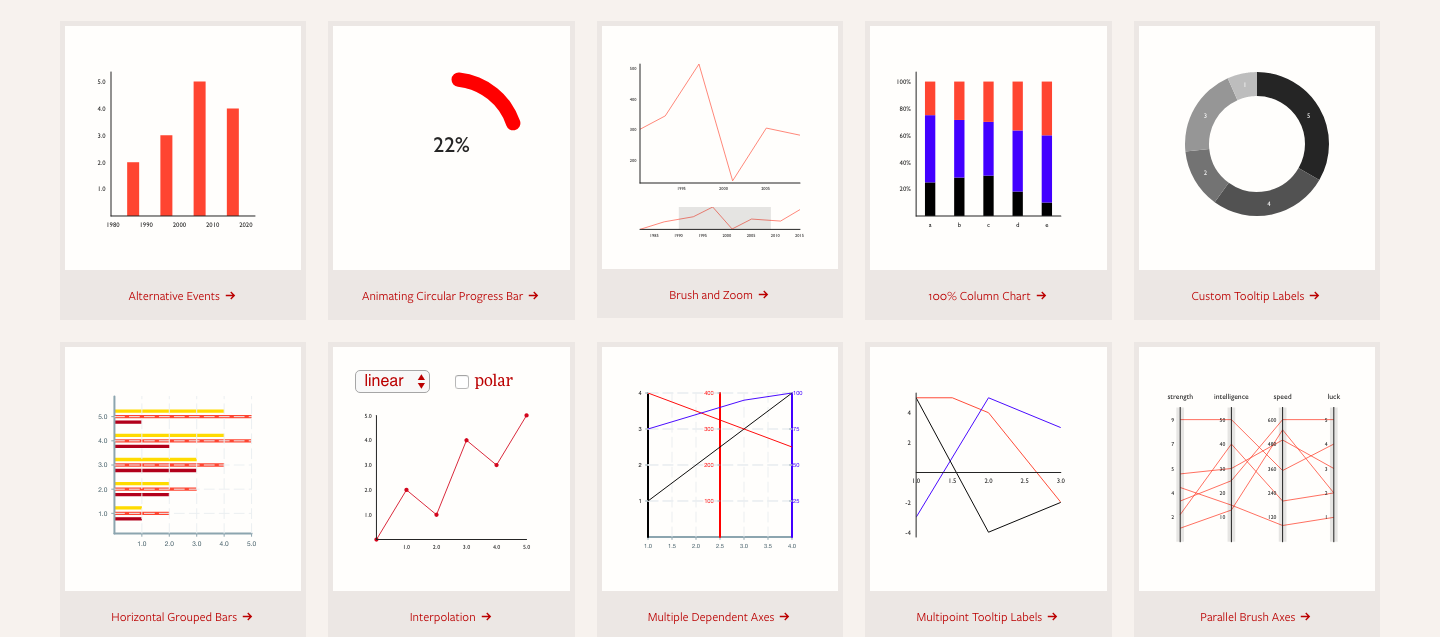
Victory Component Collection
Victory is a collection of React components designed to visualize data with support for interactive features. The project was created by Formidable Labs, he collected about 6 thousand stars on GitHub. Victory uses the same API for both conventional React applications and the React Native environment, which facilitates the development of cross-platform solutions. Victory offers the developer flexible and beautiful ways to use the capabilities of React-components for data visualization.

CartoDB service
The Carto platform(about 2 thousand stars on GitHub) is intended for visualization and analysis of geodata. Geodata can be loaded onto this platform (for example, in Shapefiles or GeoJSON formats), visualized, superimposed onto a map, styled with CartoCSS, and can be searched using SQL. There are video tutorials for working with this platform.
RAWGraphs
The RAWGraphs library , with about 5,000 stars on GitHub, provides a tool that allows you to link tables containing data with visualization tools. RAWGraphs is based on D3, it allows developers to create their own vector data visualization. It works with tabular data in different formats, supports data that can be simply copied from other applications. The results of RAWGraphs are presented in SVG format, they can be edited using the appropriate applications, or used on web pages in unchanged form. Here are examples of using this library.

Metabase
Library Metabase , which gathered more than 11 thousand stars on GitHub, offers a fairly quick and easy way to create dashboards that contain rendered data without requiring knowledge of SQL. At the same time, the library has a special SQL mode, intended for analysts and for people professionally involved in data processing. Metabase allows you to segment data by creating filters or filter sets, the library supports the creation of metrics - calculated indicators, which have to be addressed quite often. Other features of Metabase include support for sending data to Slack and providing the ability to work with them in this environment using MetaBot.. This library, perhaps, can be considered an excellent tool for data visualization within companies, although it should be noted that in order to master it, some efforts will be needed.
Taucharts The
library for visualizing Taucharts data (about 2 thousand stars on GitHub) is based on the D3 library. It provides the developer with a declarative interface for quickly organizing the connection of data fields with visual properties. Its architecture allows you to create diagrams in which variables are grouped using X and Y coordinates ( facet charts ). Taucharts allows you to extend the behavior of diagrams with plug-ins suitable for reuse.
We looked at JavaScript libraries for data visualization that you can use when developing web applications. Considering that we talked about the role of data in the modern world, it is not surprising that there are a huge number of solutions for data visualization. Therefore, here are some more similar libraries (studying them, pay attention to the fact that some of them have not been updated for a long time):
Dear readers! What libraries do you use to visualize data in your web projects?

Sometimes it can happen that the most valuable and interesting things that an application can give to a user are some data. However, if you present them in the form of something like a list or table, working with such data will most likely be tedious. In addition, if there is a lot of data, seeing only their simplest representation, the user will face difficulties in analyzing them and making any decisions based on them.
Data that represents an application to a user should not only have value for it by itself. They should be designed in such a way that it is quick, convenient and pleasant to work with them.
Today we present to your attention a translation of the material, which considers open-source JavaScript libraries for data visualization.
1. D3
Library D3
Perhaps the open source D3 library(also called D3.js) can be called the most popular of the existing JS libraries for data visualization. This project, in particular, has collected almost 80 thousand stars on GitHub. The library is designed to visualize data using technologies such as HTML, SVG, and CSS.
Thanks to the attention of the creators of the library to web standards, D3 gives developers a holistic, suitable for use in modern browsers environment for data visualization, eliminating the need to find some paid solutions. The D3 library combines components for data visualization and an approach to working with the DOM, which is based on, again, data. D3 allows you to output arbitrary data to the DOM, and then apply suitable transformations to the document. Here is an excellent gallery of examples of using this library.
By the way, pay attention to the fact that there is an opinion according to which D3 is not a library for data visualization at all . We believe you can decide for yourself what to consider it and whether to use it in your project.
2. Chart.js
Chart.js
Library Chart.js , attended by approximately 40 thousand stars on GitHub, is a very popular solution for creating the HTML5-graphs and charts based on the element
<canvas>, designed for the development of responsive web applications. The second version of the library currently relevant supports the combination of various types of graphs (there are 8 basic types of graphs), different coordinate systems. Chart.js can be used with the moment.js library. The library, if necessary, can be downloaded from cdnjs .3. Three.js
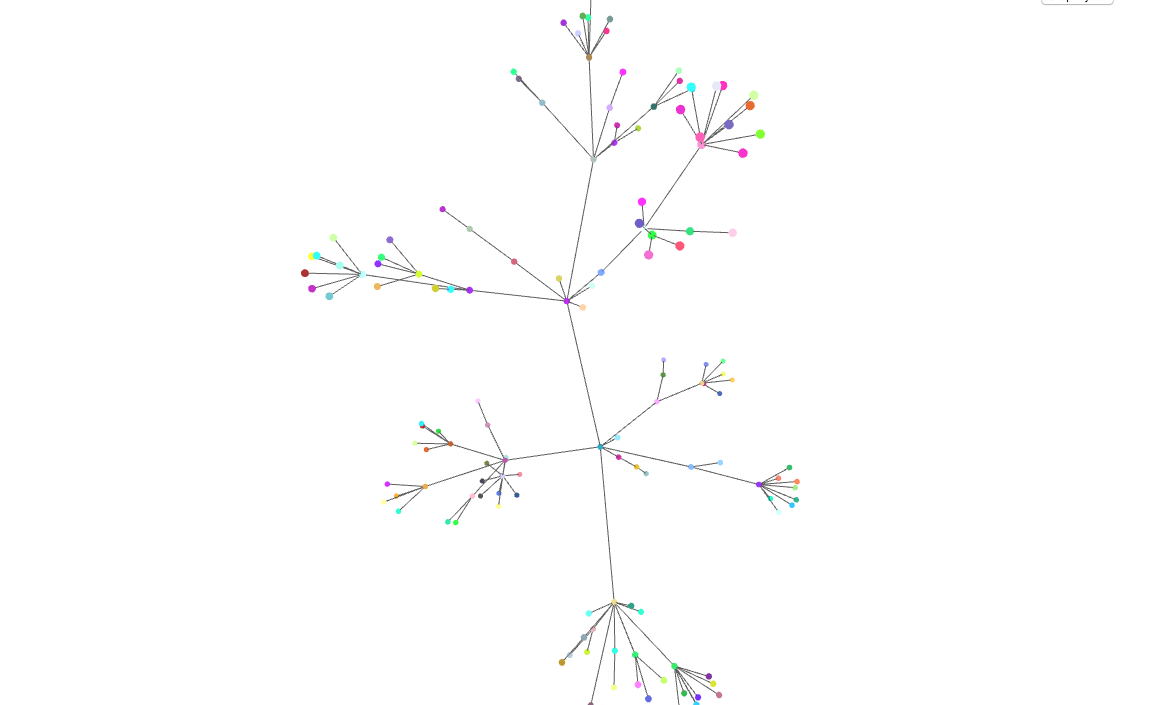
Three.js
Library Three.js is a very popular solution (about 45 000 stars on GitHub; contribution to the project made more than 1,000 people) to create a 3D-animation WebGL means. Flexibility and abstractness of the project means the possibility of using Three.js for data visualization in 2 and 3 dimensions. For example, here is a specialized module for Three.js, designed to create three-dimensional graphs. Here is an online sandbox for data visualization experiments. If you are thinking about visualizing data using WebGL - sure, it will be useful for you to take a look at Three.js.
4. ECharts and Highcharts JS
An example of working with ECharts (image taken from here )
ECharts - the Baidu project, which gathered about 30 thousand stars on GitHub, is a library for visualizing data and plotting graphs in the browser. It is written in pure JavaScript using the zrender libraryfor working with the element
<canvas>. The library supports plotting output using
<canvas>, SVG (4.0+) and VML. ECharts can be used not only when developing pages designed for desktop or mobile browsers, but also for organizing efficient server rendering. Here is a gallery of examples of using this library, which you can experiment with in an interactive environment.Highcharts JS
Library Highcharts JS is widely used, it has collected about 8000 stars on GitHub. The main mechanism it uses for data visualization is SVG technology, with the ability to switch to VML and
<canvas>to older browsers. It is stated that 72 of the world's 100 largest companies use this library, which, if this is true, makes this library the most popular charting solution for large companies such as Facebook and Twitter.5. MetricsGraphics.js
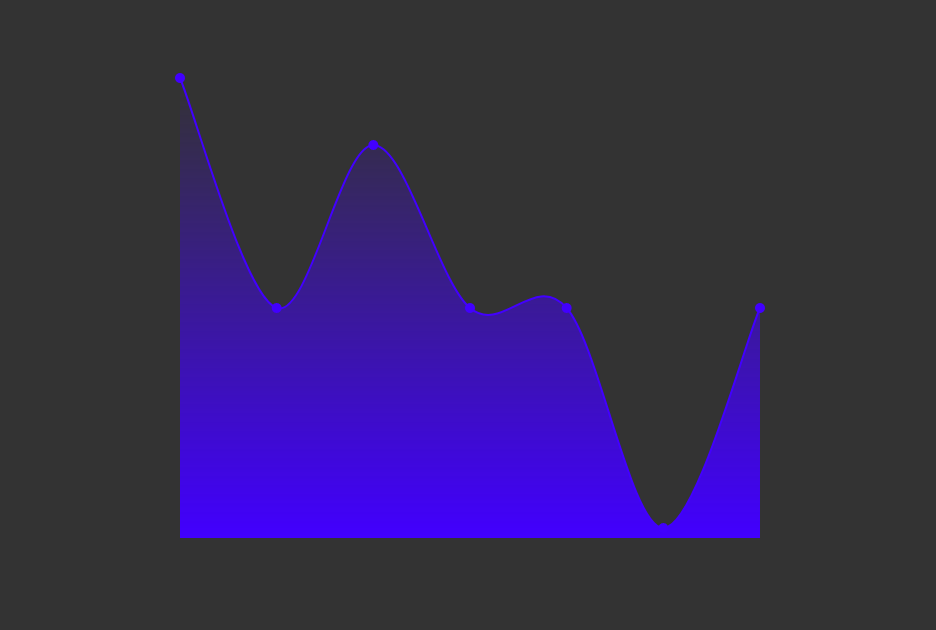
MetricsGraphics.js
Library MetricsGraphics.js (about 7 to thousands of stars GitHub) is a solution that is optimized for visualization in calculating time series. It differs in a relatively small size (80 Kb in minifitsirovanny form) and gives the developer a small but thoughtful set of highly specialized tools, among which are tools for constructing linear graphs, scatterplots, histograms, bar graphs, tables with data. Here is an interactive gallery of examples of working with this library.
6. Recharts
Recharts
Library Recharts , with nearly 10,000 stars on GitHub - is the solution for charting based on React and D3, the use of which looks like work with declarative React-components. The library gives the developer support for SVG. Its lightweight dependency tree (based on D3 submodules) is tweaking through the properties of the components. Here you can find examples of its use.
7. Raphaël
The Raphaël
"Vector" Raphaël library(about 10 thousand stars on GitHub) is designed to work with vector graphics in the web environment. It uses SVG and VML as basic technologies for creating graphic objects. As a result, graphic objects are also DOM objects to which you can connect, using JavaScript, event handlers. The library currently supports browsers such as Firefox 3.0+, Safari 3.0+, Chrome 5.0+, Opera 9.5+, and Internet Explorer 6.0+.
7. C3
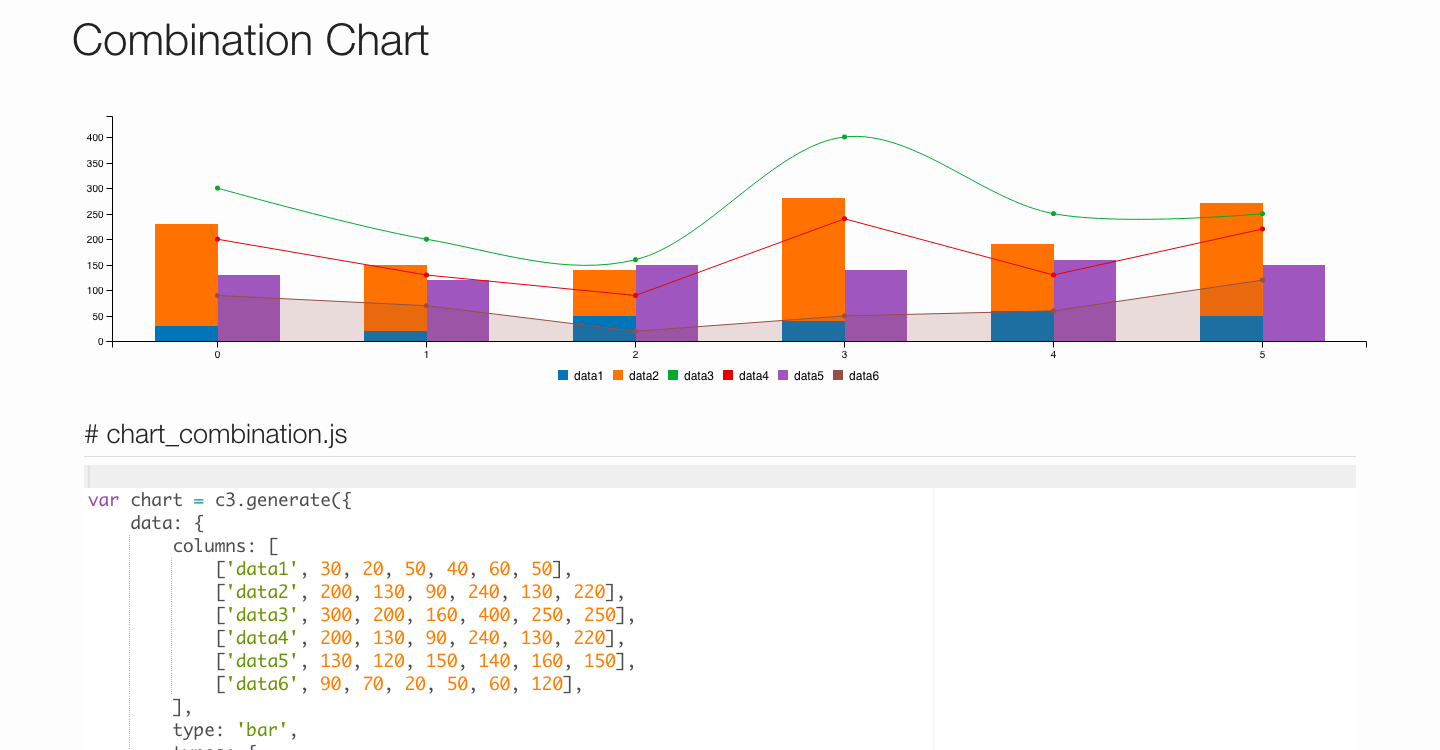
An example of the use of C3 Library
LibraryC3(about 8000 stars on GitHub) based on the D3, it gives the developer the ability to use classes for all of its elements, which allows you to define your own style class facilities and benefit from the opportunities D3. In addition, it supports various APIs and callbacks for organizing interactive interaction with graphics. Using them, you can update graphs even after they are displayed on the page. Here areexamples of using this library.
8. React-Vis, React Virtualized, Victory
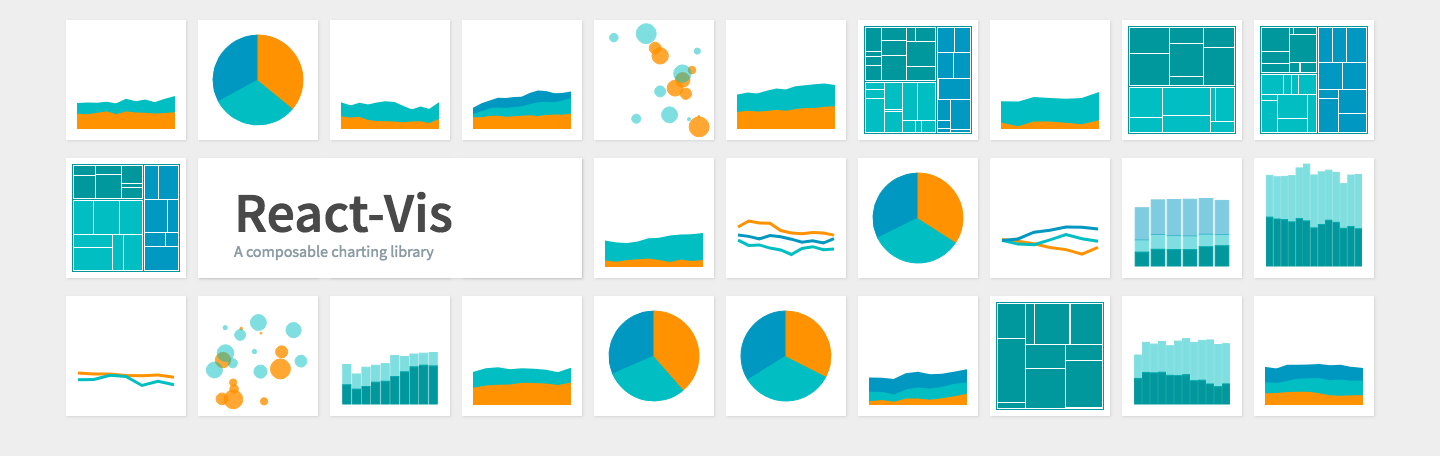
A set of components React-Vis
collection of components React-Vis (about 4 thousand stars on GitHub) developed by Uber and is intended for the organization of a uniform data visualization system React-applications. This solution supports the presentation of data in various forms, in particular, in the form of heat maps and scatterplots. To work with this library does not require prior acquaintance, say, with something like D3. It provides the developer with low-level modular building blocks like X / Y axes.
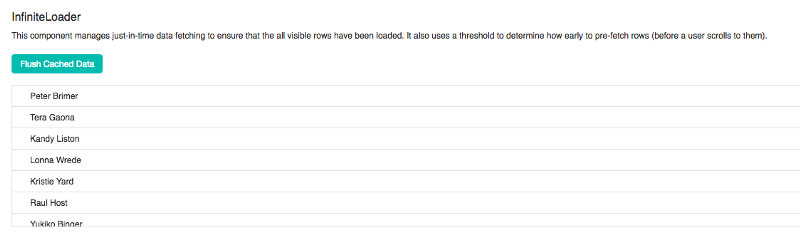
A set of components React virtualized
set of components React virtualized (about 12 thousand stars on GitHub) is designed for effective rendering large sets of table data. ES6, CommonJS and UMD assemblies are available React virtualized, the project supports Webpack 4. If you are going to use this set of components, pay attention to the Dependencies sectionin its documentation.
Victory Component Collection
Victory is a collection of React components designed to visualize data with support for interactive features. The project was created by Formidable Labs, he collected about 6 thousand stars on GitHub. Victory uses the same API for both conventional React applications and the React Native environment, which facilitates the development of cross-platform solutions. Victory offers the developer flexible and beautiful ways to use the capabilities of React-components for data visualization.
9. CartoDB
CartoDB service
The Carto platform(about 2 thousand stars on GitHub) is intended for visualization and analysis of geodata. Geodata can be loaded onto this platform (for example, in Shapefiles or GeoJSON formats), visualized, superimposed onto a map, styled with CartoCSS, and can be searched using SQL. There are video tutorials for working with this platform.
10. RAWGraphs
RAWGraphs
The RAWGraphs library , with about 5,000 stars on GitHub, provides a tool that allows you to link tables containing data with visualization tools. RAWGraphs is based on D3, it allows developers to create their own vector data visualization. It works with tabular data in different formats, supports data that can be simply copied from other applications. The results of RAWGraphs are presented in SVG format, they can be edited using the appropriate applications, or used on web pages in unchanged form. Here are examples of using this library.
11. Metabase
Metabase
Library Metabase , which gathered more than 11 thousand stars on GitHub, offers a fairly quick and easy way to create dashboards that contain rendered data without requiring knowledge of SQL. At the same time, the library has a special SQL mode, intended for analysts and for people professionally involved in data processing. Metabase allows you to segment data by creating filters or filter sets, the library supports the creation of metrics - calculated indicators, which have to be addressed quite often. Other features of Metabase include support for sending data to Slack and providing the ability to work with them in this environment using MetaBot.. This library, perhaps, can be considered an excellent tool for data visualization within companies, although it should be noted that in order to master it, some efforts will be needed.
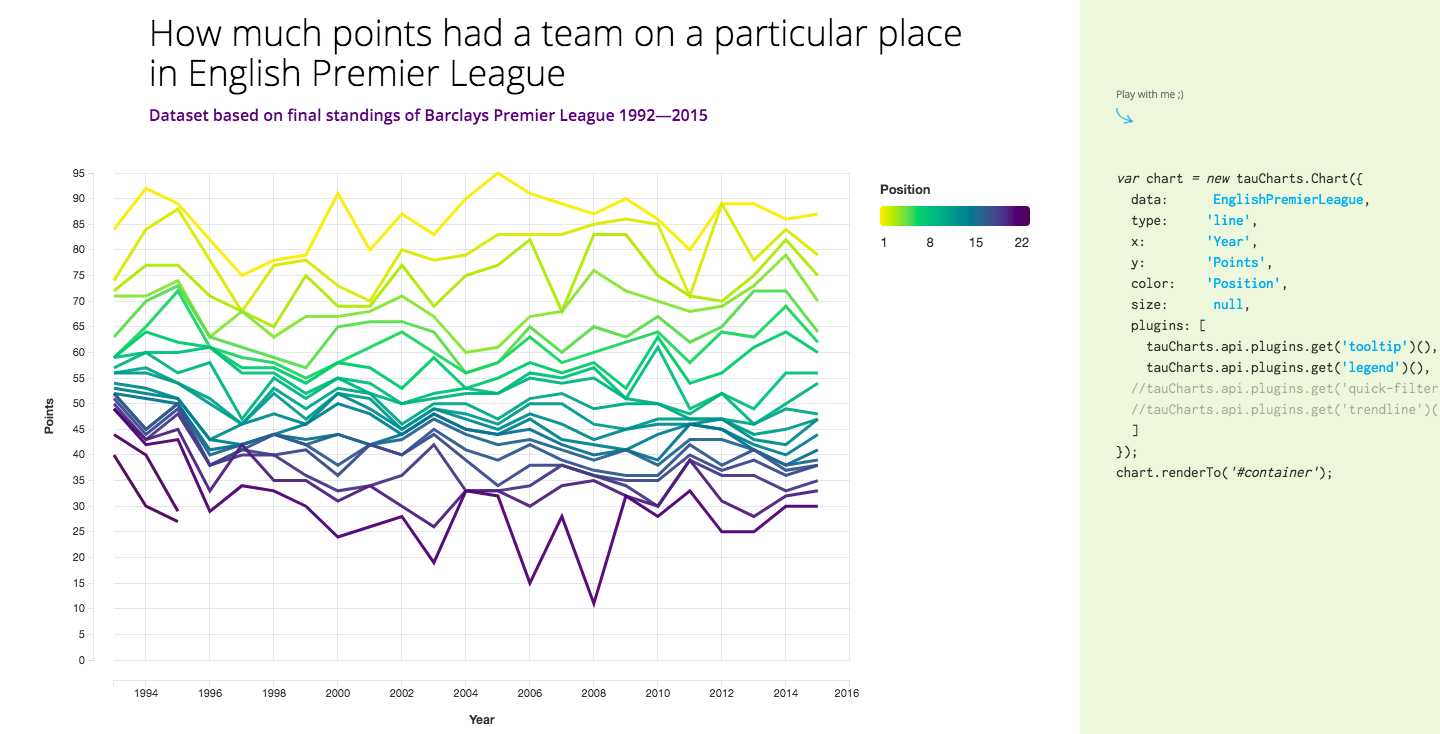
Bonus Library: Taucharts
Taucharts The
library for visualizing Taucharts data (about 2 thousand stars on GitHub) is based on the D3 library. It provides the developer with a declarative interface for quickly organizing the connection of data fields with visual properties. Its architecture allows you to create diagrams in which variables are grouped using X and Y coordinates ( facet charts ). Taucharts allows you to extend the behavior of diagrams with plug-ins suitable for reuse.
Results
We looked at JavaScript libraries for data visualization that you can use when developing web applications. Considering that we talked about the role of data in the modern world, it is not surprising that there are a huge number of solutions for data visualization. Therefore, here are some more similar libraries (studying them, pay attention to the fact that some of them have not been updated for a long time):
Dear readers! What libraries do you use to visualize data in your web projects?