OpenFOAM for Dummies
Some time ago, I was looking for a description of operations, processes that occur in the OpenFOAM library of numerical simulation. I found many abstract descriptions of the finite volume method, classical difference schemes, and various physical equations. I wanted to know in more detail - where did these values come from in such and such an output file, what expressions are behind these or those parameters in the fvSchemes, fvSolution settings files?
For those who are also interested - this article. Those who are familiar with OpenFOAM or with methods implemented in it - write about the errors found and inaccuracies in PM.
There were already a couple of articles about OpenFOAM on the hub:
OpenFOAM in practice
OpenFOAM from the point of view of a physics programmer
Therefore, I will not dwell on the fact that this is an “open (GPL) platform for numerical simulation, intended for modeling related to the solution of partial differential equations by the finite volume method, and widely used to solve problems of continuum mechanics”.
Today, with a simple example, I will describe the operations that occur during the calculation in OpenFOAM.
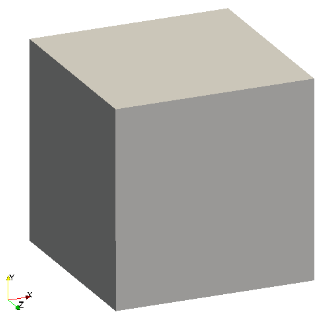
So, the geometry is given - a cube with a side of 1 meter:
We are faced with the task of simulating the flow-propagation of a certain scalar field (temperature, amount of substance), which is given by the following transport equation (1) inside the body volume.
(1)
 ,
,
wherein the scalar value, for example, expresses the temperature [K] or the concentration of a substance, and
 expresses substance transfer, mass flow [kg / s].
This equation, for example, is used to simulate the distribution of heat
 ,
,
where k is the thermal conductivity, and is the temperature [K].
The boundary conditions of the problem are as follows: there is a face-in, face-out, the other faces are smooth walls.

Our grid will be very simple - divide the cube into 5 equal cells along the Z axis.

The finite volume method provides that (1) in integral form (2) will be performed for each final volume .
.
(2)
 ,
,
where is the geometric center of the finite volume.
To simplify, we transform the first term of expression (2) as follows:
(2.1) (HJ-3.12) *


As you can see, we accepted that the scalar quantity changes linearly inside the final volume and the value of the quantity at some point
  inside the final volume can be calculated as:
(2.2 )
 ,
,
where
To simplify the second term of expression (2), we use the generalized Gauss-Ostrogradsky theorem : the integral of the divergence of the vector field in volume
  is equal to the flow of the vector through the surface
  bounding the given volume. In human language, “the sum of all flows to / from a finite volume is equal to the sum of flows through the faces of this finite volume”:
(2.3)
 ,
,
where closed surface bounding volume ,
 - a vector directed along the normal of the volume
  .
.
Considering that the finite volume is limited by a set of flat faces, expression (2.3) can be converted to the sum of the integrals over the surface:
(2.4) (HJ-3.13)
 ,
,
where it expresses the value of the variable in the center of the face,
is the area vector, leaves the center of the face, is directed away from a cell (locally), away from a cell with a lower index to a cell with a higher index (globally).
In order not to store the same vector parameterstwice, because it is obvious that in two neighboring cells, the normal vector to the boundary between the cells, directed away from the center of the cell will differ only in the direction-sign. Therefore, an owner-neighbor relationship was created between the face and the cell. If the area vector (global, the positive direction from the cell with the lower index to the cell with the higher index) indicates FROM the center of the  cell, this relationship between the cell and the vector , more precisely between the cell and the face, is indicated by owner). If this vector
  points inside the cell in question, then the relation is neighbor. Direction affects the sign of the magnitude (+ for owner and - for neighbor) and this is important when adding up, see below.

(HJ-3.16)
The valuein the center of the face is calculated through the values in the centers of adjacent cells - the method of such an expression is called a difference scheme. In OpenFOAM, the difference scheme type is specified in the / system / fvSchemes file :
Gauss - means that the central difference scheme is selected;
linear - means that interpolation from the centers of cells to the centers of faces will occur linearly.

Suppose that our scalar quantity varies linearly from a center to faces within a finite volume. Then the value approximated in the center of the face will be calculated according to the formula:
Where are the weights and are
  calculated as
Where are the volumes of the cells.
For cases of beveled cells, there are more complex formulas for calculating approximation weights.
Thus, the phi_f values at the centers of the cell faces are calculated based on the values at the centers of the cells. Gradient values grad (phi) are calculated based on phi_f values.
And this whole algorithm can be represented as the following pseudocode.
Considering (2.1) and (2.4), expression (2) takes the form:
(3)
According to the finite volume method, time sampling is performed and expression (3) is written as:
(4)
Integrate (4):
(4.1)
Separate the left and right sides on :
:
(5)
Now we can get a system of linear equations for each finite volume .
.
Below is the numbering of the grid nodes that we will use.

Numbering of node-centers of cells (50, 51 - centers of boundary faces):

Numbering of node-centers of faces:

Volumes of elements:

Interpolation coefficients needed to calculate values on cell faces. The index "e" stands for "the right side of the cell." The right one relative to the view, as in the figure “Numbering of node-centers of cells”:
For P = 0.
Expression (5) describing the behavior of the quantity
will be transformed into a system of linear algebraic equations, each of which is of the form:

or, according to the indices of the points on the faces

A, all flows to / from the cell can also be expressed as a sum
where, for example , Is the linearization coefficient of the flow at the point-center of the cell E,
 is the linearization coefficient of the flow at the point-center of the face,
 is the nonlinear part (for example, a constant).
According to the numbering of the faces, the expression will take the form:
Given the boundary conditions for the element P_0, the linear algebraic equation can be represented as
... substitute the coefficients obtained earlier ...
The flow from inlet is directed to the cell, therefore it has a negative sign.

Since in our control expression there is a time term in addition to the diffusion term, but the final equation looks like


For P = 1.

For P = 4.

The system of linear algebraic equations (SLAE) can be represented in matrix form as
 ,
,
where
Next, the obtained SLAE is solved by the solver specified in fvSchemes .
And the result is a vector of values
on the basis of which the values for the vector are obtained.


Then the vector issubstituted into the SLAE and a new iteration of vector calculation takes place .
And so on until the residual reaches the required limits.
* Some equations in this article are taken from the dissertation of Yasak Hrvoe (HJ is the equation number) and if someone wants to read more about them ( http://powerlab.fsb.hr/ped/kturbo/OpenFOAM/docs/HrvojeJasakPhD.pdf )
You can download the task files here:
github.com/j-avdeev/case Solver
files:
github.com/j-avdeev/matrHyper1Foam
As a bonus, a video on how concentration is distributed.
For those who are also interested - this article. Those who are familiar with OpenFOAM or with methods implemented in it - write about the errors found and inaccuracies in PM.
There were already a couple of articles about OpenFOAM on the hub:
OpenFOAM in practice
OpenFOAM from the point of view of a physics programmer
Therefore, I will not dwell on the fact that this is an “open (GPL) platform for numerical simulation, intended for modeling related to the solution of partial differential equations by the finite volume method, and widely used to solve problems of continuum mechanics”.
Today, with a simple example, I will describe the operations that occur during the calculation in OpenFOAM.
So, the geometry is given - a cube with a side of 1 meter:
We are faced with the task of simulating the flow-propagation of a certain scalar field (temperature, amount of substance), which is given by the following transport equation (1) inside the body volume.
(1)
, wherein
the scalar value, for example, expresses the temperature [K] or the concentration of a substance, andexpresses substance transfer, mass flow [kg / s]. This equation, for example, is used to simulate the distribution of heat
, where k is the thermal conductivity, and
is the temperature [K].The divergence operator is actually
operator  .
.
Recall that there exists a nabla (Hamiltonian operator), the operator, which is written as follows:
 ,
,
where i, j, k - unit vectors.
If we scalarly multiply the nabl operator by a vector quantity, then we obtain the divergence of this vector:
“From the point of view of physics, the divergence of a vector field is an indicator of the extent to which a given point in space is the source or sink of this field”
If we multiply the nabl operator by a scalar, it turns out gradient of this scalar:
The gradient shows an increase or decrease in any direction of the magnitude of the scalar .
.
. Recall that there exists a nabla (Hamiltonian operator), the operator, which is written as follows:
, where i, j, k - unit vectors.
If we scalarly multiply the nabl operator by a vector quantity, then we obtain the divergence of this vector:
“From the point of view of physics, the divergence of a vector field is an indicator of the extent to which a given point in space is the source or sink of this field”
If we multiply the nabl operator by a scalar, it turns out gradient of this scalar:
The gradient shows an increase or decrease in any direction of the magnitude of the scalar
.The boundary conditions of the problem are as follows: there is a face-in, face-out, the other faces are smooth walls.
Partitioning the volume of a cube into finite volumes
Our grid will be very simple - divide the cube into 5 equal cells along the Z axis.
Many formulas
The finite volume method provides that (1) in integral form (2) will be performed for each final volume
. (2)
, where
is the geometric center of the finite volume.Center of final volume
To simplify, we transform the first term of expression (2) as follows:
(2.1) (HJ-3.12) *
As you can see, we accepted that the scalar quantity changes linearly inside the final volume and the value of the quantity
at some point inside the final volume can be calculated as: (2.2 )
, where
To simplify the second term of expression (2), we use the generalized Gauss-Ostrogradsky theorem : the integral of the divergence of the vector field
in volume is equal to the flow of the vector through the surface bounding the given volume. In human language, “the sum of all flows to / from a finite volume is equal to the sum of flows through the faces of this finite volume”: (2.3)
, where
closed surface bounding volume , - a vector directed along the normal of the volume .Vector S
Considering that the finite volume is limited by a set of flat faces, expression (2.3) can be converted to the sum of the integrals over the surface:
(2.4) (HJ-3.13)
, where it
expresses the value of the variable in the center of the face, is the area vector, leaves the center of the face, is directed away from a cell (locally), away from a cell with a lower index to a cell with a higher index (globally).A little more about the vector S
In order not to store the same vector parameters
twice, because it is obvious that in two neighboring cells, the normal vector to the boundary between the cells, directed away from the center of the cell will differ only in the direction-sign. Therefore, an owner-neighbor relationship was created between the face and the cell. If the area vector (global, the positive direction from the cell with the lower index to the cell with the higher index) indicates FROM the center of the cell, this relationship between the cell and the vector , more precisely between the cell and the face, is indicated by owner). If this vector points inside the cell in question, then the relation is neighbor. Direction affects the sign of the magnitude (+ for owner and - for neighbor) and this is important when adding up, see below. (HJ-3.16)
About difference schemes
The value
in the center of the face is calculated through the values in the centers of adjacent cells - the method of such an expression is called a difference scheme. In OpenFOAM, the difference scheme type is specified in the / system / fvSchemes file :divSchemes
{
default none;
div(phi,psi) Gauss linear;
}
Gauss - means that the central difference scheme is selected;
linear - means that interpolation from the centers of cells to the centers of faces will occur linearly.
Suppose that our scalar quantity varies linearly from a center to faces within a finite volume. Then the value approximated in the center of the face will be calculated according to the formula:
Where are the weights
and are calculated as Where
are the volumes of the cells. For cases of beveled cells, there are more complex formulas for calculating approximation weights.
Thus, the phi_f values at the centers of the cell faces are calculated based on the values at the centers of the cells. Gradient values grad (phi) are calculated based on phi_f values.
And this whole algorithm can be represented as the following pseudocode.
1. Объявляем массив градиентов конечных объемов, инициализируем его нулями
2. Пробегаемся по всем внутренним граням (которые не граничные)
    > Вычисляем flux_f = phi_f*S_f. Значения phi_f вычисляем на основе значений phi в центах ячеек
    > Добавляем flux_f к градиенту элемента-owner и -flux_f к градиенту элемента-neighbour
3. Пробегаемся по всем граничным граням
    > Вычисляем flux_f = phi_f*S_f
    > Добавляем flux_f к градиенту элементу-owner (neighbour-элементов у граничных граней нет)
4. Пробегаемся по всем элементам
    > Делим получившуюся сумму-градиент на объем элемента
Time discretization
Considering (2.1) and (2.4), expression (2) takes the form:
(3)
According to the finite volume method, time sampling is performed and expression (3) is written as:
(4)
Integrate (4):
(4.1)
Separate the left and right sides on
: (5)
Data for Sample Matrix
Now we can get a system of linear equations for each finite volume
. Below is the numbering of the grid nodes that we will use.
Node coordinates are stored in / constant / polyMesh / points
 24
 (
 (0 0 0)
 (1 0 0)
 (0 1 0)
 (1 1 0)
 (0 0 0.2)
 (1 0 0.2)
 (0 1 0.2)
 (1 1 0.2)
 (0 0 0.4)
 (1 0 0.4)
 (0 1 0.4)
 (1 1 0.4)
 (0 0 0.6)
 (1 0 0.6)
 (0 1 0.6)
 (1 1 0.6)
 (0 0 0.8)
 (1 0 0.8)
 (0 1 0.8)
 (1 1 0.8)
 (0 0 1)
 (1 0 1)
 (0 1 1)
 (1 1 1)
 )
Numbering of node-centers of cells (50, 51 - centers of boundary faces):
Numbering of node-centers of faces:
Volumes of elements:
Interpolation coefficients needed to calculate values on cell faces. The index "e" stands for "the right side of the cell." The right one relative to the view, as in the figure “Numbering of node-centers of cells”:
Formation of a sampling matrix
For P = 0.
Expression (5) describing the behavior of the quantity
will be transformed into a system of linear algebraic equations, each of which is of the form:
or, according to the indices of the points on the faces
A, all flows to / from the cell can also be expressed as a sum
where, for example ,
Is the linearization coefficient of the flow at the point-center of the cell E, is the linearization coefficient of the flow at the point-center of the face, is the nonlinear part (for example, a constant). According to the numbering of the faces, the expression will take the form:
Given the boundary conditions for the element P_0, the linear algebraic equation can be represented as
... substitute the coefficients obtained earlier ...
The flow from inlet is directed to the cell, therefore it has a negative sign.
Since in our control expression there is a time term in addition to the diffusion term, but the final equation looks like
For P = 1.
For P = 4.
The system of linear algebraic equations (SLAE) can be represented in matrix form as
, where
=== A(i,j) ===
40.5 0.5 0 0 0
-0.5 40 0.5 0 0
0 -0.5 40 0.5 0
0 0 -0.5 40 0.5
0 0 0 -0.5 40.5
=== b(i,j) ===
1
0
0
0
0
Next, the obtained SLAE is solved by the solver specified in fvSchemes .
And the result is a vector of values
psi = dimensions      [0 0 0 0 0 0 0];
internalField   nonuniform List 5(0.0246875 0.000308546 3.85622e-06 4.81954e-08 5.95005e-10);
on the basis of which the values for the vector are obtained.
Then the vector is
substituted into the SLAE and a new iteration of vector calculation takes place . And so on until the residual reaches the required limits.
References
* Some equations in this article are taken from the dissertation of Yasak Hrvoe (HJ is the equation number) and if someone wants to read more about them ( http://powerlab.fsb.hr/ped/kturbo/OpenFOAM/docs/HrvojeJasakPhD.pdf )
You can download the task files here:
github.com/j-avdeev/case Solver
files:
github.com/j-avdeev/matrHyper1Foam
As a bonus, a video on how concentration is distributed
.