Qwt and Qt Creator. Part 3: a graph as a designer form element
- Tutorial
The examples used Qt Creator 3.0.0 (MinGW) and Qwt-6.1.0.
To understand this article, the reader must have an initial experience in developing windows applications in the Qt Creator environment, and understand the concept of “signal-slot”. It is also recommended to get acquainted with part 1 and 2 of the series of my articles about Qwt:
habrahabr.ru/post/211204
habrahabr.ru/post/211867
Qwt is a graphical library that can greatly simplify the process of visualizing data in the program. The simplification is as follows: there is no need to manually prescribe display elements, such as coordinate scales, grids, data curves, etc. It is only necessary to set the parameters of these elements.
In the previous parts of the article series, graph controls were added manually. I think most programmers would prefer to use Qt Creator.
In part 3, we will do the following:
• add a widget to display the graph in the Designer Form, which will allow you to use Qt Creator controls;
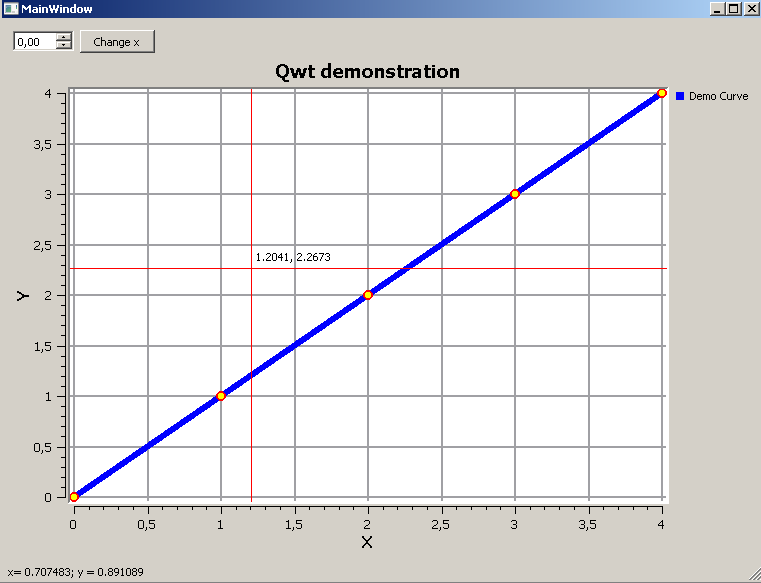
• build a demonstration curve, implement the basic amenities of working with a chart: the ability to move around the chart field, its approximation / deletion, display the coordinates of the cursor when moving it;
• display the coordinates of the click in the status bar of the Designer Form;
• Move the curve along the x axis using standard controls from Qt Creator.
The content of this article to some extent duplicates the content of part number 2. This was done on purpose, because I wanted to make the articles independent of each other.
Add a widget to display the graph in the Designer Form
1. Create a project with Mainwindow. Let me remind you the mandatory procedure for using Qwt: add the line “CONFIG + = qwt” to the project .pro file and run qmake through the context menu (right-click on the project root folder).
2. Open the form editor and find the Widget widget. We place it on the form.
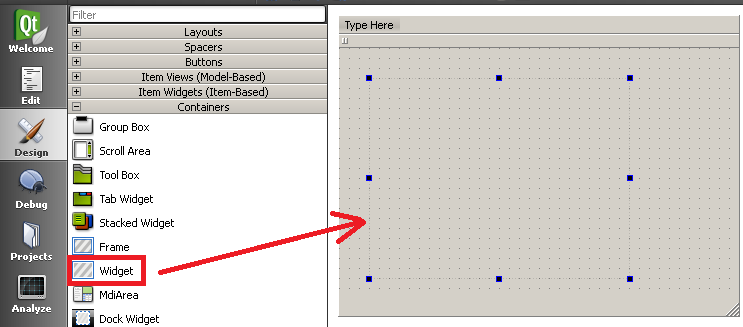
3. Change the name of the added “Widget” to “Qwt_Widget”.
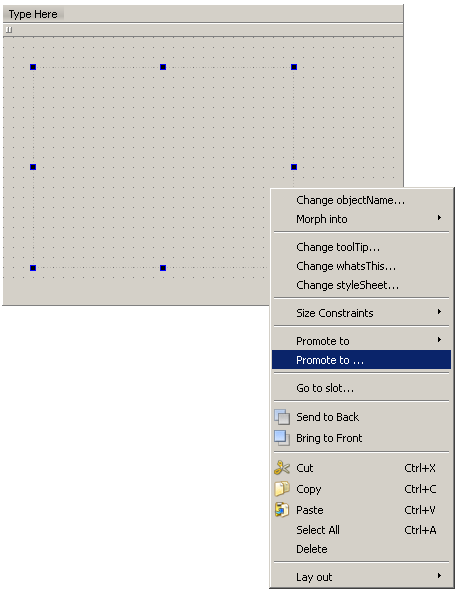
4. Right-click on “Qwt_Widget” and select “Promote to ...”
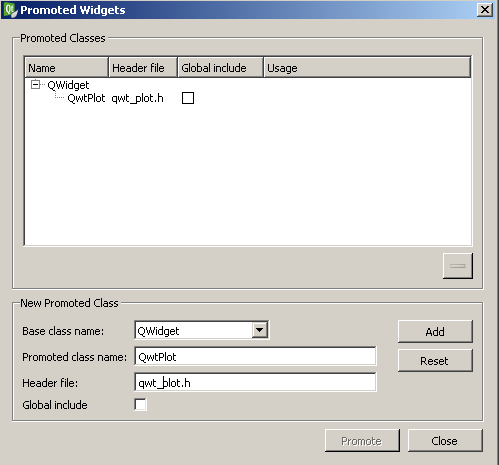
5. In the Promoted class name field, type “QwtPlot”. In the Header file field, change "qwtplot.h" to "qwt_plot.h". Click Add and close the window.
2. Open the form editor and find the Widget widget. We place it on the form.
3. Change the name of the added “Widget” to “Qwt_Widget”.
4. Right-click on “Qwt_Widget” and select “Promote to ...”
5. In the Promoted class name field, type “QwtPlot”. In the Header file field, change "qwtplot.h" to "qwt_plot.h". Click Add and close the window.
We will build a demo curve, implement the basic amenities of working with a chart
Below is a code that is largely similar to that published in part 2. The code is slightly improved, the fragments responsible for the "manual" addition of controls are removed.
Pay particular attention to the following. Previously, we created the private variable QwtPlot * d_plot, and then used a construction such as, for example:
Now, to configure the properties of the chart, we will use the following construction:
Moreover, if such constructs are absent in the code, then Qwt_Widget is empty. After adding a line with the setting, this widget starts displaying the graph field.
The performed actions allow us to display the graph directly in the form, and the dimensions of its canvas correspond to the dimensions of "Qwt_Widget". After compiling and starting the program, try resizing the form. The dimensions of Qwt_Widget, of course, are not changed. For this to happen, you must use the "Layout". I decided not to describe this standard (exhausted and left) procedure in the article.
Pay particular attention to the following. Previously, we created the private variable QwtPlot * d_plot, and then used a construction such as, for example:
d_plot->setTitle( "Qwt demonstration" );
Now, to configure the properties of the chart, we will use the following construction:
ui->Qwt_Widget->setTitle( "Qwt demonstration" );
Moreover, if such constructs are absent in the code, then Qwt_Widget is empty. After adding a line with the setting, this widget starts displaying the graph field.
Mainwindow.h file content
#ifndef MAINWINDOW_H
#define MAINWINDOW_H
#include
#include
#include
#include
#include
#include
#include
#include
#include
#include
namespace Ui {
class MainWindow;
}
class MainWindow : public QMainWindow
{
    Q_OBJECT
public:
    explicit MainWindow(QWidget *parent = 0);
    ~MainWindow();
private Q_SLOTS:
    void click_on_canvas( const QPoint &pos );
private:
    Ui::MainWindow *ui;
    void addPlot();
    void addPlotGrid();
    QwtPlotCurve *curve;
    QPolygonF points;
    void addCurve();
    void enableMagnifier();
    void enableMovingOnPlot();
    void enablePicker();
};
#endif // MAINWINDOW_H
Mainwindow.cpp file content
#include "mainwindow.h"
#include "ui_mainwindow.h"
MainWindow::MainWindow(QWidget *parent) :
    QMainWindow(parent),
    ui(new Ui::MainWindow)
{
    ui->setupUi(this);
    // Создать поле со шкалами для отображения графика
    addPlot();
    // Включить масштабную сетку
    addPlotGrid();
    // Кривая
    addCurve();
    // Включить возможность приближения/удаления графика
    enableMagnifier();
    // Включить возможность перемещения по графику
    enableMovingOnPlot();
    // Включить отображение координат курсора и двух перпендикулярных
    // линий в месте его отображения
    enablePicker();
}
MainWindow::~MainWindow()
{
    delete ui;
}
void MainWindow::addPlot()
{
    // #include
    ui->Qwt_Widget->setTitle( "Qwt demonstration" );
    ui->Qwt_Widget->setCanvasBackground( Qt::white );
    // Параметры осей координат
    ui->Qwt_Widget->setAxisTitle(QwtPlot::yLeft, "Y");
    ui->Qwt_Widget->setAxisTitle(QwtPlot::xBottom, "X");
    ui->Qwt_Widget->insertLegend( new QwtLegend() );
}
void MainWindow::addPlotGrid()
{
    // #include
    QwtPlotGrid *grid = new QwtPlotGrid();
    grid->setMajorPen(QPen( Qt::gray, 2 )); // цвет линий и толщина
    grid->attach( ui->Qwt_Widget );
}
void MainWindow::addCurve()
{
    //#include
    curve = new QwtPlotCurve();
    curve->setTitle( "Demo Curve" );
    curve->setPen( Qt::blue, 6 ); // цвет и толщина кривой
    // Маркеры кривой
    // #include
    QwtSymbol *symbol = new QwtSymbol( QwtSymbol::Ellipse,
        QBrush( Qt::yellow ), QPen( Qt::red, 2 ), QSize( 8, 8 ) );
    curve->setSymbol( symbol );
    // Добавить точки на ранее созданную кривую
    // Значения точек записываются в массив, затем считываются
    // из этого массива
    for (int i = 0; i < 5; i++) {
        points << QPointF( 1.0 * i, 1.0 * i); // произвольное заполнение
    }
    curve->setSamples( points ); // ассоциировать набор точек с кривой
    curve->attach( ui->Qwt_Widget ); // отобразить кривую на графике
}
void MainWindow::enableMagnifier()
{
    // #include
    QwtPlotMagnifier *magnifier =
            new QwtPlotMagnifier(ui->Qwt_Widget->canvas());
    // клавиша, активирующая приближение/удаление
    magnifier->setMouseButton(Qt::MidButton);
}
void MainWindow::enableMovingOnPlot()
{
    // #include
    QwtPlotPanner *d_panner = new QwtPlotPanner( ui->Qwt_Widget->canvas() );
    // клавиша, активирующая перемещение
    d_panner->setMouseButton( Qt::RightButton );
}
void MainWindow::enablePicker()
{
    // #include
    // настройка функций
    QwtPlotPicker *d_picker =
            new QwtPlotPicker(
                QwtPlot::xBottom, QwtPlot::yLeft, // ассоциация с осями
    QwtPlotPicker::CrossRubberBand, // стиль перпендикулярных линий
    QwtPicker::AlwaysOn, // всегда включен
    ui->Qwt_Widget->canvas() ); // ассоциация с полем
    // Цвет перпендикулярных линий
    d_picker->setRubberBandPen( QColor( Qt::red ) );
    // цвет координат положения указателя
    d_picker->setTrackerPen( QColor( Qt::black ) );
    // непосредственное включение вышеописанных функций
    d_picker->setStateMachine( new QwtPickerDragPointMachine() );
}
The performed actions allow us to display the graph directly in the form, and the dimensions of its canvas correspond to the dimensions of "Qwt_Widget". After compiling and starting the program, try resizing the form. The dimensions of Qwt_Widget, of course, are not changed. For this to happen, you must use the "Layout". I decided not to describe this standard (exhausted and left) procedure in the article.
Display the click coordinates in the status bar of the Designer Form
1. Add the code to the prototype of the MainWindow class in the mainwindow.h file
we implement the slot (function) in mainwindow.cpp:
Add the following line to the enablePicker () function:
Alternatively, one could declare d_picker as a private variable of the MainWindow class and make the above signal-slot connection in the constructor or in a special method.
private Q_SLOTS:
void click_on_canvas( const QPoint &pos );
we implement the slot (function) in mainwindow.cpp:
void MainWindow::click_on_canvas( const QPoint &pos )
{
    // считываем значения координат клика
    double x = ui->Qwt_Widget->invTransform(QwtPlot::xBottom, pos.x());
    double y = ui->Qwt_Widget->invTransform(QwtPlot::yLeft, pos.y());
    statusBar()->showMessage("x= " + QString::number(x) +
                             "; y = " + QString::number(y));
}
Add the following line to the enablePicker () function:
    connect( d_picker, SIGNAL( appended( const QPoint & ) ),
            SLOT( click_on_canvas( const QPoint & ) ) );
Alternatively, one could declare d_picker as a private variable of the MainWindow class and make the above signal-slot connection in the constructor or in a special method.
Move the curve along the x axis
Here, since the visualizer was added using the “Widget”, everything is simple and familiar:
1. Add the “Double Spin box” control to the form and rename it to “changeXSpinBox”.
2. Add the “PushButton” control to the form and rename it “moveByXButton”. Change the text on the button to “Change x”.
3. For "moveByXButton", execute the command "Go to slot" -> clicked.
4. The function should look like this:
void MainWindow::on_moveByXButton_clicked()
{
    double x = 0.0;
    // Выполняется преобразование ',' на '.' для того, чтобы
    // текст spinBox мог бы быть преобразован в double
    QString spinBoxText = ui->changeXSpinBox->text().replace(
                QLocale().decimalPoint(), QLatin1Char('.'));
    double xChangeValue = spinBoxText.toDouble();
    for (int i = 0; i setSamples(points);
    ui->Qwt_Widget->replot();
}
Conclusions: we have successfully used the design tools of Qt Creator to create a visualizer and its demonstration controls. Using the spinBox and the button, we can change the x coordinate of the points of the displayed curve.
In part 4 of the series of articles, we implement additional ways to increase / decrease the graph, select points using the mouse, editing tools for displaying the graph and curves, as well as export the graph.
PS I express my deep gratitude to Riateche for the valuable comments on articles No. 1 and No. 2, which were taken into account when writing this article.
Links:
Sources:
github.com/VladimirSap/Qwt_Tutorial
Official resource:
qwt.sourceforge.net
Collection of solutions to various problems with Qwt:
www.qtcentre.org/archive/index.php/f-23.html
Library option, alternative to Qwt (thanks, GooRoo )
www.qcustomplot.com
Links to previous articles in the series:
Part 1: habrahabr.ru/post/211204
Part 2 : habrahabr.ru/post/211867
Only registered users can participate in the survey. Please come in.
How do you prefer to add controls (widgets)?
- 56.7% Using Designer 55
- 39.1% manually encoded 38
- 4.1% Personally, the GUI itself is not doing 4
Choose your preferred content for subsequent articles.
- 32% With an interface made using Designer 16
- 24% With manual interface coding 12
- 38%. Let both options be present in the article. 19
- 6% does not matter 3