January 14, 2014 at 12:41
Debugging with XDebug and PhpStorm on the example of 1C-Bitrix site
In this article I will tell you how convenient it is to debug code in PhpStorm using the example of working with a website running in 1C-Bitrix system. We will work with the PhpStorm IDE and the XDebug debugger. I assume that XDebug is already installed on your server and you already have a project created in PhpStorm.
This article provides examples with this set of tools:
So, let's begin.
During development, you often have to use functions like print_r () or echo to display data on the screen. Until recently, I personally used functions like:
This function printed the array onto the screen and already in this form I parsed it and entered it into the editing code. But what if the huge $ arResult print on the page is invalid? What if the site already has visitors and it is absolutely impossible to display system information ( an article will be useful for remote debug )? Then even more interesting functions like:
This function displays prints only for site administrators, which partially solved the problem, but the usability of such a solution leaves much to be desired.
These two products give us the opportunity to abandon the above functions and generally display variables when debugging the application and receive data directly in the IDE in a convenient and readable way:

Above in the screenshot, we can see the $ APPLICATION object in the debug window of the /index.php file . We received complete information about the object, in a grouped form, while we can observe the data type of each element in the object. And (attention!) We didn’t write any var_dump () or print_r () anywhere !
Before you begin to use such a charm, we need to perform several actions:
First of all, we need to make sure that XDebug is installed on the server . In this article I will not consider the process of installing XDebug on the server, there are many articles on the Internet about this. I’ll just show what needed to be done in MAMP in order to activate XDebug :
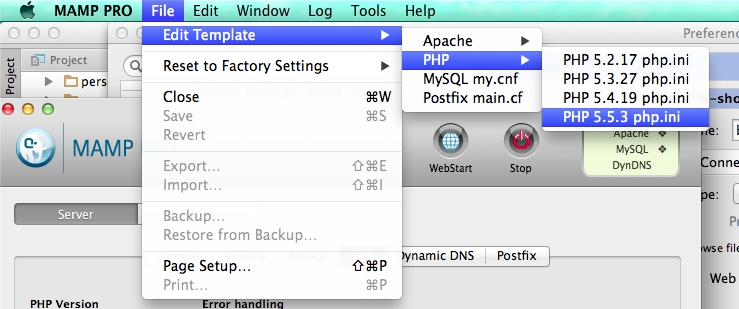
All actions were performed with the php.ini file for building PHP version 5.5.3. How to get to this file in MAMP - below in the screenshot
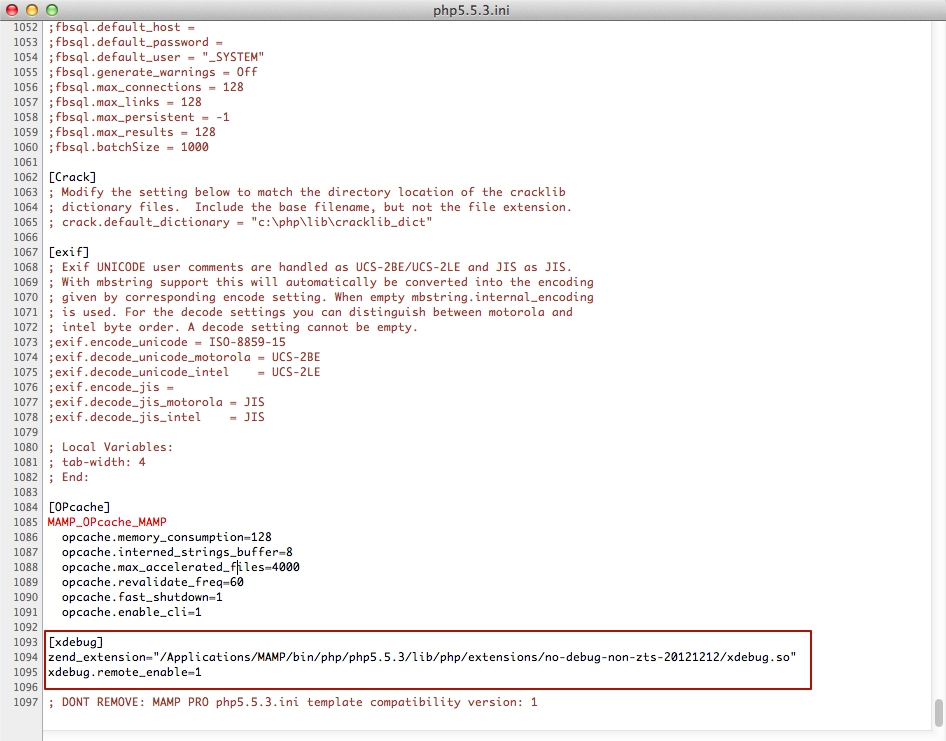
In this file you need to uncomment the line
and append the line
After that, phpinfo () will give us this information:
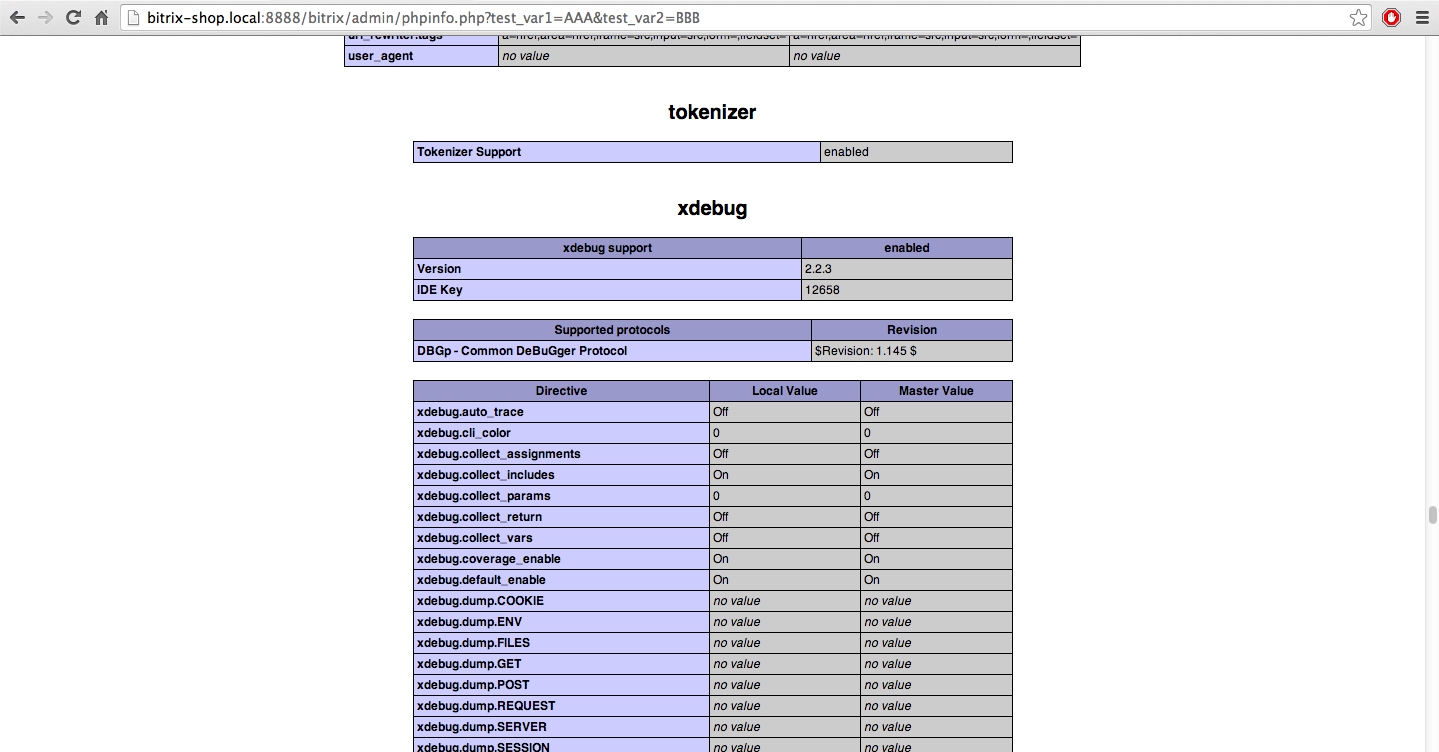
XDebug is ready to work.
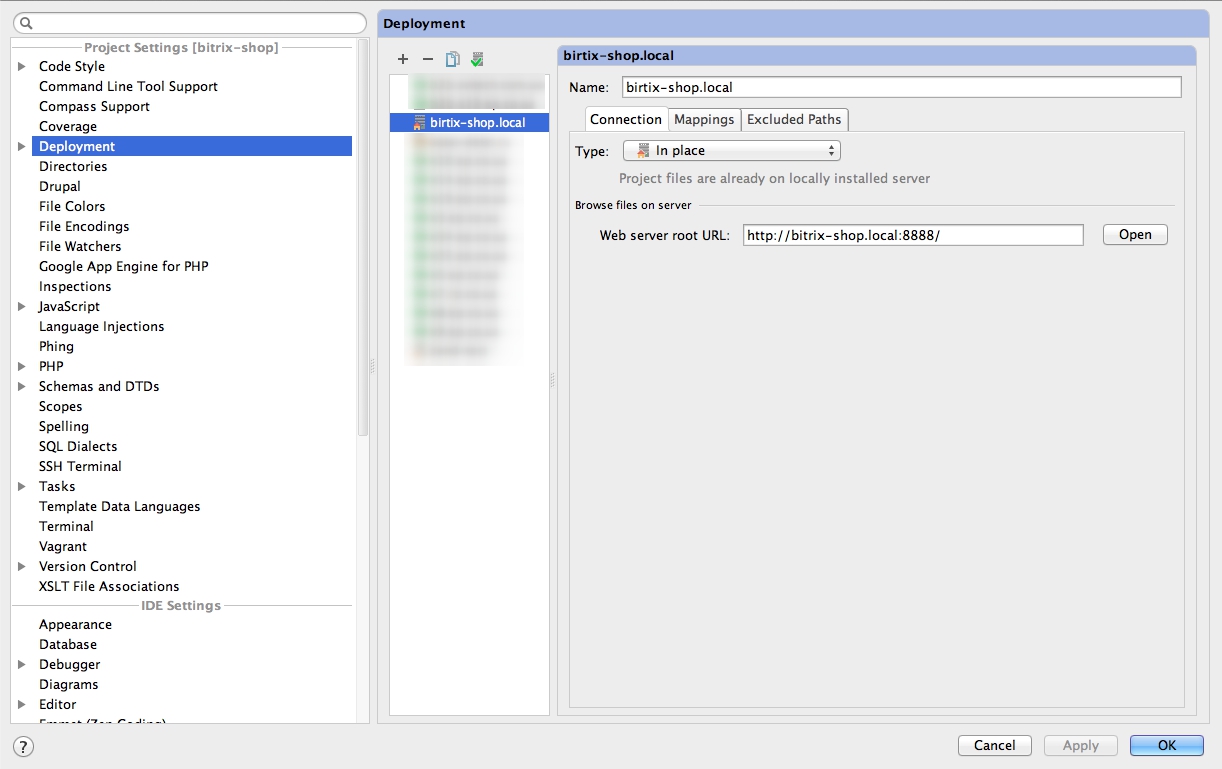
To receive data from a site in the IDE, we need to make friends with them. First you need a properly configured server that the IDE connects to during deployment. Go to the settings PhpStorm -> Deployment . Here the Webserver Root URL parameter is important , you need to specify the URL of the root of your site. An example of my settings is below:
Next, go to the XDebug setting in PhpStorm : the main menu Run -> Edit Configurations
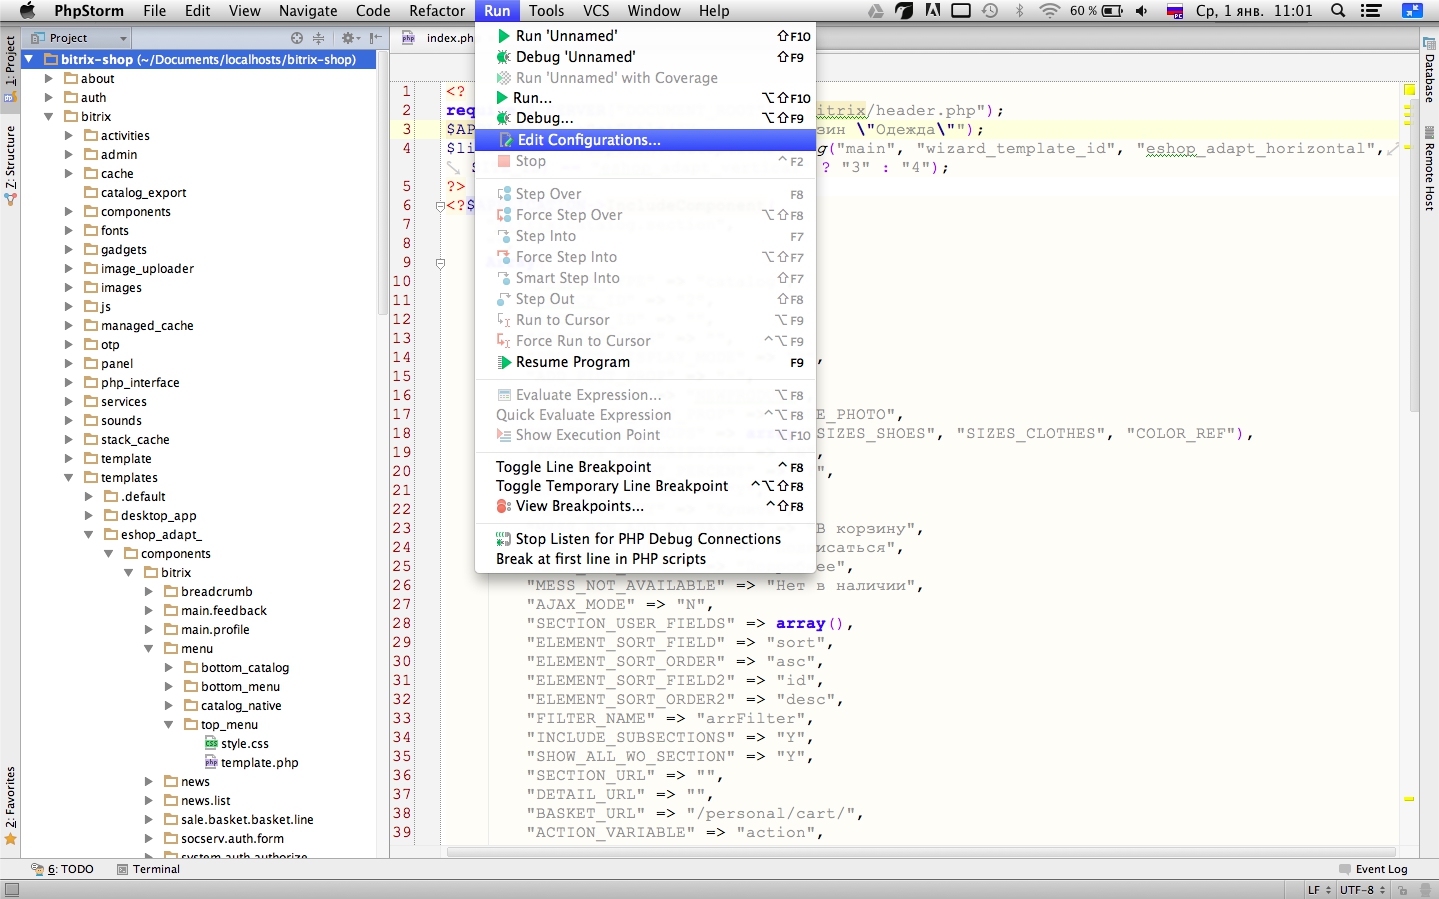
Click on plus to add a new setting for the debug.

Select the Php Web Application setting.

Here you need to configure the tool with which debugging is performed, click on the button next to the server settings:
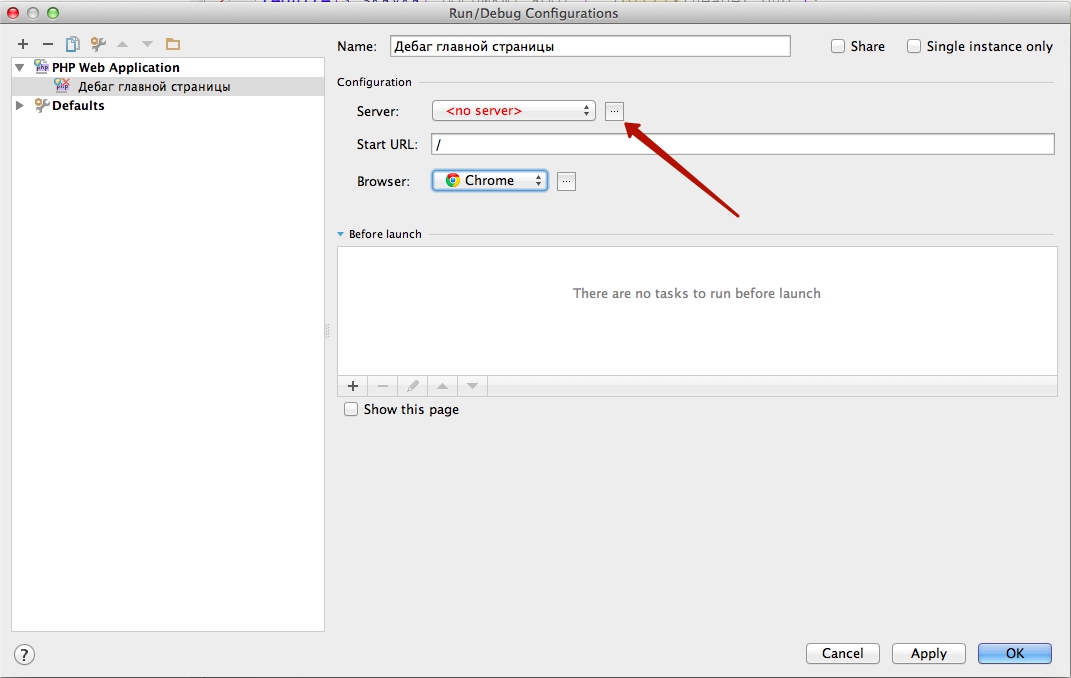
Click on the plus, fill in the name, host of the site and click on Validate remote environment .
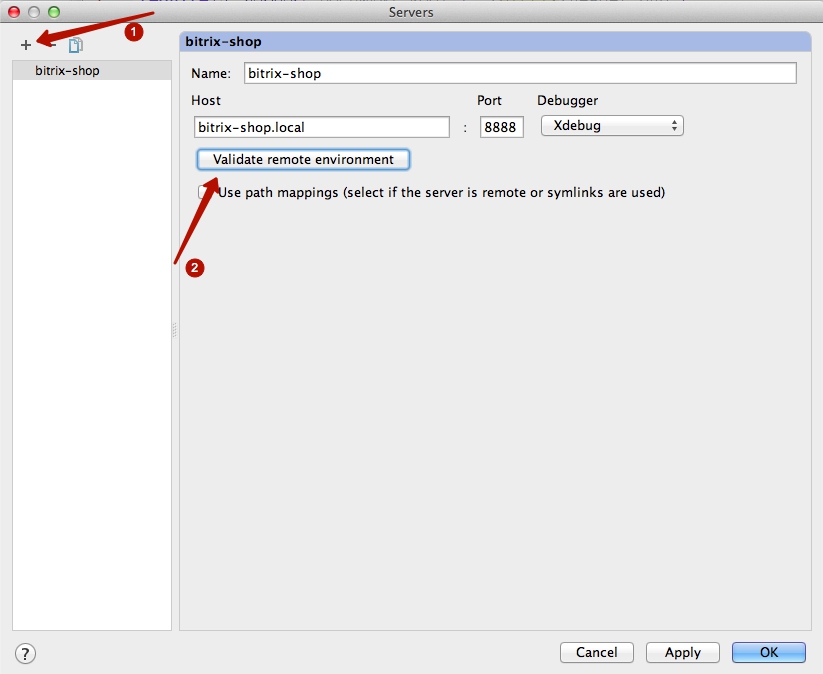
There we select the server that was configured above from the list and click Validate.
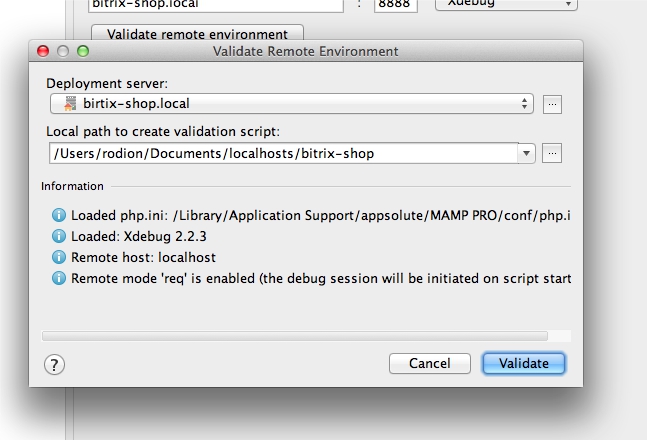
If validation is successful, then we are ready to debug. We apply all the saved settings and return to the editor.
In order to find out the values of variables in the current code, we need to tell our IDE in which exact place in the code we want to get the values we need. For this, breakpoint functionality is provided. Select the desired line of php code and click on the area to the right of the line number.

Next, you need to enable listening on the 9000 port, to which XDebug will send a response when the script is launched, and click on the green bug on the left (button locations in windows versions of PhpStorm may vary).
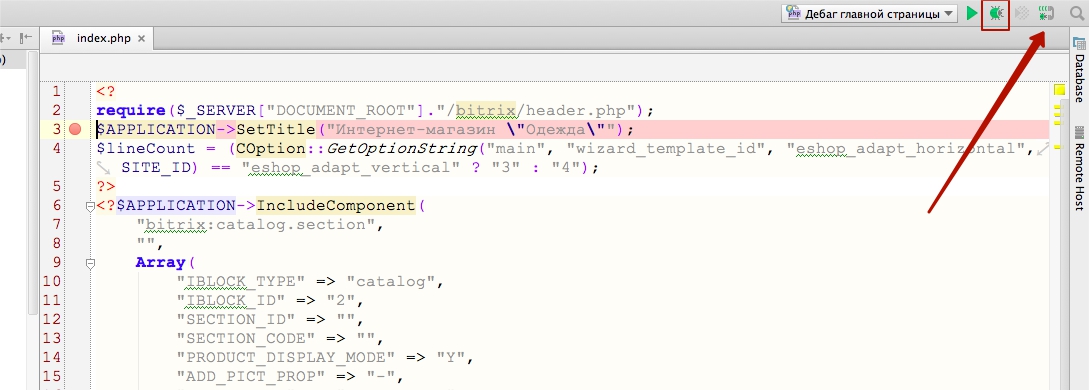
After clicking on the bug, a browser should open
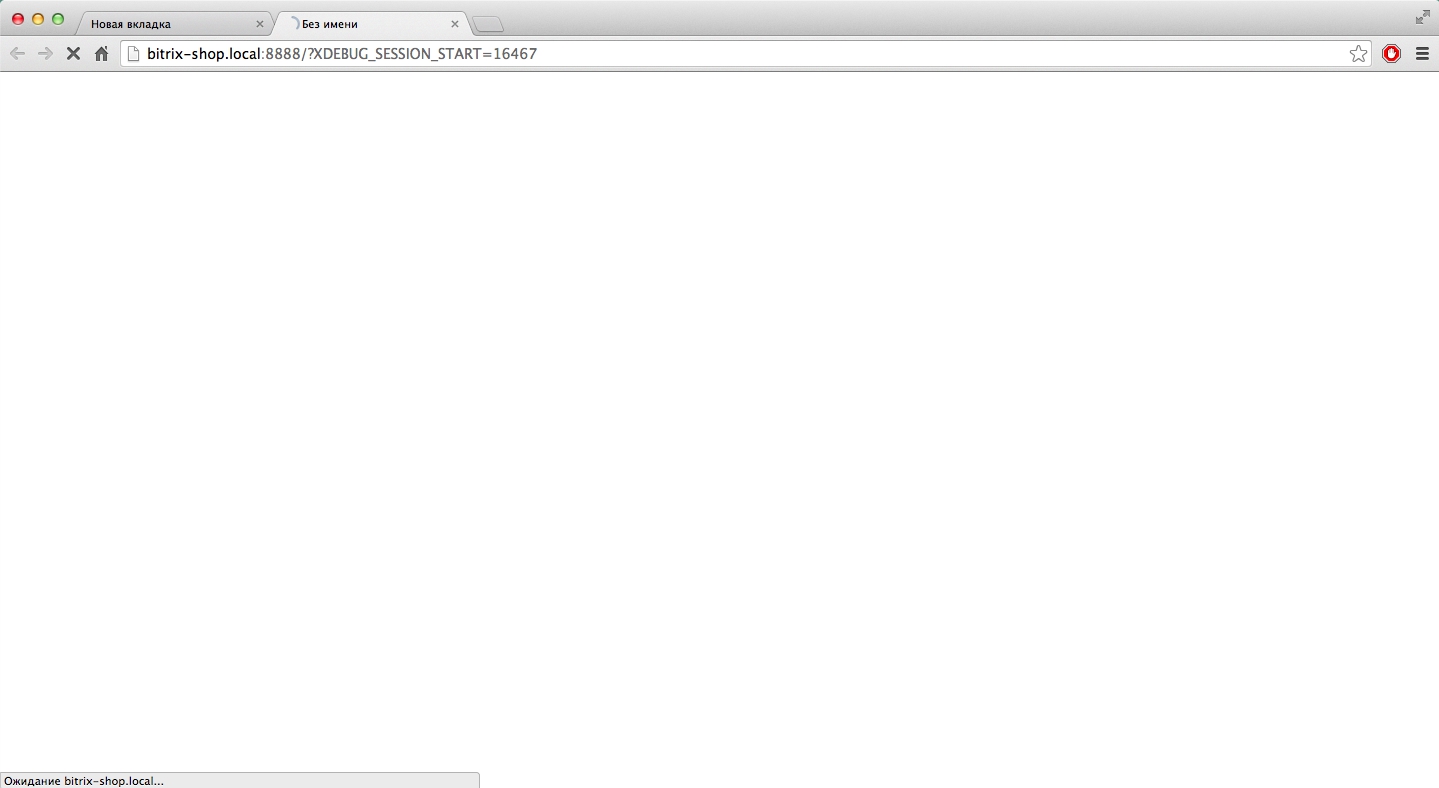
and after a few seconds PhpStorm opens again with a debug panel, where there will be values of all variables at the time the code was processed, the place of the breakpoint

This article provides examples with this set of tools:
- Web Server - MAMP PRO
- XDebug v2.2.3.
- IDE PhpStorm 7.1
- On my local server installed 1C-Bitrix version 14 with the solution of the online store.
So, let's begin.
During development, you often have to use functions like print_r () or echo to display data on the screen. Until recently, I personally used functions like:
function pre($array)
{
    echo '';
    print_r($array);
    echo "";
}
This function printed the array onto the screen and already in this form I parsed it and entered it into the editing code. But what if the huge $ arResult print on the page is invalid? What if the site already has visitors and it is absolutely impossible to display system information ( an article will be useful for remote debug )? Then even more interesting functions like:
function pre2($array)
{
    global $USER;
    if($USER->isAdmin())
    {
        echo ‘’;
        print_r($array);
        echo ‘';
    }
}
This function displays prints only for site administrators, which partially solved the problem, but the usability of such a solution leaves much to be desired.
XDebug and PhpStorm
These two products give us the opportunity to abandon the above functions and generally display variables when debugging the application and receive data directly in the IDE in a convenient and readable way:
Above in the screenshot, we can see the $ APPLICATION object in the debug window of the /index.php file . We received complete information about the object, in a grouped form, while we can observe the data type of each element in the object. And (attention!) We didn’t write any var_dump () or print_r () anywhere !
Configure PhpStorm for Debugging with XDebug
Before you begin to use such a charm, we need to perform several actions:
1. Configure XDebug on the server
First of all, we need to make sure that XDebug is installed on the server . In this article I will not consider the process of installing XDebug on the server, there are many articles on the Internet about this. I’ll just show what needed to be done in MAMP in order to activate XDebug :
All actions were performed with the php.ini file for building PHP version 5.5.3. How to get to this file in MAMP - below in the screenshot
In this file you need to uncomment the line
zend_extension=»/Applications/MAMP/bin/php/php5.5.3/lib/php/extensions/no-debug-non-zts-20121212/xdebug.so»and append the line
xdebug.remote_enable=1After that, phpinfo () will give us this information:
XDebug is ready to work.
2. Configure PhpStorm
To receive data from a site in the IDE, we need to make friends with them. First you need a properly configured server that the IDE connects to during deployment. Go to the settings PhpStorm -> Deployment . Here the Webserver Root URL parameter is important , you need to specify the URL of the root of your site. An example of my settings is below:
Next, go to the XDebug setting in PhpStorm : the main menu Run -> Edit Configurations
Click on plus to add a new setting for the debug.
Select the Php Web Application setting.
Here you need to configure the tool with which debugging is performed, click on the button next to the server settings:
Click on the plus, fill in the name, host of the site and click on Validate remote environment .
There we select the server that was configured above from the list and click Validate.
If validation is successful, then we are ready to debug. We apply all the saved settings and return to the editor.
3. Breakpoints
In order to find out the values of variables in the current code, we need to tell our IDE in which exact place in the code we want to get the values we need. For this, breakpoint functionality is provided. Select the desired line of php code and click on the area to the right of the line number.
4. Debug launch
Next, you need to enable listening on the 9000 port, to which XDebug will send a response when the script is launched, and click on the green bug on the left (button locations in windows versions of PhpStorm may vary).
After clicking on the bug, a browser should open
and after a few seconds PhpStorm opens again with a debug panel, where there will be values of all variables at the time the code was processed, the place of the breakpoint