December 2, 2013 at 13:00
Wireshark - Taming Sharks
- Tutorial

Wireshark is a well-known tool for capturing and analyzing network traffic, in fact a standard for both education and Troubleshoot.
Wireshark works with the vast majority of known protocols, has a clear and logical graphical interface based on GTK + and a powerful filter system.
Cross-platform, works in OSs such as Linux, Solaris, FreeBSD, NetBSD, OpenBSD, Mac OS X, and, of course, Windows. Distributed under the GNU GPL v2 license. Available for free at wireshark.org .
Installation on a Windows system is trivial - next, next, next.
The latest version at the time of writing is 1.10.3, and it will participate in the review.
Why do we need packet analyzers at all?
In order to conduct research on network applications and protocols, as well as to find problems in the network, and, importantly, find out the causes of these problems.
It is quite obvious that in order to maximize the use of sniffers or traffic analyzers, at least general knowledge and understanding of the operation of networks and network protocols are required.
I also remind you that in many countries the use of a sniffer without explicit permission is equivalent to a crime.
Start swimming
To start capturing, just select your network interface and click Start.
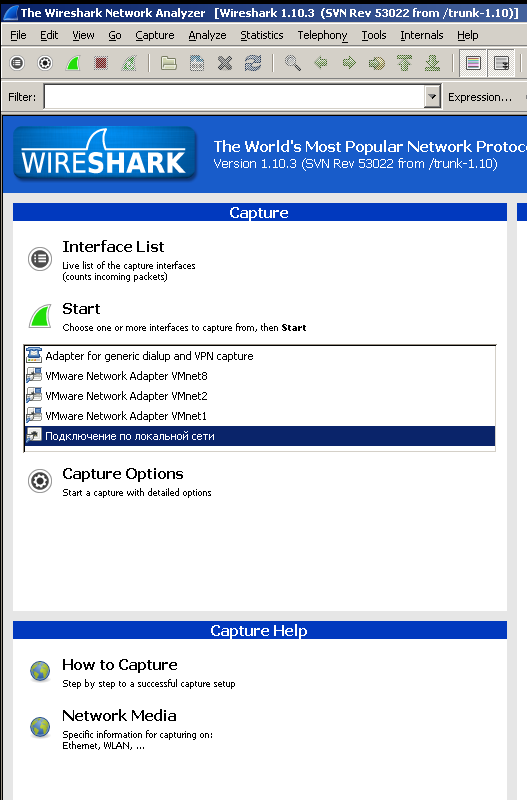
After that, the capture process will begin, and the arriving packets will appear in real time.
In the process of reviewing and studying packages, there are situations when you need to return to the previous package. There are two buttons for this (see screenshot).

And the button following them allows you to quickly jump to the package by specifying its number.
If the columns overlap and crawl onto each other, you can right-click on such a column and select “Resize Column” .
It will automatically adjust the size to the current situation.
And besides, there is a button “Resize all Columns” , which will put all the columns in order.
Using the View - Time Display Format menu , you can, for example, set up the time counting not from the beginning of capture, but from the moment of receiving the previous packet ( Since Previous Captured Packet ).
The most important thing in each program ( Help - About Wireshark ) will show not only the version and list of authors, but also contains the Folders tab , which will show the location of the directories with the configurations.
Studying the interface, you can select, for example, the http packet, and see that HTTP is encapsulated in TCP (transport layer), TCP is encapsulated in IP (network layer), and IP, in turn, is encapsulated in Ethernet (before that, it flashes 802.1Q).
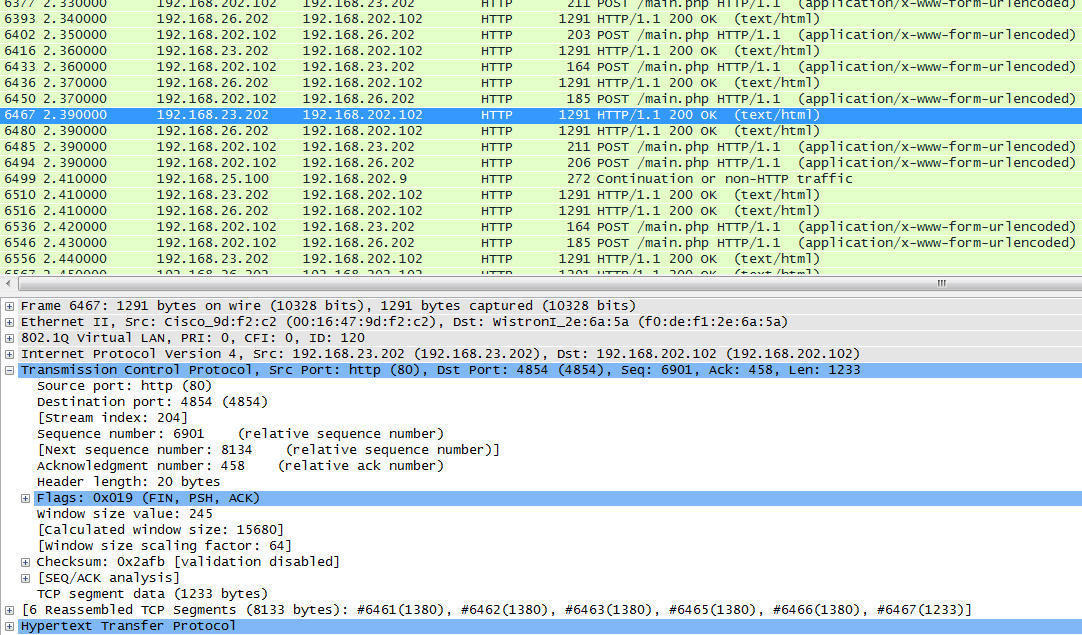
And at the very top there is something like a small overview of the collected information about the frame.

We’ll talk about filters later, but at this stage, if you need to quickly filter out unnecessary packages, just right-click on the package, select the menu Apply as Filter - Not selected and the changes will immediately take effect.
If you need to remove something else, then next time select “and not Selected” , and the new rule will simply be added to the filter.
Remove burrs
Quite often, when working with Wireshark, an IP checksum offload error occurs - an IP packet header checksum error.

Modern network cards are so smart that they themselves consider the checksum, why do this at the TCP / IP stack level programmatically, if you can do it hard.
And Wireshark naturally intercepts packets before they reach the network.
And before this amount was calculated and was added to the package header.
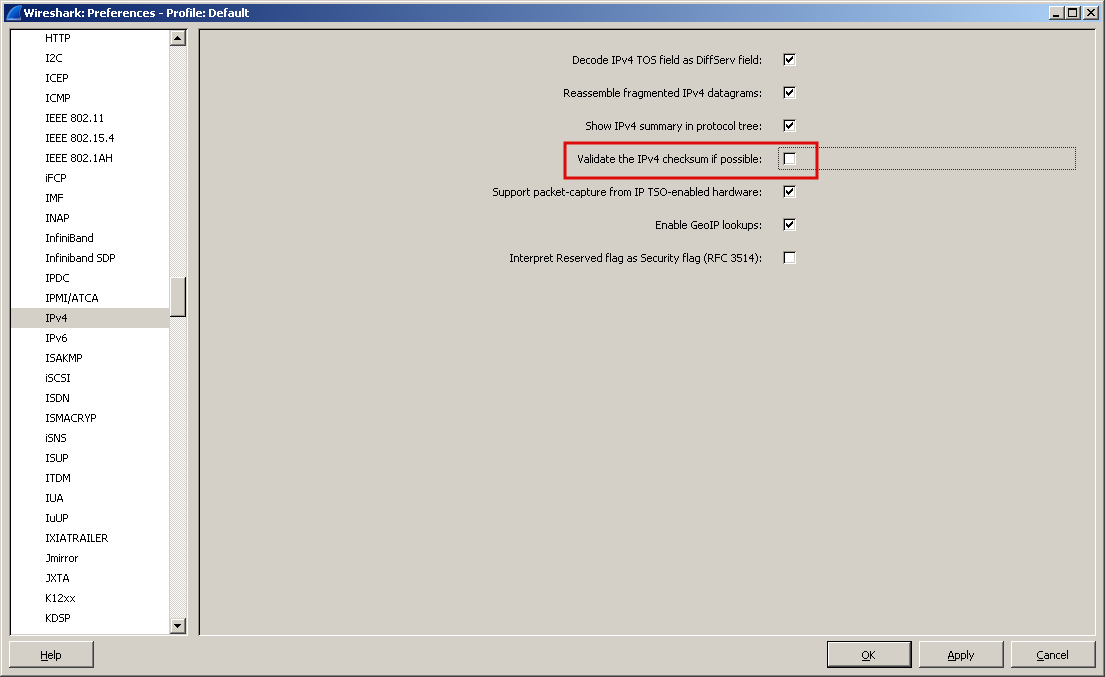
Accordingly, there are two ways to solve this problem - disable the offload function in the network card settings or specify in the sniffer settings so that it does not pay attention to this value.
Hardware functions are often better than software functions, mainly due to processing speed (usually higher in hardware), so it’s better to change the settings of the sniffer itself.
To do this, go to the settings ( Edit - Preferences ), then Protocols - IPv4 - and remove the flag from “Validate IPv4 checksum if possible” .
Before you capture traffic, you need to decide what, in fact, you need to capture.
You can place a traffic analyzer in several places:
- Locally on your host;
- Organize traffic mirroring on the switch;
- Connect directly to places of interest;
- or ARP poisoning (even more illegal than passive listening to traffic)
Filter the stream
Wireshark contains two types of filters - capture ( Capture Filters ) and display ( Display Filters ).
First, consider Capture Filters .
As you can guess by the name, they serve to filter even at the stage of traffic capture.
But in this case, of course, you can irrevocably lose some of the necessary traffic.
A filter is an expression consisting of built-in values that, if necessary, can be combined by logical functions (and, or, not).
In order to use it, you need to go to the Capture menu , then Options , and in the Capture Filter field type, for example, host 8.8.8.8(or, for example, net 192.168.0.0./24 )
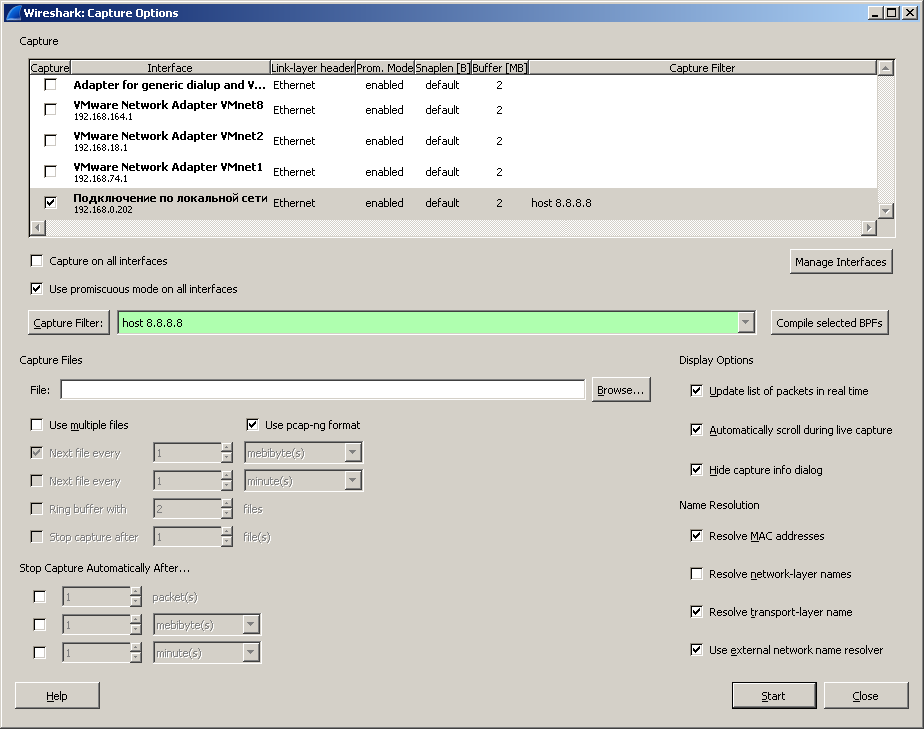
You can also, of course, select a pre-created filter (the Capture Filter button is responsible for this).
In any of the options, a filter will appear near the interface, you can press Start.
Now let's move on to Display Filters .
They filter exclusively already captured traffic.
What can be filtered?
- Almost everything - protocols, addresses, specific fields in the protocols.
Operations that can be used when building filters:
| Command | Value | Usage example |
|---|---|---|
| == | equality | ip.dst == 193.168.3.10 |
| ! = | Not equal | udp.dst! = 53 |
| < | less than | ip.ttl <24 |
| > | more than | frame.len> 10 |
| <= | less than or equal to | frame.len <= 0x20 |
| > = | more or equal | tcp.analysis.bytes_in_flight> = 1000 |
| matches | regular expressions | frame matches "[Pp] [Aa] [Ss] [Ss]" |
| contains | contains | dns.resp.name contains google |
As you probably noticed, in the table as examples there were various expressions, quite understandable and often speaking for themselves.
For example, ip.dst is an IP protocol field.
To see this field, you can just look at the package, and at the bottom of the window you can see its value, which can then be applied in any filter.
For example, we are interested in how to create a filter where the TTL value will be checked.
To do this, open the L3 part and stand on the appropriate field:
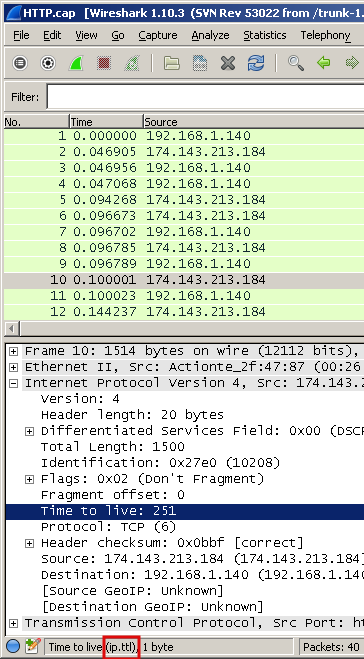
And we see that to build the filter, you need to use the ip.ttl expression.
If you start to type a filter, then after the point a list of possible values will automatically appear:
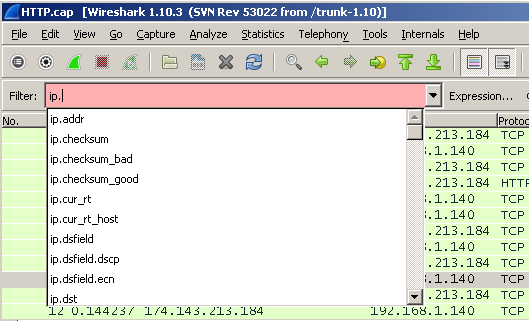
To apply the filter, just press enter or the Apply button.
The filter input field itself may change color depending on what was typed.
Green means that everything is in order. Red - an error was made, yellow - an unexpected result was obtained, because there are other options for writing a filter (for example, you can write ip.dst! = 8.8.8.8 or ! Ip.dst == 8.8.8.8 , the second option is more preferable).
Filters can be saved for future use by clicking the Save button, then enter an arbitrary name
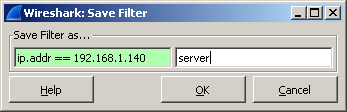
and after clicking the OK button, the filter appears as a button on the panel.
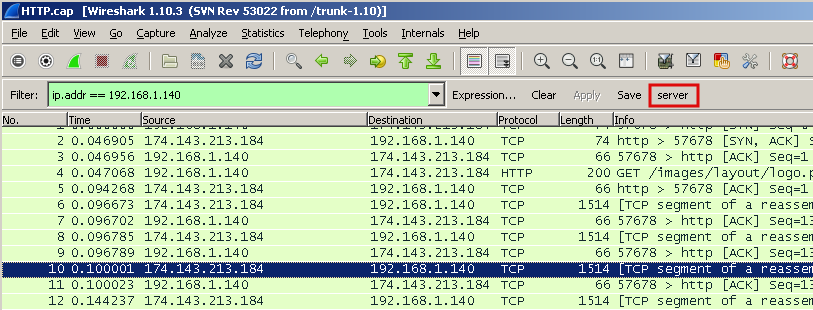
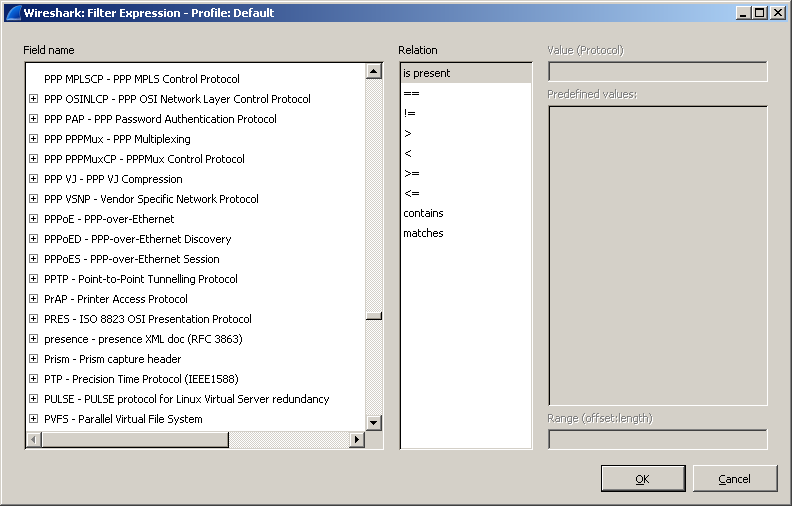
And if you click on the nearby Expression ... button, a fairly powerful expression constructor will open, by which you can almost learn the network protocols. The number of supported protocols is constantly increasing.
As mentioned earlier, you can select any package and select Apply as Filter in the context menu and select the mode - selected or not selected in the submenu, and accordingly, a filter will immediately appear that will show only the selected one or vice versa will remove the selected one from the screen.
Thus, you can flexibly choose what to see on the screen and what not.
This can be a specific ip address, ttl, port, dns response and much more.
In addition, there are two options for such quick filters - Prepare as Filter and Apply as Filter.
As the name suggests, the difference is that in the first case it will only appear in the Display Filter input field, but it will not apply (it’s convenient if, for example, you add several filters in this way and then immediately apply the finished result), and in the second - immediately apply.
Filters can be combined using logical operations familiar from Boolean algebra:
(dns) && (http)logical and (dns) || (http)this is logical. Thus, you can build large and complex filters like:
(tcp.flags.syn==1) && (ip.src == 172.16.10.2) && (ip.dst == 172.16.10.1)Here we see that only TCP SYN segments are selected, only with a specific sender and receiver address. When compiling large filters, you need to remember that the filter is essentially a logical expression, and if it is true, then the package will be displayed on the screen, if false - no.
Diving deeper
A fairly frequent situation, when there are complaints about the slow operation of the network, there can be many reasons for this.
Let's try to figure out what could be the reason, and consider two ways.
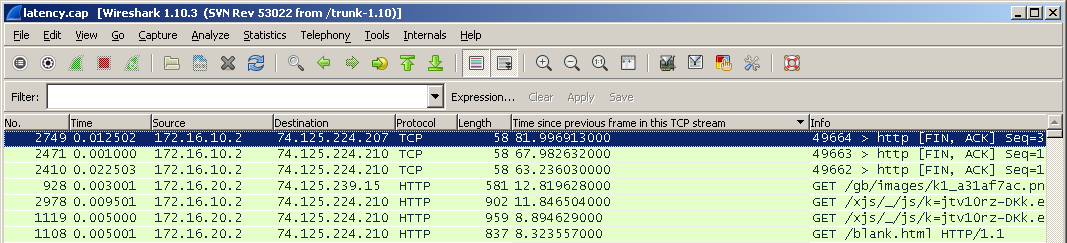
The first is to add the TCP delta column .
Open the package, find the Time since previous frame in this TCP frame field , right-click and select Apply as Column . A new column will appear.
On it you can right-click and select a sort mode, for example, Sort Descending .
And immediately consider the second method.
Relatively recently (in version 1.10.0), the tcp.time_delta filter appeared, which, in fact, takes into account the time since the last request.
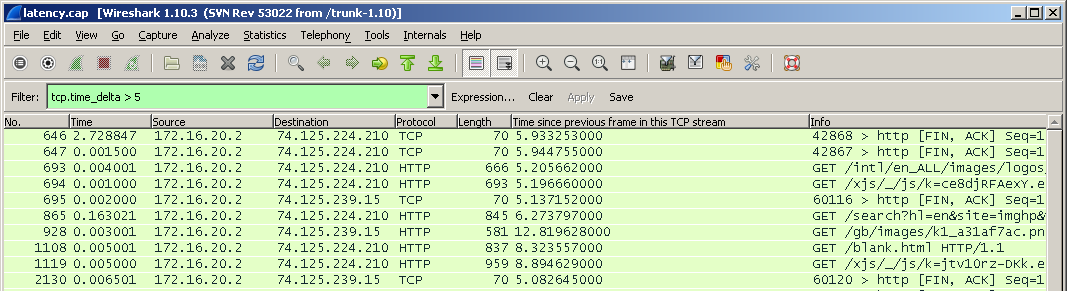
If the client makes a request and receives a response after 10 milliseconds, and the client says that everything is working slowly for him, then perhaps the problem is with the client itself.
If the client makes a request and receives a response after 2-3 seconds, then, perhaps, the problem lies in the network.
Deeper still
If you look at the TCP packet (or the segment to be precise), you can see there the Stream index , which usually starts from scratch.
The field itself will be called tcp.stream.

You can right-click on it and create a filter.
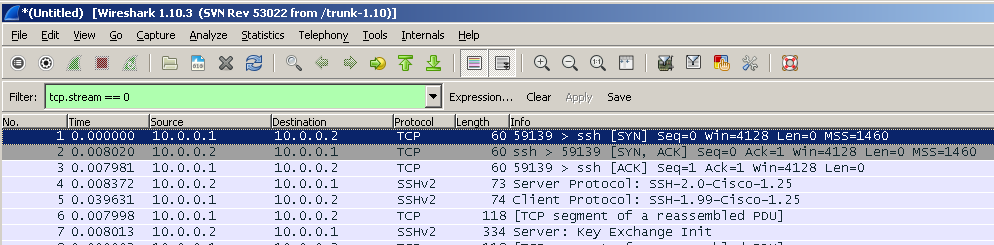
In this way, the desired compounds can be filtered.
Another way is to right-click on the package itself, select the Conversation Filter and create a filter for the l2 l3 l4 level, respectively.
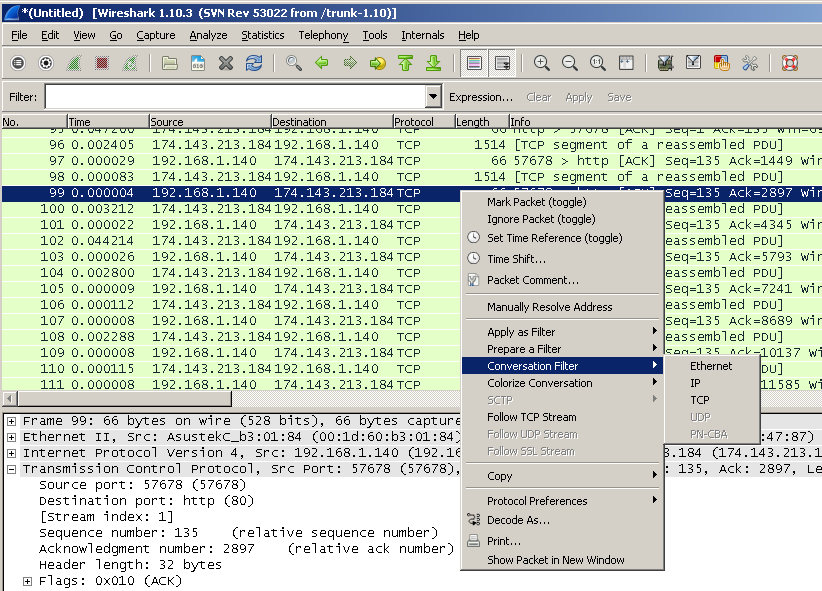
As a result, we will again see the interaction of the two hosts.
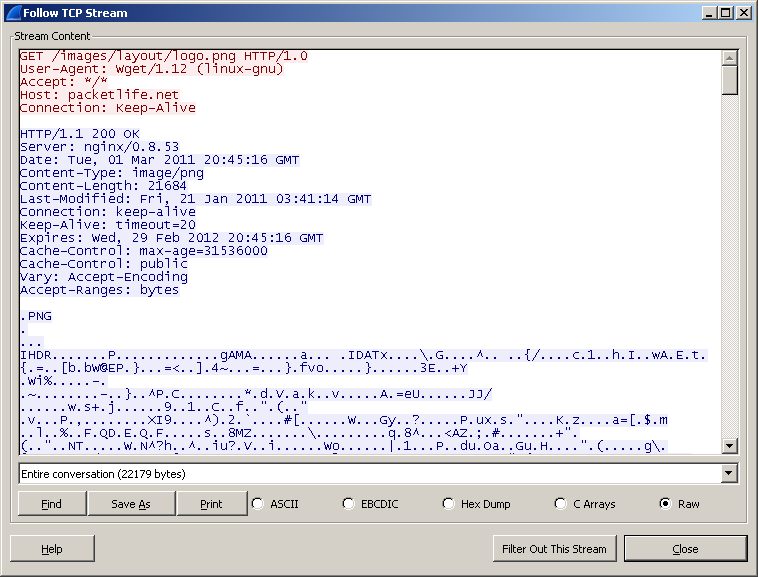
And the third option is one of the most interesting features - Follow TCP Stream .
In order to use it, again, right-click on the packet and select “Follow TCP Stream”. A window will appear where the entire exchange between the two nodes will be clearly demonstrated.
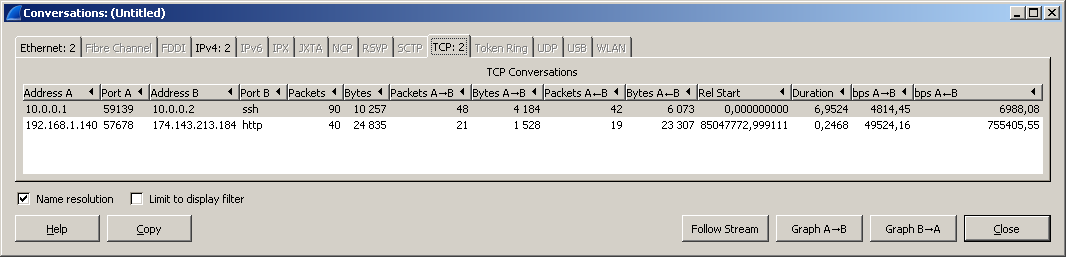
If you go to the Statistics - Conversations menu , then selecting bookmarks, you can see statistics on such “conversations” and various sessions, while you can sort them by various columns, for example, by the number of transmitted data.
And right in this window, you can right-click the context menu and again apply it as a filter.
Over time, experience comes
After some time spent capturing a variety of traffic, you can notice some spherical button in the lower left corner, which sometimes sometimes changes color.
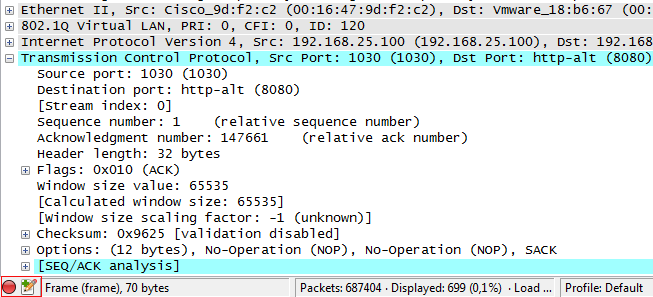
Clicking on this button will open the Expert Infos window .
The same result can be achieved by going to the Analyze - Expert Info menu .

This window will contain information on the packages found, divided into groups Errors, Warnings, Notes and Chats.
The color scheme for these groups is as follows:
Errors - red color
Warnings - yellow
Notes - blue-green (cyan)
Chat - gray
Wireshark contains a powerful analyzer and is able to automatically detect a large number of problems that arise on the network.
As you may have noticed, literally everywhere you can use filters and Expert Info is no exception.
In order to create such a filter, you need to use the expert.severity construct .
For example, expert.severity == error .
Rob traffic!
Can I use Wireshark to find out what has been downloaded?
Yes you can. And now we will see it.
First, let's take HTTP traffic.
Let's right-click on the HTTP package - Protocol Preferences - and we see here a lot of options that directly affect the extraction of files from web traffic.
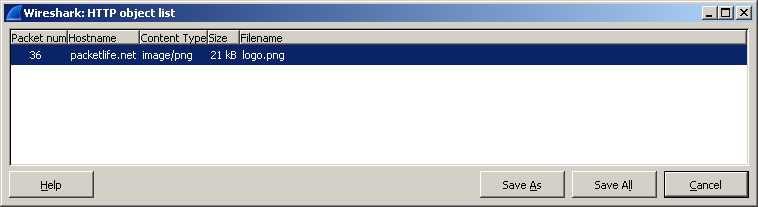
In order to see what can be extracted from the current dump, go to the File - Export Objects - HTTP menu .
A window will appear that shows all the http objects captured - text files, pictures, etc. In order to pull any file from this list, just select it and click Save As.
As you can see, the drawing was removed without any problems.
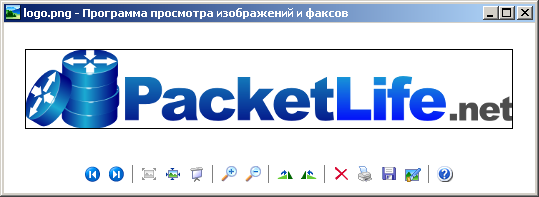
In the same way, you can extract streaming video / audio.
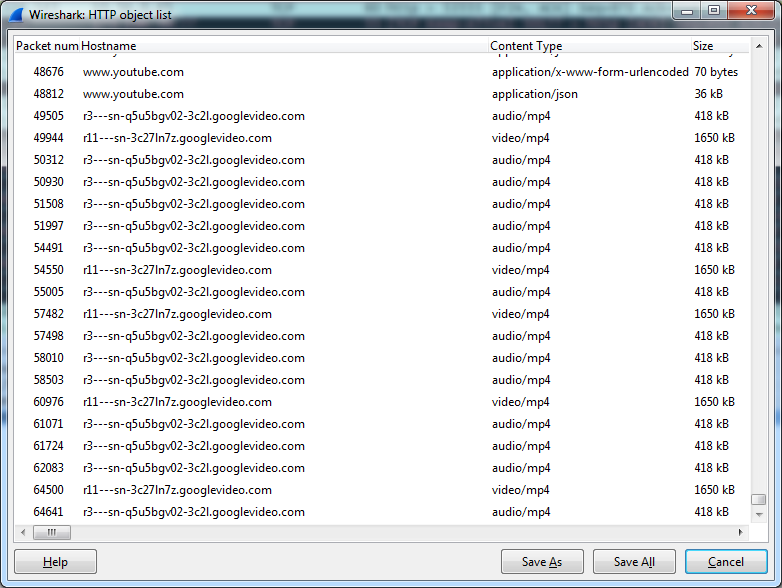
But Wireshark's possibilities do not end there!
He knows how to pull files from the FTP protocol.
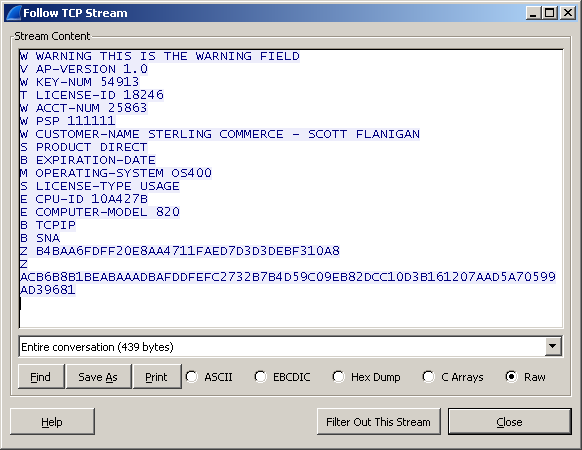
To do this, you can use the familiar Follow TCP Stream.
As a result, only the exchange via FTP will be displayed, in which you will need to find the RETR line, which in fact will mean file transfer.

Then we go down further, we find the packages directly with the file (FTP-DATA) and again select Follow TCP Stream, see the contents of the file, click Save As and save.
VoIP
Wireshark has several built-in features to work with this technology.
It supports a lot of voice protocols - SIP, SDP, RTSP, H.323, RTCP, SRTP and others.
And, of course, it can intercept and save voice traffic for further listening.
This functionality is the best suited for Troubleshoot in Voice over IP networks.
The Statistics - Flow Graph menu will show a visual picture of how the entire packet exchange took place.

In general, the whole Telephony menu is reserved for working with voice traffic.
For example, Telephony - RTP - Show All Streamswill show in detail what happened with RTP, in particular jitter (a parameter that is probably the most important in the voice), which sometimes immediately indicates the presence of problems.
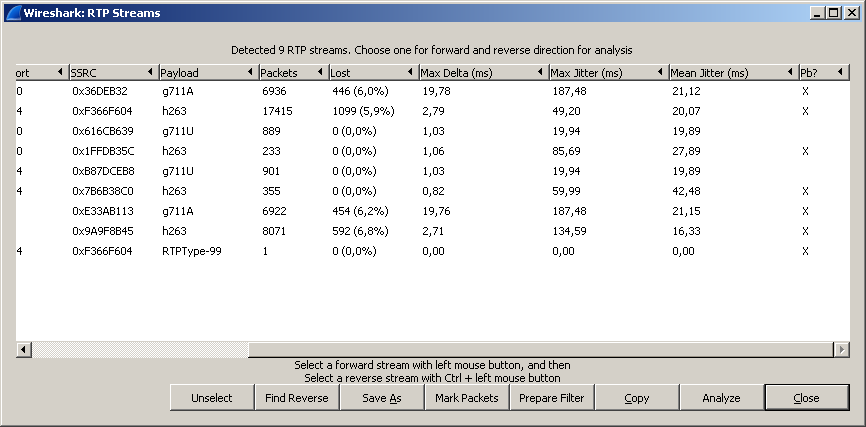
By clicking on the “Analyze” button, you can open the RTP stream Analysis window - and by selecting a stream there, you can even play it using the player button.
First, the player window opens, in which you first need to set the appropriate jitter value and use the decode button.

Something similar to a spectrum analyzer will appear in which you can mark the desired conversation, and after that the Play button will become active.
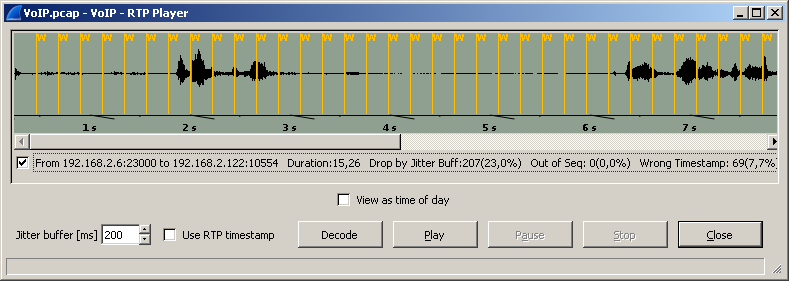
There is also another way to listen to voice calls - you can go to the Telephony menu - VoIP Calls .
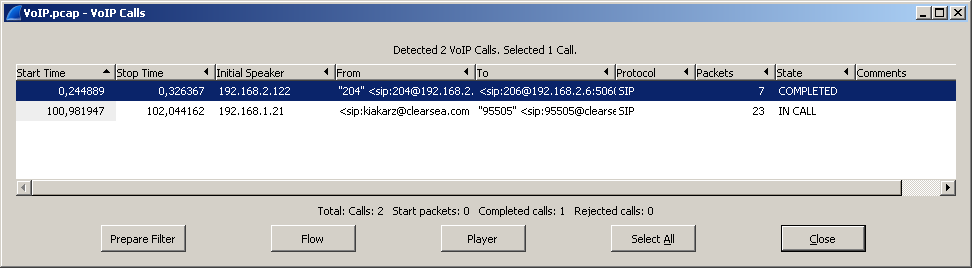
A window opens with a list of calls made, where again you can press the player button, cancel the necessary conversations with flags and press play.
In order to achieve an acceptable sound quality, you will need to play with the value of the jitter buffer field, changing its value.
Small digression
Some time ago, CloudShark.org appeared .

This is the same Wireshark sniffer, but implemented as an online service. It is obvious that with its help it will not be possible to capture network traffic, but it is quite possible to perform a traffic dump analysis. By uploading a PCAP file for analysis through a form, you can get a clear sequence of packets in which all the data will be divided into understandable fields, depending on the protocol. In general, the same Wireshark, but a bit lightweight and accessible from any browser.
Final battle
Lastly, consider what port scanning looks like.
We look at the dump and we see that at the beginning there is an ARP request and then the scanning starts directly. The address of our router is 192.168.10.11, the scan goes from the address 192.168.10.101

This is the so-called SYN scan, when SYN packets go to the specified port range. Since most ports are closed, the router responds with RST, ACK packets.
Scrolling a little lower we see that telnet is open (tcp 23).

This is indicated by the fact that the router responded with a SYN, ACK packet.
By the way, to filter ports in the sniffer, you can use constructions of the form: tcp.srcport, tcp.dstport and tcp.port. For UDP, everything is the same - udp.srcport, udp.dstport, udp.port.
Summary
We went over the most basic parts of the functionality of the best packet analyzer.
It turned out somewhat messy, probably because I wanted to touch on as many of its features as possible and not miss out on anything important.
It turned out that the packet analyzer, as a debugger and disassembler, shows the smallest details of the network and network protocols.
Using Wireshark and possessing the necessary knowledge (which can be gleaned by studying the series of Networks for the Smallest on the site linkmeup.ru), you can quite effectively find and diagnose various problems that arise on the network.
The writing process used materials from wiki.wireshark.org.
Dumps with traffic were taken from different sources, most of all from packetlife.net