How Microsoft forgot about half the world or read error messages
No, this article is not about how huge and angry monster is Microsoft. And how it offends users again. And about how to fix the annoying flaw that appeared with the latest August update of Power BI Desktop with Python support included , namely, problems with visualization in localized versions of PBI, in particular matplotlib .
In the first decade of August, Microsoft released the long-awaited and anticipated release of its truly remarkable BI product with Python language support . At the time of this writing, this functionality is in the advanced features section (i.e. just a beta version).
I have been using Power BI for a long time and with pleasure in my work (both as a data analyst and a BI developer). I always try to try new features that are generously announced in the preliminary version section. And, we must pay tribute to the Microsoft development team, it is almost always solid, usable versions of features, options and visualizations.
Particularly expected by the BI community is the inclusion of Python support in Power BI. Not that the integrated functionality of Power BI was not enough for the implementation of the most intricate tasks solved by BI systems. About 250 DAX embedded query language featuresand even more than seven hundred Power Query functions made it possible to solve virtually any BI task, from obtaining data from various sources, building a data model, and supporting visualizations and reports. Last year, support for the R language was added, which dramatically expanded the capabilities of Power BI in terms of performing scientific calculations, new visualizations, and even machine learning.
However, it is no secret that today Python is the leader among the programming languages among Data Science. And the inclusion of this language in the BI-ecosystem Microsoft turns Power BI into a kind of Swiss knife for the preparation, analysis and final presentation of data. With full support for four specialized languages (DAX, Power Query / M, R, Python) and limited, within the required functionality of SQL and MDX. Some geeks fasten more JavaScript, but this is a separate conversation.
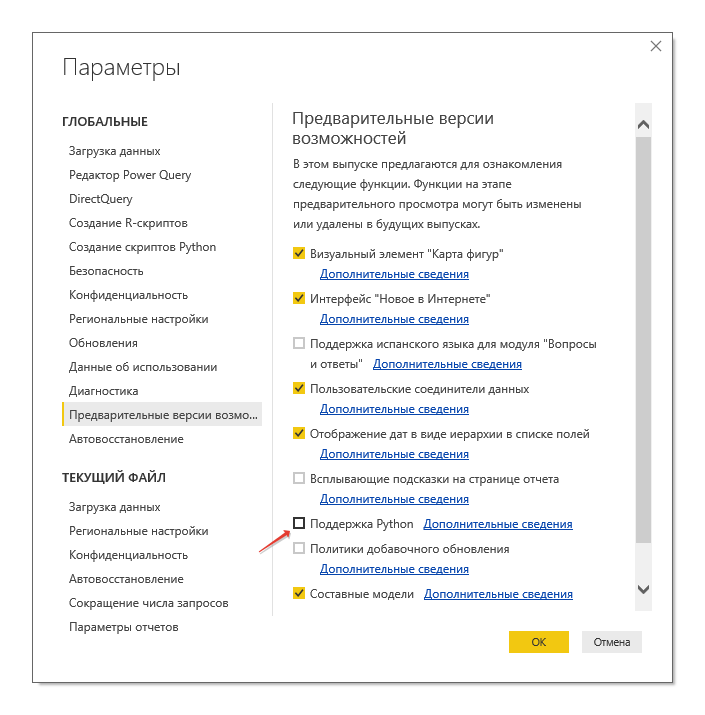
Not being a practicing Python developer, I still eagerly turned on experimental Python support to test new, opening horizons. I ticked the menu of the latest release of PBI and rebooted the application. You can read more about the connection and setup in the Microsoft blog..
I already had a previous version of Python installed and I decided to take a chance and not bother with installing a new one. As a result, a new connector appeared in the data sources - the Pyton Script, and a new [ Py ] icon appeared on the visualization panel .
However, at this stage, the Python code was not executed. I will not describe all peripetias connected with attempt to start in an environment familiar to me and Power BI unfamiliar (almost) Python.
Anyway, even a clean installation of the Anaconda assembly with a huge number of pre-installed libraries, an advanced package manager, etc., didn’t move me to the cherished "pictures" almost one iota. Different versions of Python gave different error messages to my test code, and I was a little discouraged. Google search on these posts also did not give adequate results. A Danish user’s request recently appeared on the portal in the Power BI community ( https://community.powerbi.com ) prompted a long-standing thought - it’s not my configuration of the computer with the explosive mixture of installed software (and I checked it on various machines, but on them everywhere - an explosive mixture, only different). The point is localization.
When it became clear which way to look, more sane answers of search engines began to appear on the refined requests. But the meaning was the same everywhere: “In the current version of Power BI, you cannot use the format of numbers with a decimal point, but only with a decimal point, in conjunction with Python. Wait for the updated version or change the format of the numbers. "
In Power BI, you can change the format of a number in a couple of seconds through the menu, but what to do with tons of ready-made reports and source data? The game was not worth the time here.
At this moment, all suffering "python under power bi" divided into two camps: the Americans and the British with a decimal point and all the rest. A part of the ones “left overboard the current version” quickly went over to the first group, setting the period as the standard separator. The rest of the duel began to wait for the corrected release. But since this is a beta version and translation into grocery functionality may take two months and six months, it was definitely not worth waiting for changes from day to day.
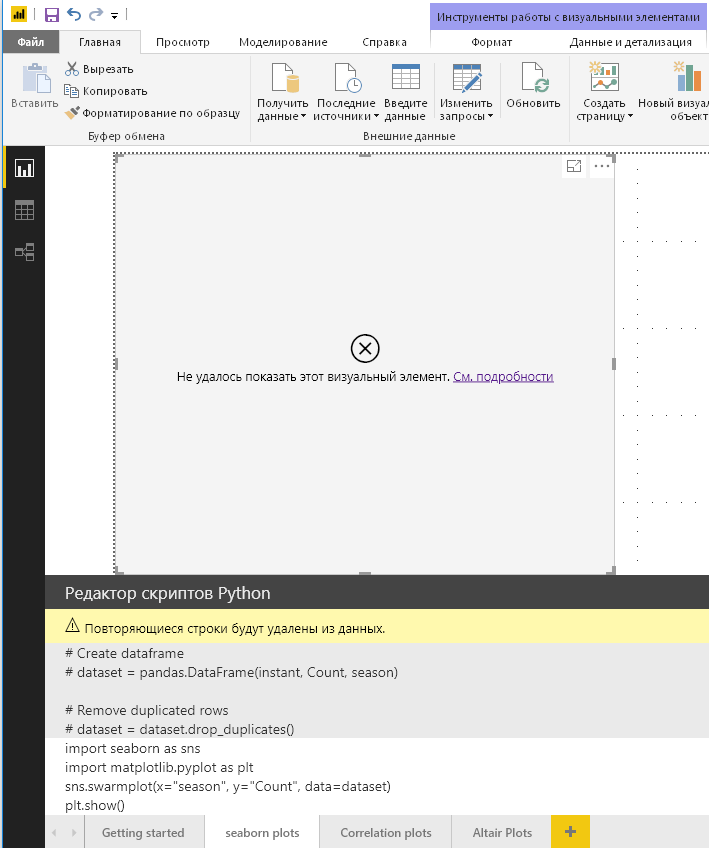
And at that moment I decided to read the error message more closely:

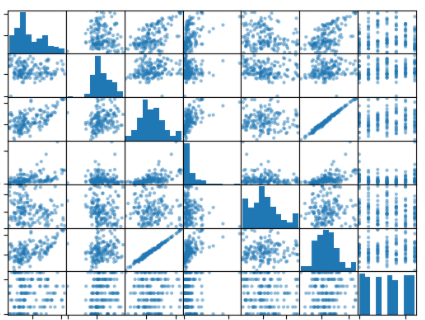
More closely, because the error was not related to my code, which in Jypyter was executed just without errors and displayed all visual elements without any problems. The problem was caused by additional code that Microsoft implemented to integrate Python with Power BI. Namely, calling the matplotlib library ( https://ru.wikipedia.org/wiki/Matplotlib ) and specifically the pyplot function (the pyplot.py file).
But then open source software to run their playful little hands into it. Without thinking twice, opening a hundred and thirty kilobyte function code using the address given in the error text found that a failure occurs during the initialization of figManager.
In the source code of the library, this Python code looks like this:
figManager = new_figure_manager(num, figsize=figsize,
dpi=dpi,
facecolor=facecolor,
edgecolor=edgecolor,
frameon=frameon,
FigureClass=FigureClass,
**kwargs)
Observing respect for such an important library, I simply commented out the code for calling the figsize problem parameter , in which Microsoft sends four arguments from Poiwer BI instead of two to localized versions, and passed this value to the default size of the visualization.
Now this code looks like this:
figManager = new_figure_manager(num,
figsize=rcParams['figure.figsize'],
#figsize=figsize,
dpi=dpi,
facecolor=facecolor,
edgecolor=edgecolor,
frameon=frameon,
FigureClass=FigureClass,
**kwargs)
In the current build, Anaconda is 542-549 lines. If you have a different version of the library, simply search for the “figManager” entry and make the necessary changes and save the revised library with the same name (you will need administrator rights to do this).
After that, just restart the rendering code for execution and enjoy the result ... Well, or wait until the mountain comes to Mahomet, or rather Microsoft to Python.

Yuri Kolmakov ( McCow )
Only registered users can participate in the survey. Sign in , please.