24-core CPU, and I can not type an email (part 2)
- Transfer
In the last article, I promised to reveal in more detail some of the details that I dropped during the investigation [Gmail hangs in Chrome under Windows - approx. lane], including page tables, locks, WMI, and vmmap error. Now I fill these gaps together with updated code examples. But first, briefly outline the essence.
The point was that a process with Control Flow Guard support (CFG) allocates executable memory while simultaneously allocating CFG memory, which Windows never releases. Therefore, if you continue to allocate and free executable memory at different addresses , the process accumulates an arbitrary amount of CFG memory. The Chrome browser does this, which leads to almost unlimited memory leaks and hangs on some machines.
It should be noted that hang-ups are difficult to avoid if VirtualAlloc starts working more than a million times slower than usual.
In addition to CFG, there is another wasted memory, although it is not as much as vmmap claims.
Both the program memory and CFG memory are ultimately allocated with 4-kilobyte pages (more on this later). Since 4 KB of CFG memory can describe 256 KB of program memory (more on this later), this means that if you allocate a 256 KB memory block aligned to 256 KB, you will receive one CFG page of 4 KB. And if you select a block of executable memory of 4 KB, then you still get the CFG page at 4 KB, but most of it will not be used.
 Everything is more complicated if the executable memory is freed. If you use the VirtualFree function on a block of executable memory that is not a multiple of 256 KB or not aligned on 256 KB, the OS should perform some analysis and check that any other executable memory does not use a CFG page. The authors of CFG decided not to bother - and just forever leave the allocated CFG memory. Very regrettable. This means that when my test program allocates and then releases 1 gigabyte of aligned executable memory, it leaves 16 MB of CFG memory.
In practice, it turns out that when the Chrome JavaScript engine allocates and then frees 128 MB of aligned executable memory (not all of it was used, but the entire range is selected and immediately released), up to 2 MB of CFG memory will remain selected, although it is trivial to free it entirely . Since Chrome repeatedly allocates and frees memory at random addresses, this leads to the problem described above.
In any modern OS, each process gets its own virtual memory address space so that the OS isolates processes and protects memory. This is done using a memory management unit (MMU) and page tables . Memory is divided into pages of 4 KB. This is the minimum amount of memory that the OS gives you. An eight-byte record in the page table points to each page, and the records themselves are stored in 4 KB pages. Each of them points to a maximum of 512 different pages of memory, so we need a hierarchy of page tables. For a 48-bit address space in a 64-bit operating system, the system is:
The MMU indexes the table of the 1st level in the first 9 (out of 48) bits of the address, the table of the 2nd level in the next 9 bits, and the rest of the levels are given out at 9 bits, that is, only 36 bits. The remaining 12 bits are used to index 4-kilobyte pages from a level 4 table. Well well.
If you immediately fill all levels of the tables, you will need more than 512 GB of RAM, so they are filled as needed. This means that when allocating a page of memory, the OS allocates some page tables — from zero to three, depending on whether the allocated addresses are in a previously unused 2 MB area, a previously unused 1 GB area or a previously unused 512 GB area (page table of level 1). always stands out).
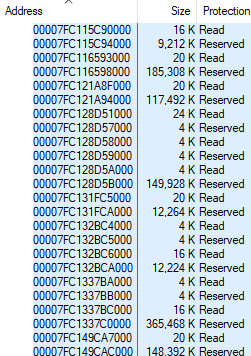
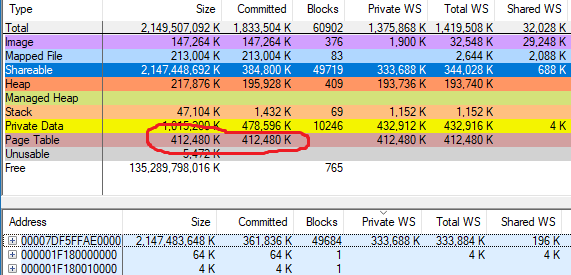
In short, allocations to random addresses are much more expensive than allocations to nearby addresses, since in the first case, page tables cannot be shared. CFG leaks are quite rare, so when vmmap showed 412 480 KB of used page tables in Chrome, I assumed the numbers were correct. Here is a screenshot of the vmmap with the chrome.exe memory layout from the previous article, but with the Page Table string:
But something seemed wrong. I decided to add a page table simulator to my VirtualScan tool . It calculates how many pages of page tables are needed for all allocated memory during the scanning process. You just need to scan the allocated memory, adding one to each counter, a multiple of 2 MB, 1 GB or 512 GB.
It was quickly discovered that the results of the simulator correspond to vmmap on normal processes, but not on processes with a large amount of CFG memory. The difference roughly corresponds to the allocated CFG memory. For the above process, where vmmap says 402.8 MB (412 480 KB) of page tables, my tool shows 67.7 MB.
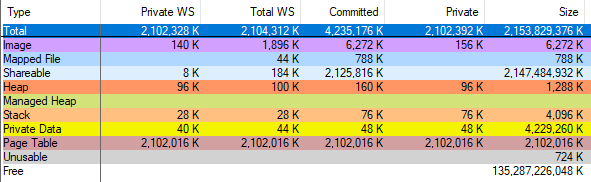
I was convinced of the vmmap error by running VAllocStress , which in the default settings causes Windows to allocate 2 gigabytes of CFG memory. vmmap claimed that he allocated 2 gigabytes of page tables:
And when I completed the process through Task Manager, vmmap showed that the amount of allocated memory decreased by only 2 gigabytes. So, vmmap is wrong, my calculations with the page tables are correct, and after a fruitful discussion on Twitter, I sent a vmmap error report, which should be fixed. The CFG memory still consumes a lot of page table entries (59.2 MB in the above example), but not as much as vmmap says, and after the fix, it will not consume almost anything.
I want to step back a bit and tell you more about what CFG is.
CFG is short for Control Flow Guard. This is a method to protect against exploits by rewriting function pointers. When CFG is enabled, the compiler and the OS together verify the validity of the branch target. First, the corresponding control byte CFG is loaded from the reserved CFG area of 2 TB. The 64-bit process in Windows manages the address space of 128 TB, so dividing the address into 64 allows you to find the corresponding CFG byte for this object.
Now we have one byte, which should describe which addresses in the 64-byte range are valid targets for branches. For this, CFG processes bytes as four two-bit values, each of which corresponds to a 16-byte range. This two-bit number (whose value is from zero to three) is interpreted as follows :
If the goal of the indirect branch is invalid, the process ends and the exploit is prevented. Hooray!
From this we can conclude that for maximum security, the indirect goals of the branch should be aligned by 16 bytes, and it can be understood why the CFG memory size for the process is approximately 1/64 of the program memory size.
Gmail hangs up for two reasons. First, scanning CFGs on Windows 10 16299 or earlier is painfully slow. I saw how the scanning of the address space of a process takes 40 seconds or more, and literally 99.99% of this time, the reserved CFG memory is scanned, although it is only about 75% of the fixed memory blocks. I do not know why the scan was so slow, but in Windows 10 17134 this was fixed, so there is no point in exploring the problem in more detail.
Because of slow crawl, there was a hangup because Gmail wanted to get a CFG backup, and WMI held the lock for the duration of the scan. But the memory reservation lock was not held throughout the scan. In my example in the field of CFG, approximately 49,000 blocks, and the NtQueryVirtualMemory function , which acquires and releases a lock, was called once for each of them. Therefore, the lock was obtained and released ~ 49,000 times, and each time it was held for less than 1 millisecond.
But although the lock was cleared 49,000 times, for some reason, the Chrome process could not get it. This is unfair!
That is the essence of the problem. As I wrote last time:
Fair locking means that two concurrent streams will receive it in turn. But this means a lot of expensive context switches, so for a long time the lock will not be used.
Unfair locks are cheaper, and they do not keep threads waiting in a queue. They just grab a lock, as mentioned in Joe Duffy's article . He also writes:
How do you relate Joe's 2006 statement about hunger rarity with my experience on a 100% repeatable and long-lasting problem? I think the main reason is what happened in 2006. Intel released the Core Duo , and multi-core computers became ubiquitous.
After all, it turns out that this problem of hunger occurs only on a multi-core system! In such a system, the WMI thread will release the lock, give a signal to the Chrome thread about waking up and continue to work. Since the WMI thread is already running, it has a “handicap” before the Chrome flow, so it easily re-calls NtQueryVirtualMemory and re-acquires the lock before Chrome has a chance to do so.
It is obvious that in a single-core system only one thread can work at a time. As a rule, Windows increases the priority of a new thread, and an increase in priority means that when a lock is released, a new Chrome thread will be ready and will immediately overtake the WMI stream. This gives Chrome a lot of time to wake up and get a lock, and hunger never comes.
Do you understand? In a multi-core system, the priority increase in most cases does not affect the WMI thread, since it will run on a different core!
This means that a system with additional cores may respond more slowly.than a system with the same workload and fewer cores. Another conclusion is also curious: if my computer had a large load — streams of the corresponding priority running on all processor cores — then the hang could be avoided (do not try this at home).
Thus unfair locksincrease productivity, but can lead to hunger. I suspect that the solution may be what I call “sometimes fair” locks. Say, 99% of the time they will be unfair, but in 1% give the lock to another process. This will preserve the performance benefits with more, avoiding the problem of hunger. Previously, locks in Windows were distributed fairly and probably you can partially return to this by finding the perfect balance. Disclaimer: I’m not a lock expert or OS engineer, but I’m interested to hear this, and at least I’m not the first to suggest something like that .
Linus Torvalds recently appreciated the importance of fair blocking: here and here . Maybe it's time for changes in Windows.
To summarize : Locking for a few seconds is not good, it limits parallelism. But on multi-core systems with unfair locks, the removal and then the immediate re-acquisition of the lock behaves exactly this way - other threads have no opportunity to work.
 For all these studies, I relied on ETW tracing, so I was a little scared when it turned out at the beginning of the investigation that the Windows Performance Analyzer (WPA) could not load the Chrome characters. I am sure, literally last week everything worked. What happened ...
It happened that Chrome M68 came out, and it was linked using lld-link instead of VC ++ linker. If you run dumpbin and look at the debug information, you will see:
Ok, probably WPA doesn’t like these slashes. But it still doesn't make sense, because I changed the linker to lld-link, and I remember that I had tested WPA before, so what happened ...
It turned out that the reason for the new WPA version 17134. I tested the layout of lld-Link - and it worked fine in WPA 16299. How matched! The new linker and the new WPA were incompatible.
I installed the old version of WPA to continue the investigation (xcopy from the machine with the old version) and reported a lld-link bug , which the developers quickly fixed. Now you can go back to WPA 17134 when the M69 has a fixed linker built.
The WMI Hangup Trigger is a Windows Management Instrumentation ( Windows Management Snap-in ), and I’m not good at it. I discovered that in 2014 or earlier someone had encountered the problem of significant CPU usage in WmiPrvSE.exe inside perfproc! GetProcessVaData , but they did not provide enough information to understand the reasons for the bug. At some point, I made a mistake and tried to figure out what a crazy WMI request might hang Gmail for a few seconds. I connected to the investigation of some experts and spent a lot of time trying to find this magical query. I recorded the Microsoft-Windows-WMI-Activityin ETW traces, experimented with PowerShell to find all Win32_Perf requests, and got lost on several more roundabout paths that are too boring to discuss. In the end, I discovered that the Gmail hangup is causing the Win32_PerfRawData_PerfProc_ProcessAddressSpace_Costly counter to be launched by the same PowerShell host :
I then got lost more because of the name of the counter (“expensive”? Really?) And because this counter appears and disappears based on factors that I do not understand.
But the details of WMI do not matter. WMI didn't do anything bad — not really — it just scanned memory. Writing your own scan code turned out to be much more useful in investigating the problem.
Chrome has released a patch, the rest is for Microsoft.
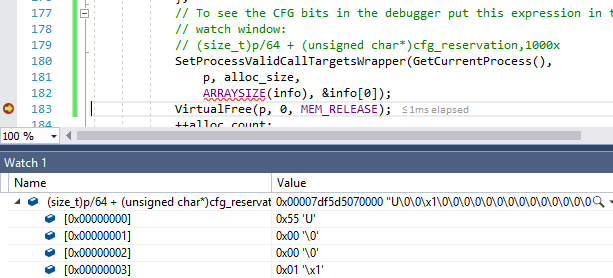
I updated code examples , especially VAllocStress. There are 20 lines included to demonstrate how to find the CFG reservation for the process. I also added test code that uses SetProcessValidCallTargets to check the value of the CFG bits and demonstrate the tricks required for their successful call (hint: a call through GetProcAddress will likely lead to a violation of the CFG!)
The point was that a process with Control Flow Guard support (CFG) allocates executable memory while simultaneously allocating CFG memory, which Windows never releases. Therefore, if you continue to allocate and free executable memory at different addresses , the process accumulates an arbitrary amount of CFG memory. The Chrome browser does this, which leads to almost unlimited memory leaks and hangs on some machines.
It should be noted that hang-ups are difficult to avoid if VirtualAlloc starts working more than a million times slower than usual.
In addition to CFG, there is another wasted memory, although it is not as much as vmmap claims.
CFG and pages
Both the program memory and CFG memory are ultimately allocated with 4-kilobyte pages (more on this later). Since 4 KB of CFG memory can describe 256 KB of program memory (more on this later), this means that if you allocate a 256 KB memory block aligned to 256 KB, you will receive one CFG page of 4 KB. And if you select a block of executable memory of 4 KB, then you still get the CFG page at 4 KB, but most of it will not be used.
Everything is more complicated if the executable memory is freed. If you use the VirtualFree function on a block of executable memory that is not a multiple of 256 KB or not aligned on 256 KB, the OS should perform some analysis and check that any other executable memory does not use a CFG page. The authors of CFG decided not to bother - and just forever leave the allocated CFG memory. Very regrettable. This means that when my test program allocates and then releases 1 gigabyte of aligned executable memory, it leaves 16 MB of CFG memory.In practice, it turns out that when the Chrome JavaScript engine allocates and then frees 128 MB of aligned executable memory (not all of it was used, but the entire range is selected and immediately released), up to 2 MB of CFG memory will remain selected, although it is trivial to free it entirely . Since Chrome repeatedly allocates and frees memory at random addresses, this leads to the problem described above.
Extra lost memory
In any modern OS, each process gets its own virtual memory address space so that the OS isolates processes and protects memory. This is done using a memory management unit (MMU) and page tables . Memory is divided into pages of 4 KB. This is the minimum amount of memory that the OS gives you. An eight-byte record in the page table points to each page, and the records themselves are stored in 4 KB pages. Each of them points to a maximum of 512 different pages of memory, so we need a hierarchy of page tables. For a 48-bit address space in a 64-bit operating system, the system is:
- Level 1 table covers 256 TB (48 bits), pointing to 512 different level 2 page tables.
- Each level 2 table covers 512 GB, pointing to 512 level 3 tables
- Each level 3 table covers 1 GB, pointing to 512 level 4 tables
- Each level 4 table covers 2 MB, pointing to 512 physical pages.
The MMU indexes the table of the 1st level in the first 9 (out of 48) bits of the address, the table of the 2nd level in the next 9 bits, and the rest of the levels are given out at 9 bits, that is, only 36 bits. The remaining 12 bits are used to index 4-kilobyte pages from a level 4 table. Well well.
If you immediately fill all levels of the tables, you will need more than 512 GB of RAM, so they are filled as needed. This means that when allocating a page of memory, the OS allocates some page tables — from zero to three, depending on whether the allocated addresses are in a previously unused 2 MB area, a previously unused 1 GB area or a previously unused 512 GB area (page table of level 1). always stands out).
In short, allocations to random addresses are much more expensive than allocations to nearby addresses, since in the first case, page tables cannot be shared. CFG leaks are quite rare, so when vmmap showed 412 480 KB of used page tables in Chrome, I assumed the numbers were correct. Here is a screenshot of the vmmap with the chrome.exe memory layout from the previous article, but with the Page Table string:
But something seemed wrong. I decided to add a page table simulator to my VirtualScan tool . It calculates how many pages of page tables are needed for all allocated memory during the scanning process. You just need to scan the allocated memory, adding one to each counter, a multiple of 2 MB, 1 GB or 512 GB.
It was quickly discovered that the results of the simulator correspond to vmmap on normal processes, but not on processes with a large amount of CFG memory. The difference roughly corresponds to the allocated CFG memory. For the above process, where vmmap says 402.8 MB (412 480 KB) of page tables, my tool shows 67.7 MB.
     Scan time, committed, page tables, committed blocks
Total: 41.763s, 1457.7 MiB, 67.7 MiB, 32112, 98 code blocks
CFG: 41.759s, 353.3 MiB, 59.2 MiB, 24866
I was convinced of the vmmap error by running VAllocStress , which in the default settings causes Windows to allocate 2 gigabytes of CFG memory. vmmap claimed that he allocated 2 gigabytes of page tables:
And when I completed the process through Task Manager, vmmap showed that the amount of allocated memory decreased by only 2 gigabytes. So, vmmap is wrong, my calculations with the page tables are correct, and after a fruitful discussion on Twitter, I sent a vmmap error report, which should be fixed. The CFG memory still consumes a lot of page table entries (59.2 MB in the above example), but not as much as vmmap says, and after the fix, it will not consume almost anything.
What is CFG and CFG memory?
I want to step back a bit and tell you more about what CFG is.
CFG is short for Control Flow Guard. This is a method to protect against exploits by rewriting function pointers. When CFG is enabled, the compiler and the OS together verify the validity of the branch target. First, the corresponding control byte CFG is loaded from the reserved CFG area of 2 TB. The 64-bit process in Windows manages the address space of 128 TB, so dividing the address into 64 allows you to find the corresponding CFG byte for this object.
uint8_t cfg_byte = cfg_base[size_t(target_addr) / 64];Now we have one byte, which should describe which addresses in the 64-byte range are valid targets for branches. For this, CFG processes bytes as four two-bit values, each of which corresponds to a 16-byte range. This two-bit number (whose value is from zero to three) is interpreted as follows :
- 0 - all targets in this 16-byte block are invalid targets for indirect branches.
- 1 - The starting address in this 16-byte block is the valid target of the indirect branch.
- 2 — associated with “suppressed” CFG calls ; address potentially invalid
- 3 - unaligned addresses in this 16-byte block are valid targets for the indirect branch, however a 16-byte aligned address is potentially invalid
If the goal of the indirect branch is invalid, the process ends and the exploit is prevented. Hooray!
From this we can conclude that for maximum security, the indirect goals of the branch should be aligned by 16 bytes, and it can be understood why the CFG memory size for the process is approximately 1/64 of the program memory size.
CFG actually loads 32 bits at a time, but these are implementation details. Many sources describe CFG memory as one-bit at 8 bytes, and not two-bit at 16 bytes. My explanation is better.
That's why everything is bad
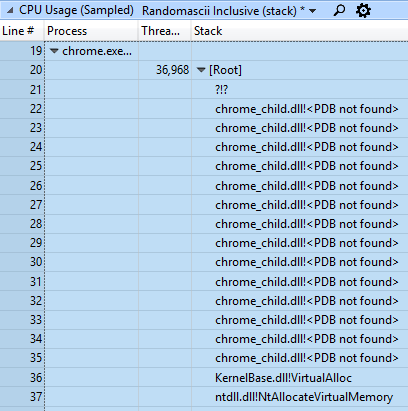
Gmail hangs up for two reasons. First, scanning CFGs on Windows 10 16299 or earlier is painfully slow. I saw how the scanning of the address space of a process takes 40 seconds or more, and literally 99.99% of this time, the reserved CFG memory is scanned, although it is only about 75% of the fixed memory blocks. I do not know why the scan was so slow, but in Windows 10 17134 this was fixed, so there is no point in exploring the problem in more detail.
Because of slow crawl, there was a hangup because Gmail wanted to get a CFG backup, and WMI held the lock for the duration of the scan. But the memory reservation lock was not held throughout the scan. In my example in the field of CFG, approximately 49,000 blocks, and the NtQueryVirtualMemory function , which acquires and releases a lock, was called once for each of them. Therefore, the lock was obtained and released ~ 49,000 times, and each time it was held for less than 1 millisecond.
But although the lock was cleared 49,000 times, for some reason, the Chrome process could not get it. This is unfair!
That is the essence of the problem. As I wrote last time:
This is because Windows locks are inherently unfair - and if the thread releases the lock and then immediately requests it again, it can receive it forever.
Fair locking means that two concurrent streams will receive it in turn. But this means a lot of expensive context switches, so for a long time the lock will not be used.
Unfair locks are cheaper, and they do not keep threads waiting in a queue. They just grab a lock, as mentioned in Joe Duffy's article . He also writes:
The introduction of unfair locks, of course, can lead to hunger. But statistically, time in parallel systems tends to be so variable that each thread will eventually get its turn to execute, from a probabilistic point of view.
How do you relate Joe's 2006 statement about hunger rarity with my experience on a 100% repeatable and long-lasting problem? I think the main reason is what happened in 2006. Intel released the Core Duo , and multi-core computers became ubiquitous.
After all, it turns out that this problem of hunger occurs only on a multi-core system! In such a system, the WMI thread will release the lock, give a signal to the Chrome thread about waking up and continue to work. Since the WMI thread is already running, it has a “handicap” before the Chrome flow, so it easily re-calls NtQueryVirtualMemory and re-acquires the lock before Chrome has a chance to do so.
It is obvious that in a single-core system only one thread can work at a time. As a rule, Windows increases the priority of a new thread, and an increase in priority means that when a lock is released, a new Chrome thread will be ready and will immediately overtake the WMI stream. This gives Chrome a lot of time to wake up and get a lock, and hunger never comes.
Do you understand? In a multi-core system, the priority increase in most cases does not affect the WMI thread, since it will run on a different core!
This means that a system with additional cores may respond more slowly.than a system with the same workload and fewer cores. Another conclusion is also curious: if my computer had a large load — streams of the corresponding priority running on all processor cores — then the hang could be avoided (do not try this at home).
Thus unfair locksincrease productivity, but can lead to hunger. I suspect that the solution may be what I call “sometimes fair” locks. Say, 99% of the time they will be unfair, but in 1% give the lock to another process. This will preserve the performance benefits with more, avoiding the problem of hunger. Previously, locks in Windows were distributed fairly and probably you can partially return to this by finding the perfect balance. Disclaimer: I’m not a lock expert or OS engineer, but I’m interested to hear this, and at least I’m not the first to suggest something like that .
Linus Torvalds recently appreciated the importance of fair blocking: here and here . Maybe it's time for changes in Windows.
To summarize : Locking for a few seconds is not good, it limits parallelism. But on multi-core systems with unfair locks, the removal and then the immediate re-acquisition of the lock behaves exactly this way - other threads have no opportunity to work.
Almost fail with ETW
For all these studies, I relied on ETW tracing, so I was a little scared when it turned out at the beginning of the investigation that the Windows Performance Analyzer (WPA) could not load the Chrome characters. I am sure, literally last week everything worked. What happened ... It happened that Chrome M68 came out, and it was linked using lld-link instead of VC ++ linker. If you run dumpbin and look at the debug information, you will see:
C:\b\c\b\win64_clang\src\out\Release_x64\./initialexe/chrome.exe.pdbOk, probably WPA doesn’t like these slashes. But it still doesn't make sense, because I changed the linker to lld-link, and I remember that I had tested WPA before, so what happened ...
It turned out that the reason for the new WPA version 17134. I tested the layout of lld-Link - and it worked fine in WPA 16299. How matched! The new linker and the new WPA were incompatible.
I installed the old version of WPA to continue the investigation (xcopy from the machine with the old version) and reported a lld-link bug , which the developers quickly fixed. Now you can go back to WPA 17134 when the M69 has a fixed linker built.
WMI
The WMI Hangup Trigger is a Windows Management Instrumentation ( Windows Management Snap-in ), and I’m not good at it. I discovered that in 2014 or earlier someone had encountered the problem of significant CPU usage in WmiPrvSE.exe inside perfproc! GetProcessVaData , but they did not provide enough information to understand the reasons for the bug. At some point, I made a mistake and tried to figure out what a crazy WMI request might hang Gmail for a few seconds. I connected to the investigation of some experts and spent a lot of time trying to find this magical query. I recorded the Microsoft-Windows-WMI-Activityin ETW traces, experimented with PowerShell to find all Win32_Perf requests, and got lost on several more roundabout paths that are too boring to discuss. In the end, I discovered that the Gmail hangup is causing the Win32_PerfRawData_PerfProc_ProcessAddressSpace_Costly counter to be launched by the same PowerShell host :
measure-command {Get-WmiObject -Query “SELECT * FROM Win32_PerfFormattedData_PerfProc_ProcessAddressSpace_Costly”}I then got lost more because of the name of the counter (“expensive”? Really?) And because this counter appears and disappears based on factors that I do not understand.
But the details of WMI do not matter. WMI didn't do anything bad — not really — it just scanned memory. Writing your own scan code turned out to be much more useful in investigating the problem.
Troubles for Microsoft
Chrome has released a patch, the rest is for Microsoft.
Accelerate the scan of regions CFG- well, it's done- Freeing CFG memory when executing memory is released - at least in the case of 256 KB alignment, this is easy
- Consider a flag that allows you to allocate executable memory without CFG memory, or use PAGE_TARGETS_INVALID for this purpose. Note that the Windows Internals Part 1 7th Edition manual says that “you should allocate [CFG] pages with at least one bit set {1, X}” - if Windows 10 implements this, then the PAGE_TARGETS_INVALID flag (which is currently used by the v8 ) avoid memory allocation
- Fix the calculation of page tables in vmmap for processes with a large number of CFG selections
Code updates
I updated code examples , especially VAllocStress. There are 20 lines included to demonstrate how to find the CFG reservation for the process. I also added test code that uses SetProcessValidCallTargets to check the value of the CFG bits and demonstrate the tricks required for their successful call (hint: a call through GetProcAddress will likely lead to a violation of the CFG!)