The best English-speaking reports from HighLoad ++ 2017
In continuation of the “ debriefing ” with HighLoad ++ 2017, we prepared a small overview of the five best (according to the participants of the conference) English-language reports.
Top marks were given to topics related to the use of ProxySQL (in the TOP-5 there were as many as two reports on this tool), application testing in the Amazon public cloud, as well as the principles of logging at a scale when it becomes a problem, and monitoring Apache Kafka.
Henrik Ingo (MongoDB Solution Architect, and now Lead Performance Engineer in Mongo DB).
The first report, noted by the participants, argues that the public cloud can really be used to test our own products, including for load testing. “Experimental” in this case was the open source MongoDB DBMS, which is being tested using the Amazon cloud. In total, about 400 thousand hours are spent on this task per month, about 5% of this time is just performance tests, whose main task is not even to provide optimization, and not to allow "subsidence" as a result of some improvements.
The key question is how to get reproducible test results in a public cloud?
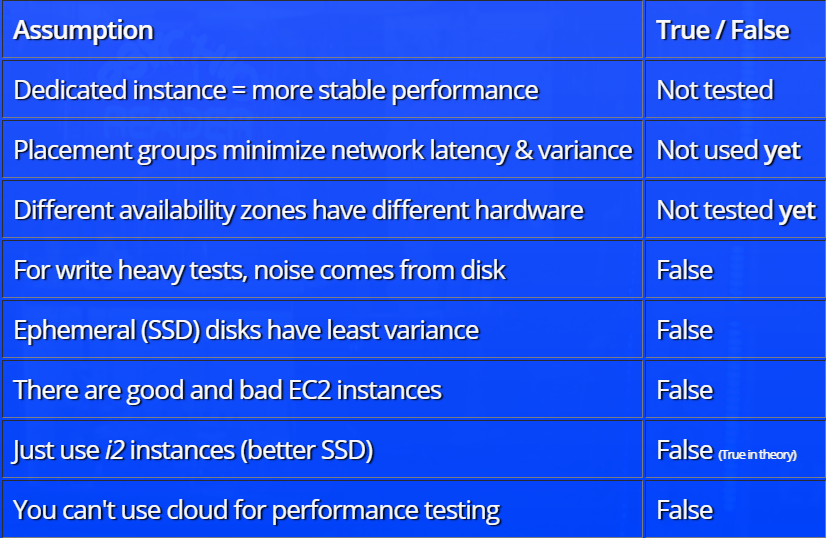
The report is based on the principle of hypothesis analysis. At first, Henrik Ingo suggests what factors should influence the level of “noise” in tests (the very concept of “noise” in the report has a very specific definition). For example, the testing team suggested that the main “noise” on hard drives comes from the hard drive, or that in the cloud when distributing resources, you can “run into” good (fully allocated) or bad (shared with someone) instances that affect the test results.
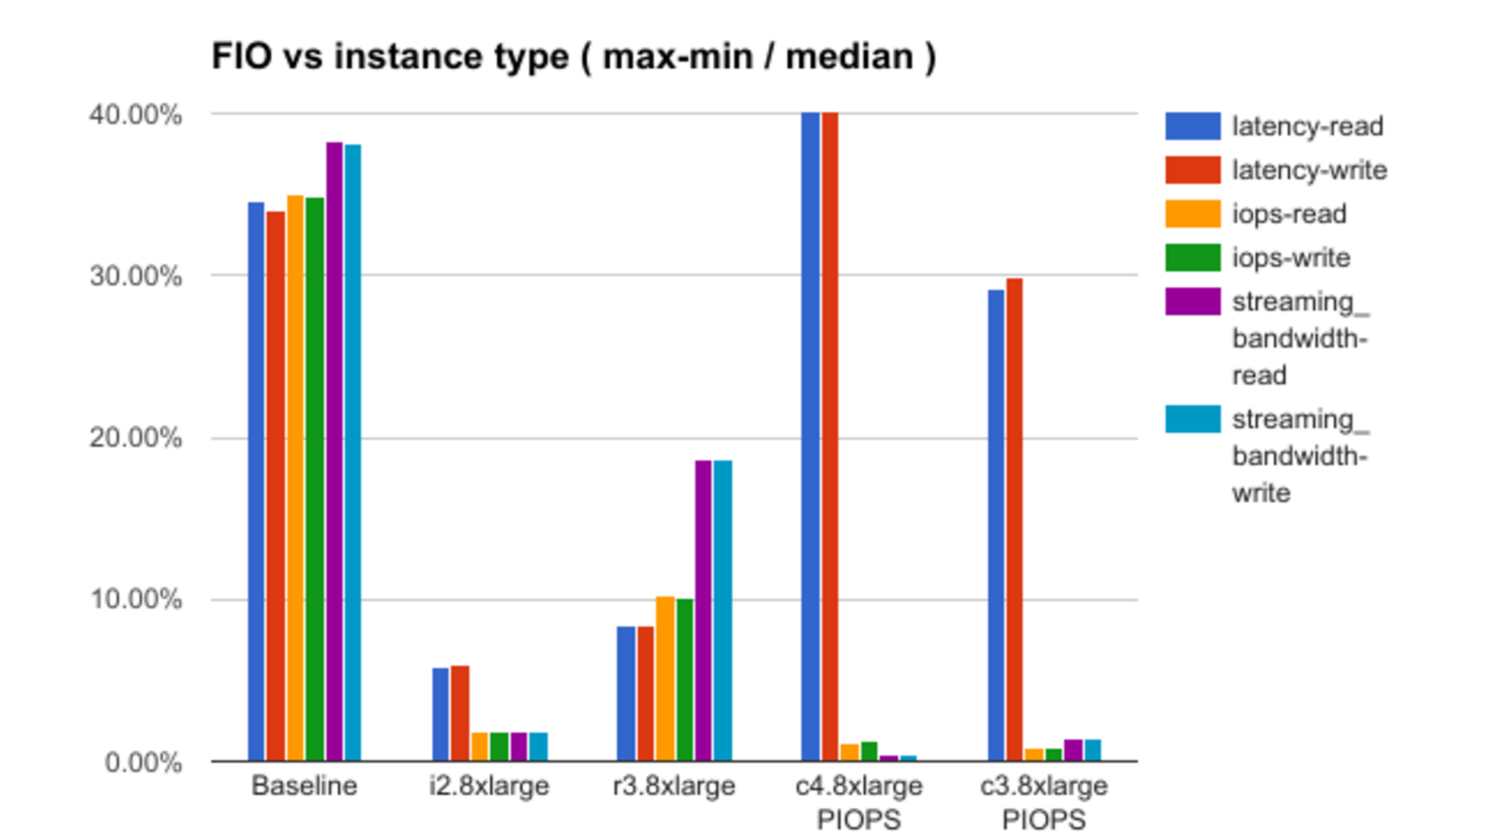
After that, the results of testing each of the theories are analyzed with a demonstration of some interesting dependencies. For example, here is a graph of the dependence of the “noise” level (in the terminology of the report) on the selected configuration of the instance:
For lack of information about the details of the Amazon infrastructure, the report does not provide answers to all the questions, in some cases making only assumptions, but there is a lot to think about.
Vytis Valentinavičius (Lamoda, lead of operations)
The next interesting report is the thoughts of a specialist of a large online store Lamoda about logging and how it should be, so that developers, on the one hand, receive the necessary data in full, and on the other, do not drown in gigabytes of incoming information. And the speaker knows what he is talking about. The problem that started building logging in Lamoda is the loss of 5% of reports sent by users via UDP (in some cases this proportion reached 100%). This seriously distorted all the metrics that could be built on their basis.
The report tells, not how to unravel a similar situation, but how to prevent it in principle, given that many obvious solutions have their own pitfalls.
Vytis Valentinavičius emphasizes that the log should have a structure. But at the same time it can not be inflated. To collect and store each field must have its own purpose, since any data collected is money. An example of Lamoda is 25 thousand debug log messages per second (32 TB of information per week, only the storage for which costs 12 thousand dollars).
In addition, it is important to track not specific errors, but events. They should be aggregated, metrics should be identified, and, based on their analysis, more complex events should be built for future aggregation.
In addition to theoretical reflections, the report contains a description of some of the tricks that Lamoda used in production to work with logs.
Gwen Shapira (Confluent, product manager)
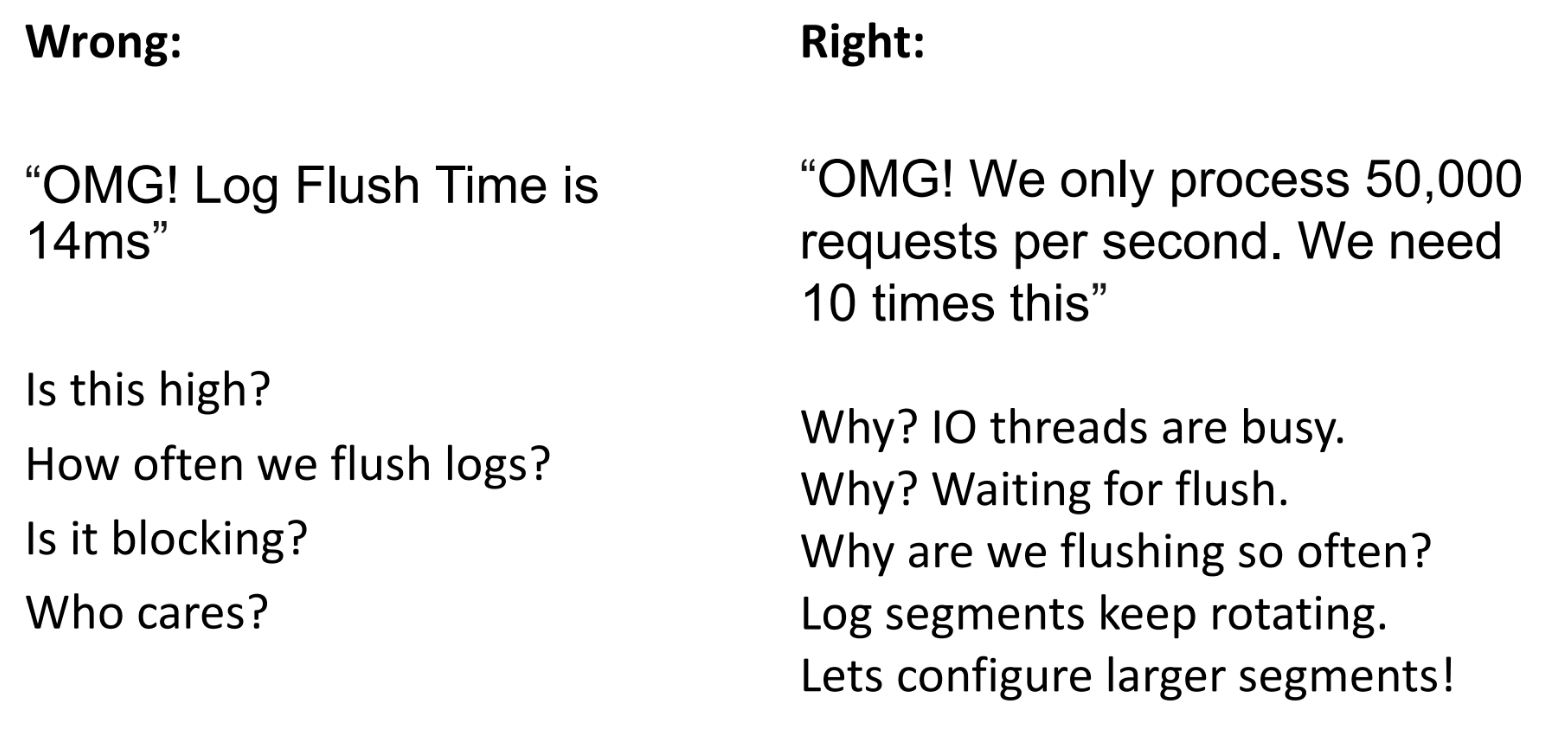
The next report is about monitoring Apache Kafka, or rather, which metrics to choose from the abundance of parameters available for analysis in order to understand the status of the message broker at any given time.
The speaker began her story with a joke, in which, as they say, there is only a joke share: “Even if you cannot remember the content of the entire report, remember one thing: if Kafka is used in production, it must be monitored” (good, for this is provided the corresponding API ).
Is it necessary to monitor everything? Depends on the task. It is from them that Gwen Shapira is repelled, dismantling the recommended metrics. The speaker describes the standard operational cases and recommends the parameters that need to be added to the dashboard in order to react to what is happening in time, and how not to aggravate the situation. In particular, it reminds once again that you should not restart the broker when you first change the metrics, since this requires a lot of time and sometimes (due to known bugs) can lead to more serious consequences. Ultimately, metrics are only initial data. And in order to make decisions, one must have hypotheses based on this data.
Due to the vast experience of Gwen Shapira in the status of a consultant, the entire performance is accompanied by vivid examples from life.
Alkin Tezuysal (Percona, Global DBA team)
Immediately, two reports made by participants in the TOP-5 concern ProxySQL - a means of proxying SQL queries to MySQL (and, more recently, ClickHouse).
The first report is about the overall use of this tool.
ProxySQL is an open source solution, so until now we have never seen such a quintessence of experience. Yes, many companies download this solution, but even the manufacturer does not always understand who will use it and on what scale. The scenarios collected in this report were revealed as a result of communication with ProxySQL users and analysis of their cases.
In general, ProxySQL allows you to solve a huge number of tasks, from load balancing and rewriting requests (which will be discussed in the next report from our list), to a queue of requests and warming up the cache, which is not in MySQL. Each of the options Alkin Tezuysal examines in detail, mentioning the advantages and disadvantages of the solution, as well as particular cases in which it can be useful.
Here we mention only two examples concerning the optimization of the database.
Example 1 - using ProxySQL to reduce the number of requests to install an application connection to a database. The idea is vividly reflected in the graph given in the report:
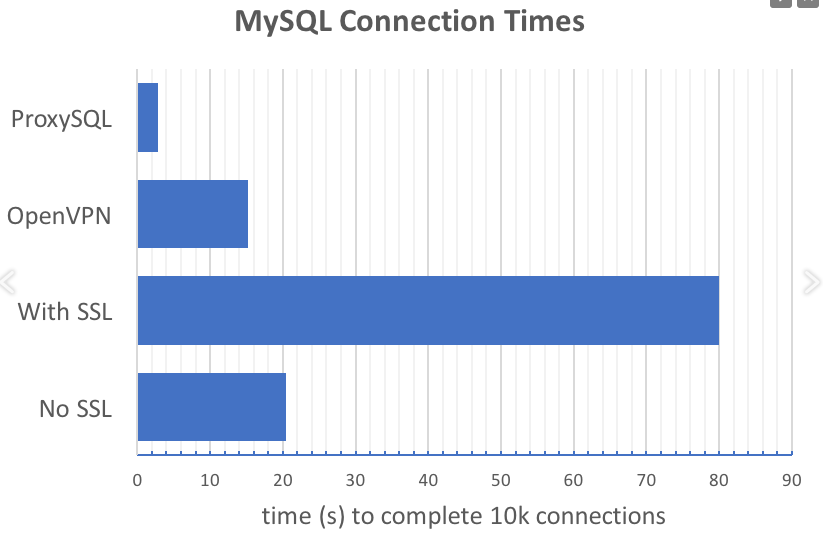
ProxySQL drastically reduces the number of connection setup requests, especially when using SSL.
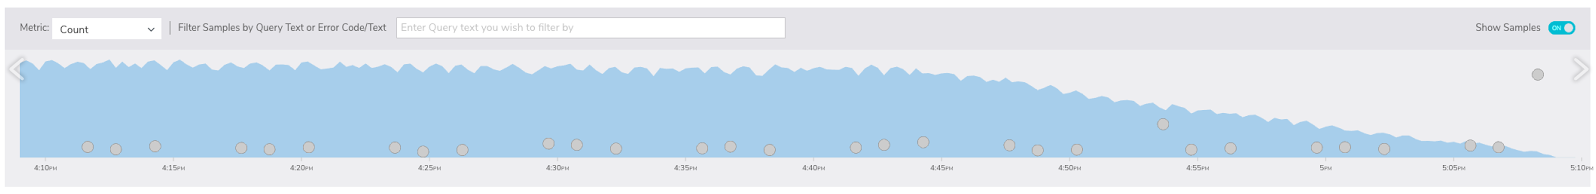
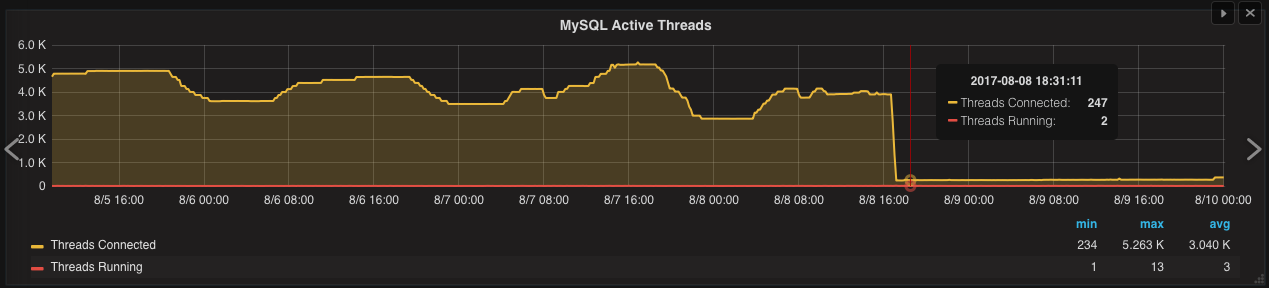
Example 2 - filtering useless queries (like SELECT 1, manifested in large-scale applications), which slow down the database. Here, the result is also best evaluated graphically:
Rene Cannao (founder and product owner ProxySQL)
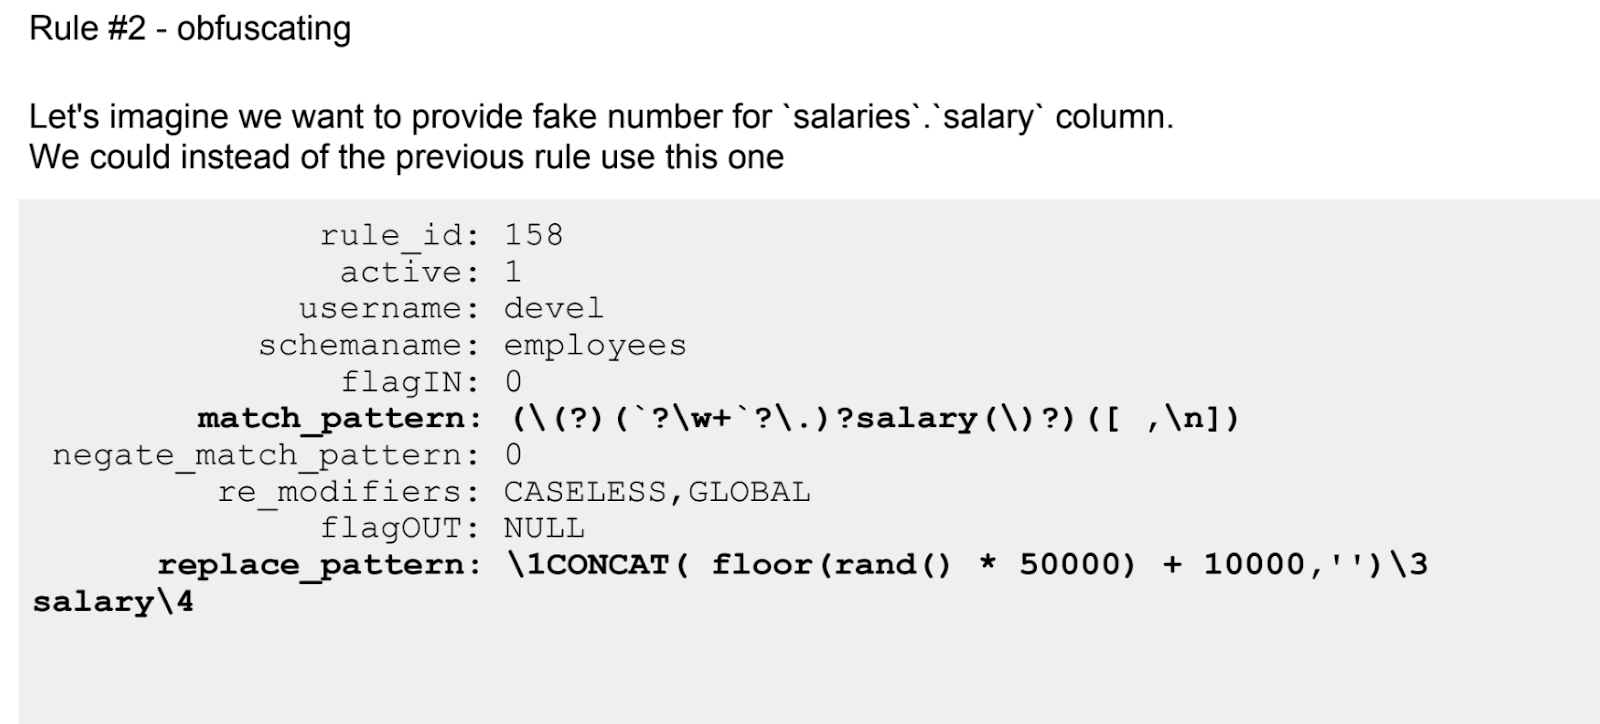
The second English-speaking report about ProxySQL, caught in the TOP-5, is devoted to solving a very specific problem - data masking.
After a brief introduction to ProxySQL for those who have not seen the first report, the speaker is immersed in the capabilities of the tool in relation to solving a specific task - hiding (replacing asterisks) parts of the name or replacing the real amount of income with the fake one.
As the speaker notes, this problem can be solved by the own means of the same MySQL or third-party products. Among third-party ProxySQL - not the only tool. However, so far there is no perfect solution on the market, and ProxySQL is not worse than many, allowing developers to get valid data for tests that do not contain real personal information. At the same time it has an open source code.
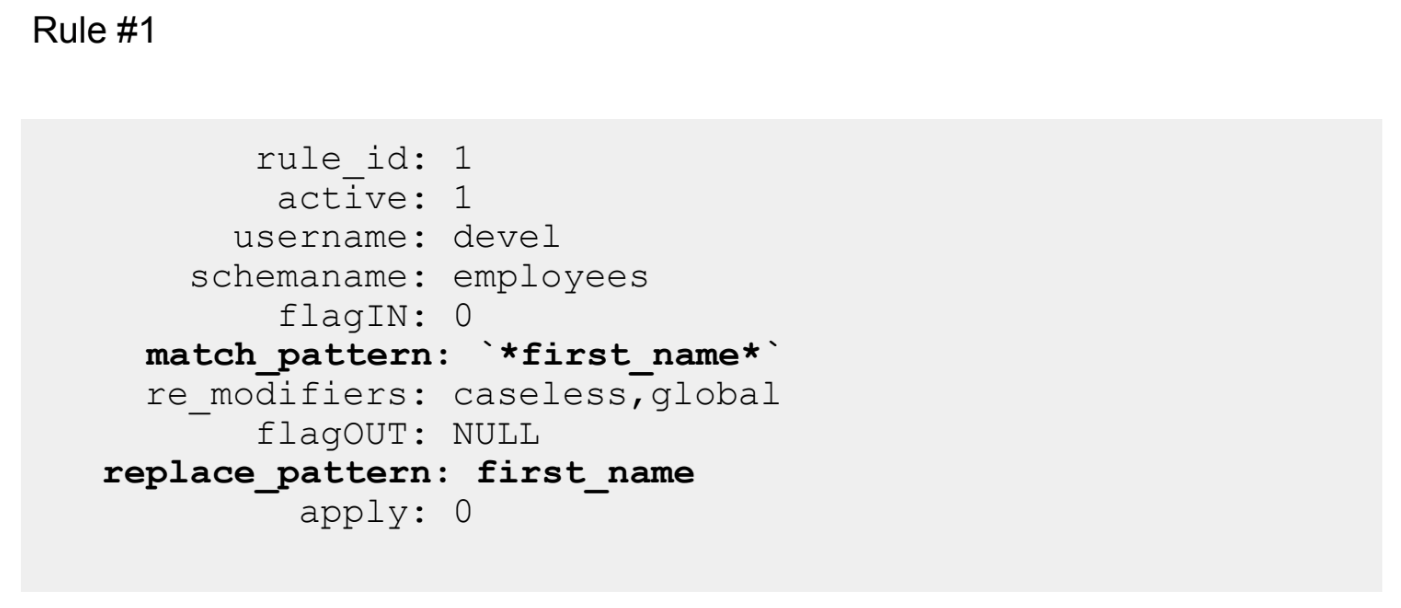
If the first story about ProxySQL was more theoretical, then here is a solid practice. There are even rules set using regular expressions.
Like any tool ProxySQL has its limitations. This will also be discussed. In particular, this is not the best approach for complex transformations.
The report ended with a full-fledged question-answer section, from which one can also learn a lot of useful and interesting things.
Of course, this English-speaking five is only the tip of the iceberg that was on HighLoad ++ 2017. Therefore, we recall that we just posted videos of all the conference reports that can be found here in this playlist .
Top marks were given to topics related to the use of ProxySQL (in the TOP-5 there were as many as two reports on this tool), application testing in the Amazon public cloud, as well as the principles of logging at a scale when it becomes a problem, and monitoring Apache Kafka.
Video recordings of all reports HighLoad ++ 2017 we just posted for free access. A complete list of 150 reports on our YouTube channel in this playlist .
In addition to the playlist in the channel several hundred videos on databases, architectures, scaling, queues, machine learning and other highload-wisdom :)
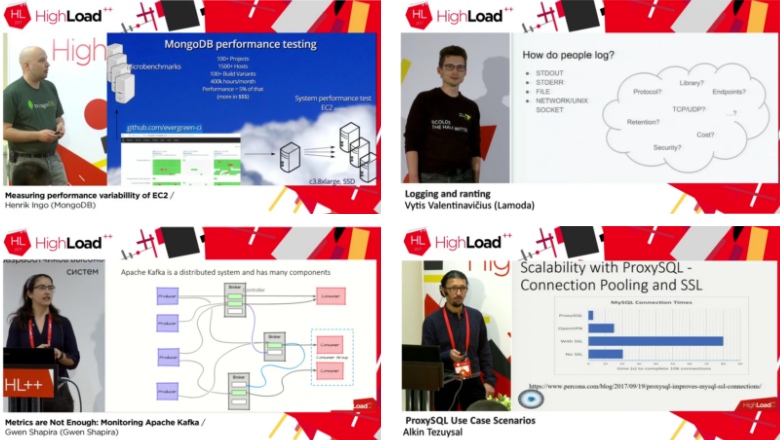
Measuring performance variabillity of EC2
Henrik Ingo (MongoDB Solution Architect, and now Lead Performance Engineer in Mongo DB).
The first report, noted by the participants, argues that the public cloud can really be used to test our own products, including for load testing. “Experimental” in this case was the open source MongoDB DBMS, which is being tested using the Amazon cloud. In total, about 400 thousand hours are spent on this task per month, about 5% of this time is just performance tests, whose main task is not even to provide optimization, and not to allow "subsidence" as a result of some improvements.
The key question is how to get reproducible test results in a public cloud?
The report is based on the principle of hypothesis analysis. At first, Henrik Ingo suggests what factors should influence the level of “noise” in tests (the very concept of “noise” in the report has a very specific definition). For example, the testing team suggested that the main “noise” on hard drives comes from the hard drive, or that in the cloud when distributing resources, you can “run into” good (fully allocated) or bad (shared with someone) instances that affect the test results.
After that, the results of testing each of the theories are analyzed with a demonstration of some interesting dependencies. For example, here is a graph of the dependence of the “noise” level (in the terminology of the report) on the selected configuration of the instance:
For lack of information about the details of the Amazon infrastructure, the report does not provide answers to all the questions, in some cases making only assumptions, but there is a lot to think about.
Logging and ranting
Vytis Valentinavičius (Lamoda, lead of operations)
The next interesting report is the thoughts of a specialist of a large online store Lamoda about logging and how it should be, so that developers, on the one hand, receive the necessary data in full, and on the other, do not drown in gigabytes of incoming information. And the speaker knows what he is talking about. The problem that started building logging in Lamoda is the loss of 5% of reports sent by users via UDP (in some cases this proportion reached 100%). This seriously distorted all the metrics that could be built on their basis.
The report tells, not how to unravel a similar situation, but how to prevent it in principle, given that many obvious solutions have their own pitfalls.
Vytis Valentinavičius emphasizes that the log should have a structure. But at the same time it can not be inflated. To collect and store each field must have its own purpose, since any data collected is money. An example of Lamoda is 25 thousand debug log messages per second (32 TB of information per week, only the storage for which costs 12 thousand dollars).
In addition, it is important to track not specific errors, but events. They should be aggregated, metrics should be identified, and, based on their analysis, more complex events should be built for future aggregation.
In addition to theoretical reflections, the report contains a description of some of the tricks that Lamoda used in production to work with logs.
Metrics are Not Enough: Monitoring Apache Kafka
Gwen Shapira (Confluent, product manager)
The next report is about monitoring Apache Kafka, or rather, which metrics to choose from the abundance of parameters available for analysis in order to understand the status of the message broker at any given time.
The speaker began her story with a joke, in which, as they say, there is only a joke share: “Even if you cannot remember the content of the entire report, remember one thing: if Kafka is used in production, it must be monitored” (good, for this is provided the corresponding API ).
Is it necessary to monitor everything? Depends on the task. It is from them that Gwen Shapira is repelled, dismantling the recommended metrics. The speaker describes the standard operational cases and recommends the parameters that need to be added to the dashboard in order to react to what is happening in time, and how not to aggravate the situation. In particular, it reminds once again that you should not restart the broker when you first change the metrics, since this requires a lot of time and sometimes (due to known bugs) can lead to more serious consequences. Ultimately, metrics are only initial data. And in order to make decisions, one must have hypotheses based on this data.
Due to the vast experience of Gwen Shapira in the status of a consultant, the entire performance is accompanied by vivid examples from life.
ProxySQL Use Case Scenarios
Alkin Tezuysal (Percona, Global DBA team)
Immediately, two reports made by participants in the TOP-5 concern ProxySQL - a means of proxying SQL queries to MySQL (and, more recently, ClickHouse).
The first report is about the overall use of this tool.
ProxySQL is an open source solution, so until now we have never seen such a quintessence of experience. Yes, many companies download this solution, but even the manufacturer does not always understand who will use it and on what scale. The scenarios collected in this report were revealed as a result of communication with ProxySQL users and analysis of their cases.
In general, ProxySQL allows you to solve a huge number of tasks, from load balancing and rewriting requests (which will be discussed in the next report from our list), to a queue of requests and warming up the cache, which is not in MySQL. Each of the options Alkin Tezuysal examines in detail, mentioning the advantages and disadvantages of the solution, as well as particular cases in which it can be useful.
Here we mention only two examples concerning the optimization of the database.
Example 1 - using ProxySQL to reduce the number of requests to install an application connection to a database. The idea is vividly reflected in the graph given in the report:
ProxySQL drastically reduces the number of connection setup requests, especially when using SSL.
Example 2 - filtering useless queries (like SELECT 1, manifested in large-scale applications), which slow down the database. Here, the result is also best evaluated graphically:
Inexpensive Datamasking for MySQL with ProxySQL - Data Anonymization for Developers
Rene Cannao (founder and product owner ProxySQL)
The second English-speaking report about ProxySQL, caught in the TOP-5, is devoted to solving a very specific problem - data masking.
After a brief introduction to ProxySQL for those who have not seen the first report, the speaker is immersed in the capabilities of the tool in relation to solving a specific task - hiding (replacing asterisks) parts of the name or replacing the real amount of income with the fake one.
As the speaker notes, this problem can be solved by the own means of the same MySQL or third-party products. Among third-party ProxySQL - not the only tool. However, so far there is no perfect solution on the market, and ProxySQL is not worse than many, allowing developers to get valid data for tests that do not contain real personal information. At the same time it has an open source code.
If the first story about ProxySQL was more theoretical, then here is a solid practice. There are even rules set using regular expressions.
Like any tool ProxySQL has its limitations. This will also be discussed. In particular, this is not the best approach for complex transformations.
The report ended with a full-fledged question-answer section, from which one can also learn a lot of useful and interesting things.
Of course, this English-speaking five is only the tip of the iceberg that was on HighLoad ++ 2017. Therefore, we recall that we just posted videos of all the conference reports that can be found here in this playlist .
HighLoad++ 2018 состоится 8 и 9 ноября в Москве, в Сколково. Работа над программой уже идет, но подать доклад можно до 1 сентября.