Learning the Debugger, Part Two
In the first part of the article , some nuances of working with the integrated Delphi debugger were considered - not all of course, but most necessary for the developer. Now the task looks a little different: consider its work from the inside using the example of its source code. In order not to bore you much with the description of the API functions and not to chew all the stages of debugging, I will describe its work using the TFWDebugerCore class as an example. I will omit some of the not very important points, if you wish, you can clarify them by looking at the code of this class.
If you are already familiar with the work of the debugger - it's okay, it is likely that some aspects of its work mentioned in the article will be of interest to you.
If you have never before encountered an independent implementation of the debugger, but are interested in it, then at least you should start with this link: Debugging and Error Handling. Using
it you can learn about the main aspects of debugging, such as the structured handling of exceptions, working with debugging information, minidumps. Working with the image of the executable file, headers, sections, a process memory card, what is RVA and VA, and so on and so forth.
But this is only if you want to understand all this kitchen.
I’ll try to describe only part of it in a simpler language, so that you have a point from which you could push off, if you suddenly become interested, and of course, if you are implementing application protection, you need to understand at least the intricacies of the debugger (otherwise how else?).
There will be a lot of code in the text of the article, but I will not consider all the parameters of each of the structures when debugging events occur, for this there is MSDN. I will dwell only on the debugger necessary for the work and try to reveal some of the nuances that you most likely will encounter when you independently implement the debugging engine.
From you, it is desirable to have at least minimal knowledge of assembler, because alas, this article can’t do without it.
Before connecting to a process, the very first step is to obtain debugging privileges. This is done with such simple code:
The next step is determined: will we join the already running process, or will we start a new process from scratch.
If the process is already running and we wanted to join it, then we only need to find out the PID of the process and execute the following code:
True, this code does not always execute successfully for at least two reasons.
The fact is that on Windows it is impossible to connect to the process with two debuggers at the same time, and if a debugger is already attached to the process we need, then the call to the DebugActiveProcess function will not be successful, and GetLastError will return an error code to us: ERROR_INVALID_PARAMETER.
The second reason may be that the process we need is started with higher privileges than the debugger. In this case, the call to the DebugActiveProcess function will also fail, and GetLastError will return an error code: ERROR_ACCESS_DENIED.
In the second case, you can work around this error by running the debugger with the required privileges.
The second option is to attach the debugger to the process, by starting the process with this code:
Everything is simple here, in the above code we started the process with the DEBUG_PROCESS flag and additionally specified the DEBUG_ONLY_THIS_PROCESS flag, indicating that we will not debug the processes created by the debugged one.
After starting the process, remember its parameters (useful).
As soon as we joined the process as a debugger, this process stops working on its own and will wait for our team for each of its movements - what should it do next. To do this, he will generate debugging events and wait until we react to them.
We can get the debugging event from the debugged process by calling the WaitForDebugEvent function, after which we can perform any necessary actions and return control to it by calling the ContinueDebugEvent function, after which again we must wait for the next event.
Those. roughly, we have to implement a Debug Event Loop.
MSND recommends the following implementation of Debug Event Loop.
Writing the Debugger's Main Loop
We will implement approximately the same in our debugger.
In the process of debugging, we will constantly be inside this cycle and process the events known to us. The WaitForDebugEvent function at each iteration of the debug loop returns a DEBUG_EVENT structure. Based on the dwDebugEventCode parameter of this structure, we can identify the type of the received event, the process ID and thread in which the event occurred, as well as the parameters of each event, presented in the form of union by the last field of this structure:
Each event has its own set of parameters, but we will dwell on them a bit later.
If any of the events is not processed by our code, we simply continue to run the debugged process by calling the ContinueDebugEvent function by setting the ContinueStatus parameter to DBG_CONTINUE.
Nuance: if WaitForDebugEvent returned an error (for example, by timeout), you should not call ContinueDebugEvent, it will also return an error. At this point, they often stumble, do not forget to take it into account in your own debugger implementation.
So far, everything is quite simple, now let's see what events give us.
The very first event that the debugger will receive when debugging starts. It doesn’t matter if we started the process ourselves, or joined it by calling DebugActiveProcess, we will start working with it. The parameters for this event are stored in the DebugEvent.CreateProcessInfo structure (CREATE_PROCESS_DEBUG_INFO structure).
In general, the handler for this event looks like this:
In it, we simply remember the process parameters, and also add the ID and handle of the main thread of the process to the internal list. These data will be useful to us later.
Here we can also determine the process entry point (Entry Point), its value is recorded in the DebugEvent.CreateProcessInfo.lpStartAddres parameter and, if desired, set a breakpoint (hereinafter referred to as BP) at its address and start the process to execute. If you are a little coarse, then by performing this action we will simulate the behavior of the Delphi debugger when you press the F7 button.
What is the entry point: when the loader creates the process, until the moment when it starts, a lot of preparatory actions are performed. Creating the main thread of the application, setting up stacks, process environment / thread blocks, loading libraries, executing their TLS callbacks, etc. Only after all this is completed, does the loader transfer control directly to the entry point, from where the code implemented by the programmer is already starting. The address of this point is stored directly in the header of the PE file, from where it can be obtained by any application displaying the structure of the PE file, for example PEiD or PeExplorer, or you can read this value yourself by reading out the TImageDosHeader structure located at the very beginning of the file, its _lfanew field will be offset to start of TImageNtHeaders,
Try to compile an empty project, and press F7 in it, and then go to the CPU-View tab, it should look something like this: The
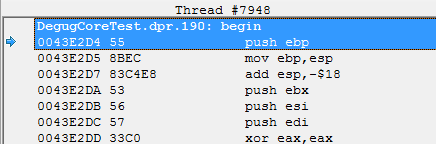
address of the entry point turned out: 0x0043E2D4. Now let's see what PEiD tells us about the resulting application:
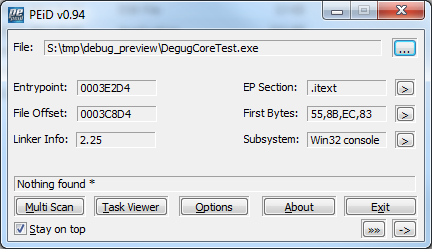
He says that the entry point value is 0x0003E2D4.
Although it does not coincide with the number that we saw in the debugger, nevertheless, everything is correct here, since the value stored in the AddressOfEntryPoint parameter is represented as RVA (Relative Virtual Address). The peculiarity of this addressing is that it does not take into account the load address of our module (hInstance). In order to get VA (Virtual Address) from the RVA address, you need to add the hInstance module to it.
There is a caveat: this is true only for applications, for libraries it works a little differently. For them, you have to focus on the addresses of the sections. More details can be found in this demo: “Implementing the file properties bookmark” .
In it, in the DebugHlp.pas module, an implementation of the ImageRvaToVa () function is given, by which you can clearly study the rules for casting addresses.
Well, for the application, the base load address is always equal to the value specified by us in the linker settings in the Image Base parameter, which by default is 0x00400000. Adding these two numbers, we just get the required 0x0043E2D4.
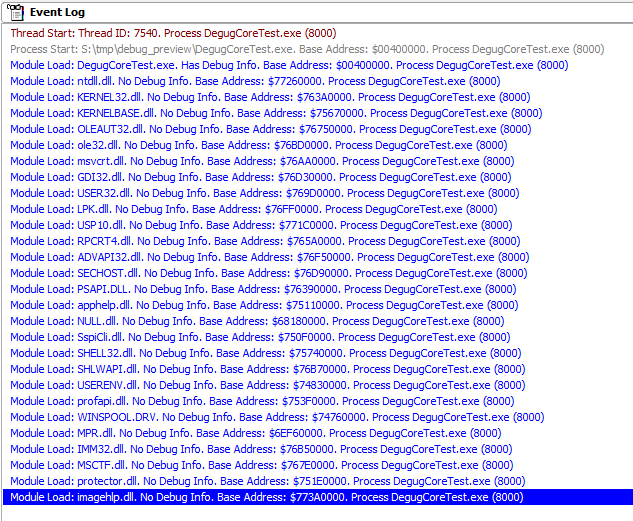
Immediately after CREATE_PROCESS_DEBUG_EVENT, we will begin to receive library loading events, with parameters in the DebugEvent.LoadDll structure (LOAD_DLL_DEBUG_INFO structure).
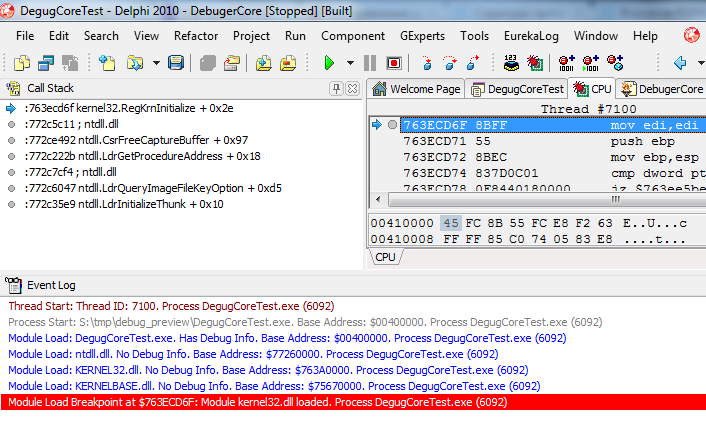
In the general case, we can observe the loading of libraries in the Delphi debugger, which displays notifications of loading in the event log:
When this event is received, Delphi, the debugger, if BP is installed to load the module, is interrupted immediately after it is loaded.
We can also notify the user about loading a module with this code:
In which, in addition to raising the event, we immediately close the handle of the loaded library, we will no longer need it (in this version of the debugger implementation).
The nuance is this: the address with the path to the loaded library, stored in the DebugEvent.LoadDll.lpImageName parameter, is not located in our address space, so we will have to read it through ReadProcessMemory.
The second nuance: this value is also a pointer to a buffer along which data about the path are located, i.e. have to read at least twice.
The third caveat: the path can be both in Ansii and in Unicode encoding.
Well, for a snack, the fourth caveat: we may not read the data :)
To get a valid path to the loadable library, the TFWDebugerCore class provides the GetDllName method that takes into account all these points.
Consider the implementation.
The TFWDebugerCore class will notify us of loading the library by calling the external OnLoadDll event, where we will write the following code:
Here, we call the TFWDebugerCore.GetDllName () method and (focusing on the fUnicode parameter) print the data to the console.
The implementation of the GetDllName method is as follows:
That is, first we try to get the library path by reading data from the address space of the debugged process (ReadData + ReadStringA), and if it doesn’t work out, we take this data by calling the GetMappedFileNameA function. It returns data using symbolic links, so the good result still needs to be brought to the normal path, but in this case, I did not do this, so as not to over complicate the code.
We will receive this event at the moment when a new thread is created in the debugged application. The parameters for this event are stored in the DebugEvent.CreateThread structure (CREATE_THREAD_DEBUG_INFO structure).
Of all the parameters, we are most interested in DebugEvent.CreateThread.hThread, which it is desirable to save in the internal list.
The nuance is that most events contain data only on the ID of the thread, and when we want to work with it (for example, install Hardware Breakpoint), we will have to make an OpenThread call on the transmitted ID. In order not to bother with these actions, we will keep the ThreadID = ThreadHandle pairs in our own cache.
The handler code for this event is as follows:
In addition to saving the parameters of the thread and calling an external handler, there is nothing in it.
The event is generated at the moment when the debugged application is trying to communicate something to the calls to the OutputDebugString function. The parameters for this event are stored in the DebugEvent.DebugString structure (OUTPUT_DEBUG_STRING_INFO structure).
The event handler is simple:
those. we just call the external handler where we need to read the transmitted string according to the same principle as we read the path to the loadable library.
For example, like this:
In the handler, we look in what encoding the buffer is passed to us, focusing on the Data.fUnicode parameter and call the corresponding function of the debugger core ReadStringХ ().
Unloading the library, closing the thread, terminating the process, and an error in the kernel of the debugger.
These four events I will skip. There is nothing extraordinary about them. Upon receipt of each of them, external handlers are called and internal lists stored by the debugger are cleaned.
There are no nuances when working with them.
All eight of the above events are, in principle, secondary. The main work begins only after the arrival of the EXCEPTION_DEBUG_EVENT event.
Its parameters go to the DebugEvent.Exception structure (EXCEPTION_DEBUG_INFO structure) .
The generation of this event means that a certain exception occurred in the debugged application, the type of which can be found in the DebugEvent.Exception.ExceptionRecord.ExceptionCode parameter. Remember, in the first part of the article I mentioned that debugging is done through the structured error handling (SEH) mechanism? Now we will consider this in more detail.
Most exceptions during the debugging process are pointed. That is, getting an exception does not mean that an error has occurred in the program itself. Most likely, the exception occurred due to the intervention of the debugger in the application, for example, by installing BP.
Nuance: If an error occurs in the application itself, we will also receive it in the form of a debugging exception and we will need to implement the debugger code in such a way that we can distinguish our induced errors from user errors.
Typically, the debugger provides three mechanisms for working with BP (well, if you do not take into account BP to load the module, because in fact this feature is not a classic BP).
To work with them, it is enough to handle three types of exceptions:
In order to make it more clear why only these three exceptions are enough, you first need to consider the mechanism for setting each type of BP before proceeding with the analysis of the logic for processing the EXCEPTION_DEBUG_EVENT event.
Implementing a breakpoint on a line of code:
Installing BP on a line of code is done by modifying the code of the debugged application. Classically, this is done by writing the 0xCC opcode to the address set by BP, meaning the instruction "INT3".
There are other options, for example, the 0xCD03 opcode, which is also an “INT3” instruction. The second option is more used for anti-debugging and is installed in most cases by the application itself, trying to catch the presence of a debugger on the fact that the nuclear _KiTrap03 () can only work with a single-byte opcode and slightly incorrectly processes a double-byte one.
But, all this is lyrics, we are interested in the first opcode.
To store the list of installed BPs, the TFWDebugerCore class uses the following structures:
Before adding a new BP, he initializes the TBreakpoint record, filling it with the necessary parameters, and then adds it to the general list of breakpoints.
For BP on a line of code, we need to store only two values, the address of BP and the value of the byte stored at this address before we erase it with the 0xCC opcode.
Installing BP in a debugged application looks something like this:
Initially, the structure is initialized, the type of BP is set, its description and parameters. Since writing to a code area that usually does not have write permissions, the corresponding rights are set, the original value located at the address BP is read, the 0xCC instruction represented by the BPOpcode constant is written, and the original page attributes are returned by a repeated call to VirtualProtectEx (). At the end of everything, if no errors have occurred, the record of the installed BP is placed in the general list of the class.
Well, now the fun begins:
After installing BP, the debugged application will continue its normal operation until the transition to the INT3 instruction we wrote down occurs. At this point, the EXCEPTION_DEBUG_EVENT event will be raised with the exception code EXCEPTION_BREAKPOINT.
Exception parameters will be passed to us in the form of a DebugEvent.Exception.ExceptionRecord (EXCEPTION_DEBUG_INFO structure) structure.
As I described earlier, BP can be installed by the debugged application itself, therefore, focusing on these parameters, you need to figure out what kind of BP worked?
For this, a list of previously saved breakpoints is useful to us. Having run through it and comparing the address stored in the DebugEvent.Exception.ExceptionRecord.ExceptionAddress parameter with the Address field of each record with type btBreakpoint, we can determine whether we installed BP at this address or is it something not ours.
If we determined that BP is really ours, then we raise an external event (in order to show the user that we are not just here, but even working) and after processing it, we proceed to restore the debugged application.
Consequences of installing BP:
By installing BP, we have lost some of the executable code.
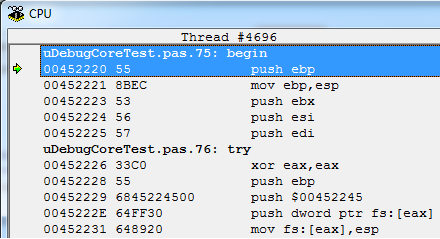
For example, the initial code was as follows:
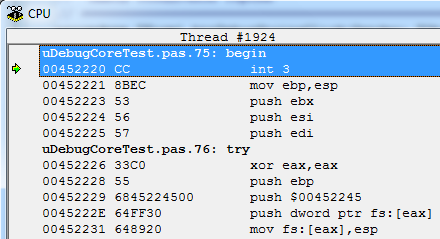
After our manipulations, it turned into the following:
The first step is to restore the meaning of the original instruction.
To make this more convenient, the TBreakpoint structure has an Active parameter that indicates the state of the breakpoint. Focusing on this parameter, the TFWDebugerCore class knows about their activity, and to switch the state, it implements the ToggleInt3Breakpoint method, in which, depending on the flag, turns BP on and off, returning the erased byte to its place.
The implementation is almost similar to the code setting the BP except that when reinstalling the BP it is not necessary to read the byte value again (since we already know it).
Now the caveat: if we run the debugged application right now, we get an error. And all because the “INT3” instruction has already been executed, and even if we returned the byte we had worn to the place at 0x452220, the debugged program will continue execution from the address 0x452221, where the “mov ebp, esp” instruction is located, and not from where it was a debug exception has been thrown.
The second nuance: you can, of course, dream in this direction: “Well, think about it -“ push ebp ”failed, well, the stack floated away, but we are a debugger and if something can come and fix everything ©". So that's basically correct, except for one point.
Yes, it is in this case that we, as a debugger, can correctly move the stack header and not pay attention to unfulfilled instructions, but there is such a trick that is often used as an anti-debugging (more precisely aimed at obfuscating the disassembler, the debugger will not even notice it) as a jump into middle of the instructions.
What it is:
This technique is based on the fact that the disassembler cannot always correctly interpret machine code, especially if it is written specifically to confuse disasma.
As an example, a fairly small number of developers know such a thing as “long NOP”. Moreover, a year and a half or two ago it was not in Intel's manuals, where it was said that NOP (an empty instruction used to align the code) looks only in the form of an 0x90 opcode. Accordingly, most disassemblers can only work with this opcode. Yes, however, why the majority - I have not yet met a disassembler that correctly recognizes long feet.
Since the disassembler cannot recognize it normally, we can do the following trick:
For example, take a three-byte NOP (opcode $ 0F, $ 1F, $ 00) and write this code:
And here is what the disassembler will show us: The
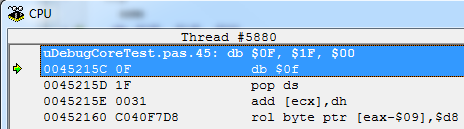
opcodes of all instructions are correct and they will be executed correctly, but the disassembler shows us absolutely not what we wrote initially.
Well, or the second example, already directly using the jump. Here the idea lies in the fact that before the start of the next instruction, the absolutely left byte is written, before which the instruction code “jmp +1” is written, forcing the program to skip this garbage byte and go directly to the desired code. It would seem a banal thing - but disassembler is quite confusing.
As an example, we will write the following code:
Now let's see what the disassembler shows us:
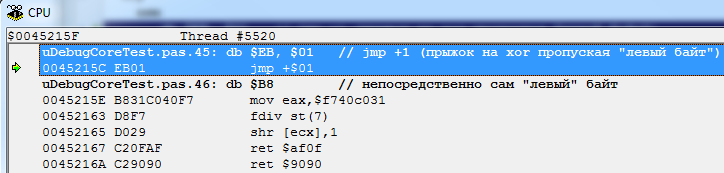
Full garbage, as expected.
So, for what I said all this: let's go back to our BP and imagine that it was installed not at 0x452220, but nine bytes further, just at the beginning of the push $ 00452245 instruction.
This instruction, in contrast to the single-byte "push epb" is presented in the form of five bytes. Even after the recovery of the value of the erased byte occurs, if we continue to execute the code, we will start not from the beginning of the instruction, but from the middle of it, and here it is not the disassembler but the debugger itself that will be mistaken, because for it this code will now look like the following way:
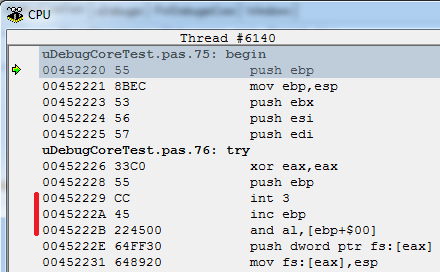
Those. instead of the original “push $ 00452245”, the instructions “inc epb” and “and al, [ebp + $ 00]” will be executed, which were not around here. And after a couple of instructions, we get what was expected - an error.
Therefore, returning the erased byte to its place is not enough; you need to make the debugged application continue the program from the correct address. The address of the instruction to be executed at the next iteration stores the EIP (Extended Instruction Pointer) register. Access to this register is carried out through the thread context of the debugged process in which the interrupt occurred. To change the value of the EIP register, you need to get the context by calling the GetThreadContext function, reduce the current value of the Context.Eip parameter, and then write the new value by calling the SetThreadContext function.
There is a nuance: when the EXCEPTION_DEBUG_EVENT event occurs, we get only the thread ID in the DebugEvent.dwThreadId parameter, and the GetThreadContext () and SetThreadContext () functions require a thread handle for their work, the ID is not interesting to them. You can of course get the required value by calling the OpenThread function, but in this case we don’t have to do this, because we have a saved list of thread handles stored in the form ThreadID = ThreadHandle.
Now we seem to have done everything right, restored the erased byte, set the correct address for the instruction, and we can even run the program for execution, but there is one more BUT. And what to do with the previously installed BP, because after we deleted the 0xCC opcode, the BP record remained only in the debugger lists, but in the debugged application it is not in fact? If we run the program right now, it will execute the current instruction and without stopping will go to the next one, continuing to execute the program code until it runs into some other BP or an error.
So the task appeared, we need to somehow make the application transfer control to the debugger immediately after the execution of the instruction with which we just removed the BP. If we succeed, then we can return BP to its rightful place.
There are many solutions, for example, you can calculate the size of the current instruction and put a new temporary BP at the beginning of the next, but it will have to write a length disassembler, take into account the moment that at the beginning of the next instruction BP can also be set, etc. and indeed this is not the right decision.
And the correct solution in this case is to put the processor in trace mode.
The processor flag is responsible for enabling this mode. If this flag is enabled, each instruction will trigger an “INT1” interrupt, which will throw an exception in the debugged process and the debugger will get control on the EXCEPTION_DEBUG_EVENT event with the exception code EXCEPTION_SINGLE_STEP.
You can enable this flag through the thread context, through which we changed the value of the EIP register. The flags state is controlled by the Context.EFlags parameter. The TF flag is stored in the eighth bit of this parameter. Those. making it easier to enable it, we should do something like this:
Trace Nuance: The peculiarity of the “INT1” interrupt is that it resets the TF flag. Those. if we need to execute only one instruction to restore BP, this behavior suits us perfectly, because we do not need to worry about restoring the TF flag to its original state. But if we are interested in sequential tracing of each instruction, we will have to re-raise the TF flag in each EXCEPTION_SINGLE_STEP handler again. We will consider this mode later.
In summary, the algorithm for installing and processing BP at the code address is as follows:
Now you have a minimal idea of how many actions actually happen when you press the F7 button in the Delphi debugger :)
Well, this is how it is implemented in the TFWDebugerCore class.
EXCEPTION_BREAKPOINT exception handler:
In it, we first look for the BP index in the internal list by the ExceptionAddress parameter.
Raise the external event.
Turn off BP by calling the ToggleInt3Breakpoint method.
Edit EIP and enable tracing by calling the SetSingleStepMode method.
If the user in the external event handler said that he wants to remove this BP, delete it by calling RemoveBreakpoint.
Well, if you just need to continue execution, we remember the index of the current BP for the EXCEPTION_SINGLE_STEP handler, where, focusing on this variable, it will restore the BP in the debugged process.
The code for the SetSingleStepMode method is as follows:
Everything is very simple here, we get the full thread context by setting the CONTEXT_FULL flag.
If necessary, edit the EIP register.
Turn on the TF flag.
And assign a new context.
The RemoveBreakpoint method is even simpler:
Here, BP just turns off and then the BP data is removed from the debugger list.
I will not give the code of the exception handler EXCEPTION_SINGLE_STEP, because It is not only used to restore BP. I will show it at the very end of the article, when all the nuances will be considered.
The next type of BP is used to control data changes in the memory of the debugged application. Better known as Memory Breakpoint (hereinafter MBP).
It is implemented as follows: the entire application memory is represented as a set of pages that can be listed and get their attributes. (see demo application: Process memory card ). When we want to put MBP on any address, we need to calculate the borders of the page to which this address belongs and set the PAGE_GUARD flag to it by calling the VirtualProtectEx function.
Nuance: you can certainly not calculate the page address, but simply call VirtualProtectEx at the required address, but the peculiarity of page addressing is that you can not change the protection of a small section of the page leaving all other addresses unchanged. Security attributes are always assigned entirely to a page. Therefore, if we go to track the change in just one byte, when accessing the bytes adjacent to it, the debugger will also receive notifications.
The second nuance: most debuggers do not allow you to install two or more MBPs located within the same page at the same time. This behavior is most likely due to the following point: when installing MBP, you need to remember the current state of the Protect field of the page in order to return it when the time comes to remove MBP. In the event that MBP is already set on the page, its protection attributes are changed. To get around this point, the following approach is used in the TFWDebugerCore class. When installing a new MBP, it is first checked if there is another MBP that controls this page. If one is found, it takes the value of the PreviosRegionProtect parameter; if there is no MDR, this value is obtained by calling VirtualProtectEx.
The MVR installation code looks like this:
For MBP, you need to store much more parameters, unlike BP. In addition to the address of the controlled area and its size, the parameter configuring the MBP itself is stored - BreakOnWrite, which is responsible for the conditions for triggering an external event (when reading data from the controlled area or when writing to it). The address of the beginning of the page and its size are also stored.
After installing the MVR, you can run the program for execution. As soon as access to the monitored page occurs, the EXCEPTION_DEBUG_EVENT event will be generated with the EXCEPTION_GUARD_PAGE exception code.
There is also a nuance here. When we set the PAGE_GUARD flag on the page, the first time it is accessed, an exception is raised and this flag is removed. That is, unlike BP, we do not need to deal with the disconnection of the MVR on our own. But there is a small problem. As I said earlier, the EXCEPTION_GUARD_PAGE exception will occur whenever the page is accessed, not only the address at which the MDR is set, so the debugger must be able to restore the PAGE_GUARD flag so that the established MVR continues to work correctly.
The handler code looks like this:
Initially, the debugger receives the address to which the call occurred due to which an exception occurred. This address is stored in the ExceptionRecord.ExceptionInformation array as the second parameter, the operation flag is the first parameter in this array. Zero means an attempt to read at an address, one means an attempt to read at an address.
Next, we search for a suitable MVR by calling CheckIsAddrInRealMemoryBPRegion which checks whether the address is in the zone controlled by the MVR.
If a suitable one is found, the BreakOnWrite parameter is checked.
The value of this parameter is compared with the value of the first parameter ExceptionInformation. If BreakOnWrite is enabled, then an external event call occurs only if the unit is in the ExceptionInformation, otherwise, if BreakOnWrite is disabled, the event call always occurs.
After all checks, the code is implemented by analogy with BP processing, the only difference from BP processing is that in this case we do not need to edit the value of the EIP register. To do this, False is passed to the SetSingleStepMode method as the second parameter.
By analogy, the recovery of the captured MVP occurs in the EXCEPTION_SINGLE_STEP handler based on the FRestoreMBPIndex index.
The following code is responsible for switching the activity of the MBP:
Removing the MVR is done by the same method as the BP.
In principle, there are no major cardinal differences, with the exception of a couple of nuances, in BP and the MVR. They just apply each for their tasks.
For example, sometimes MBP is used as a tracer. To implement this feature, the ICBM is simply set in the code area and after launching the debugger, we begin to receive a notification about the change in the current EIP in the remote application. A reasonably convenient thing, a pity is not feasible in the Delphi debugger.
I will show an example of such use at the end of the article. Now let's move on to the third and last type of breakpoints.
The so-called Hardware BreakPoint (hereinafter HBP). Powerful debugging tool. Unlike BP and MVR, these breakpoints do not make modifications in the memory of the debugged application. The only bad thing is that there are very few of them, only four pieces for each thread.
But unlike other HBPs, it provides fairly flexible conditions for controlling the debugged application.
Compare:
BP - only tracks access to the executable code (say Execution mode);
MVR - allows you to track access in the Read or Read / Write mode.
HBP - allows you to set the condition more precisely, it distinguishes between the modes of Write, Read / Write, IO mode (access to the input / output port) and the Execution mode.
Those. HBP can emulate the operation of both BP (in Execution mode) and MBP (in Record - Read / Write modes). True, unlike MVR, it cannot control a large range of the memory area, because can only work with blocks of fixed size 1, 2 or 4 bytes.
HBP settings are stored in the context of each thread, for this DR registers are used, which are accessed when the CONTEXT_DEBUG_REGISTERS flag is specified.
There are six of them. Dr0..Dr3, Dr6, Dr7. (Dr4 and Dr5 are reserved).
The first 4 registers store the address of each of the HBP. Register Dr7 is used to fine-tune the parameters of each of the HBP. Register Dr6 serves to read the results after the operation of any of the four HBP.
The TFWDebugerCore class stores information about HBP in the form of the following structure:
Since all 4 HBPs for each particular thread have their own, they are not stored in the general list of BP classes.
Remember at the beginning I said that we will store data about threads in a separate list in the form of a pair ID = hThreadHandle. In fact, this list is as follows:
Those. In addition to these two parameters, each thread has its own structure that describes the settings of the HBP belonging to it.
Work with the installation, change of state and removal of HBP is extremely simple.
The installation looks like this:
We simply initialize the structure and call the UpdateHardwareBreakpoints method.
The state modification is implemented by the following code:
Just change the Active flag and again call UpdateHardwareBreakpoints.
Well, the removal:
We reset the HBP address and call UpdateHardwareBreakpoints again.
The whole nuance lies precisely in the UpdateHardwareBreakpoints method.
Its main task is to fill in the Dr0-Dr3 registers with addresses of active HBPs and carry out the correct initialization of the Dr7 register.
Here it is necessary to tinker with it.
This register is a set of bit flags that determine the settings of each of the HBP and formally everything looks as follows:
The oldest 4 bits (31-28) store the settings of the Dr3 register.
It looks like this: The
upper 2 bits (LENi) of the four are responsible for the size of the monitored HBP memory.
00 - 1 byte
01 - 2 bytes
10 - this combination of bits is not used.
11 - 4 bytes
The lower 2 bits (RWi) of 4 are responsible for setting the operating mode of HBP
00 - Execute
01 - Write
10 - IO Read / Write
11 - Read / Write
Thus, if we want the HBP from the Dr3 register to respond to writing to any 4 bytes starting from the value specified in Dr3, the high 4 bits of the Dr7 register should look like 1101.
The next 4 bits (27-24) are used to configure the HBP of the Dr2 register.
Bits 23-20 refer to Dr1 and, finally, bits 19-16 to the register Dr0 .
Bit 13 of the Dr7 register (GD - Global Debug Register Access Detect) - is responsible for the integrity of the data in the debug registers. For example, if the program being debugged suddenly decided to store its values in these registers, the debugger will be notified about this.
Bit 9 of the Dr7 register (GE - Global Exact data breakpoint match) - includes work with global HBP.
Bit 8 of the Dr7 register (LE - Local Exact data breakpoint match) - enables work with local HBP.
LE bit is reset when switching tasks, more details can be found in the Intel manuals.
There are 8 bits left (7-0) represented as a pair of Gi and Li flags for each of the registers including HBP in global or local mode.
Bit 7 (Gi - Global breakpoint enable) - enables the global mode to the Dr3 register;
Bit 6 (Li - Local breakpoint enable) - enables the local mode to the Dr3 register 5-4; is
the same for Dr2
3-2 for Dr1 and 1-0 for Dr0
Confused?
Well then here is the picture:
In the form of source code, everything looks quite simple.
If you do not pay attention to the block of constants preceding the code, then the initialization of the Dr7 register is implemented with only three lines.
Well, apart from the inclusion of the LE bit represented by the constant DR7_SET_LOC_ON.
Now we turn to the processing of HBP.
When BP triggered, we received the code EXCEPTION_BREAKPOINT.
When the MVR was triggered, the code was EXCEPTION_GUARD_PAGE.
And upon interruption on HBP, we will generate an EXCEPTION_DEBUG_EVENT event with the code EXCEPTION_SINGLE_STEP, which, among other things, is used to restore the state of BP and MBP (therefore, I did not cite its implementation at the beginning of the article).
When EXCEPTION_SINGLE_STEP is received, the HBP handler implemented as the first one is called as follows:
Its task is to determine which particular HBP caused the interruption, trigger an external event and execute a finalization algorithm approximately similar to those already shown in the BP and MVR handlers.
To determine the HBP number, it is necessary to read the value of the Dr6 register from the thread context.
The lower 4 bits of this register are flags that take the value 1 if the corresponding DrX register has worked.
Everything is quite simple, after determining the necessary NVR, we call an external event, turn off the NVR, put the processor in trace mode (without editing EIP), then either delete the NVR or store its index in two variables, guided by which the EXCEPTION_SINGLE_STEP handler will restore the state of the NVR.
Well, it seems that we have come to a logical conclusion.
It remains only to show the implementation of the EXCEPTION_SINGLE_STEP handler itself.
It looks like this:
His task is to initially determine whether an exception has been generated due to a stop at HBP. If this is true, then by calling ToggleHardwareBreakpoint the HBP returns to its place.
If the exception was raised because the trace flag was turned on after BP or MVP processing, the variables FRestoreBPIndex and FRestoreMBPIndex will indicate the index of the breakpoint that needs to be returned to its place.
Depending on its type, calls are made to the ToggleInt3Breakpoint or ToggleMemoryBreakpoint methods.
I will finish this with a description of the debugger implementation, but take your time - there are a few more points that I would like to show in practice.
Well, as in that joke about the plane: “now we’ll try to lift this whole canoe into the air” :)
For this, we need to implement two applications.
First, we will try to debug it. Create a new VCL project, save it with the name “test_app”, and then compile the project.
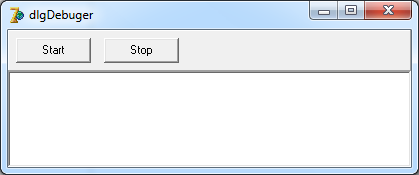
Now we will write a debugger application. For this, we will have enough form, two buttons (to start and stop the debugging process) and TMemo or TRichEdit, where all the information will be displayed.
We write:
You should get something like this:
Click the "Start" button, if everything is done correctly, the test application will start.
In this case, the main application will cease to practically respond to mouse and keyboard commands.
The fact is that after starting it is located inside the TFWDebugerCore.RunMainLoop debugging cycle, which prevents the message queue fetching cycle from executing.
Close the test application, this will allow the debugger to exit the debugging cycle and give the opportunity to work with the window.
In a good way, the debugger needs to be run in a separate thread (more precisely, not in a good way - and this is the right approach), but even without it, we can work with it in the normal way by closing the OnIdle event of the TFWDebugerCore class, in which we write the following code:
Calling Application.ProcessMessages will not let our application slow down in the process.
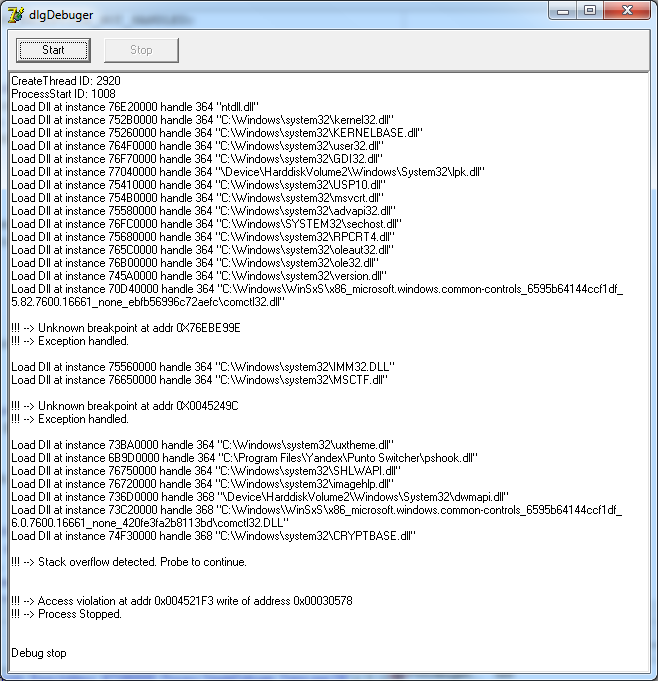
Now let's try to get debugging information about the process in the form that the Delphi debugger displays. To do this, connect the OnCreateProcess and OnLoadDll handlers.
In the first we write the following:
In the second, this code:
After that, we will start the debugging application again and press the “Start” button.
The following should work:
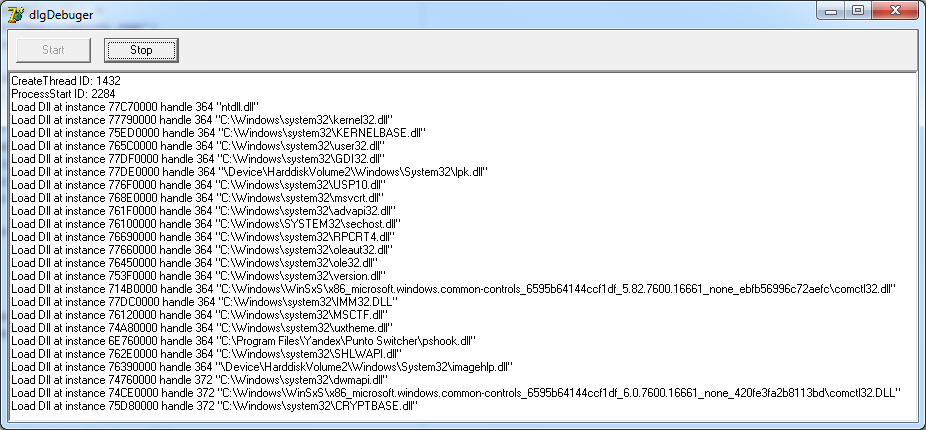
Well, it seems - it seems.
Now let's try to work with the debugger. To begin, consider two trace options, the first through the TF flag, the second through MBP. We will trace the first 40 bytes from the program entry point. Let's immediately see how they look:
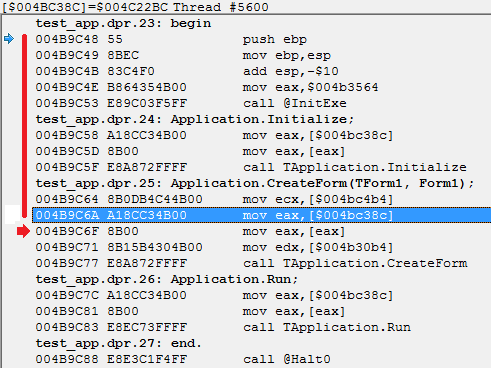
In order to start tracing for good, you need to wait for the process to initialize, after which you can safely set BP / MVR and so on. To do this, you must tell the debugger to install BP on the application entry point. The second parameter of the DebugNewProcess function is responsible for this. We have it already set to True, and it remains only to process this BP. To do this, connect the OnBreakPoint handler in which we set the trace mode.
Since tracing occurs through the generation of the OnSingleStep event, we also implement it:
The result will be the following conclusion:
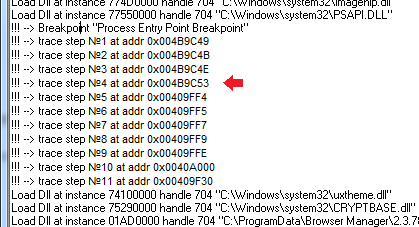
We did a StepIn trace, this clearly shows us the fifth trace step that occurred at 0x00409FF4, this is the beginning of the _InitExe () function, which is called at 0x00409C53. Tracing is a rather slow process and I did not wait for control to return from the _InitExe () function, for demonstration I limited myself to a dozen steps.
The second trace mode is the installation of the MVR.
In order to demonstrate it, it is necessary to block the OnPageGuard event and, upon reaching the entry point, call the SetMemoryBreakpoint method with a controlled memory range of zero. In this case, the debugger will know about the page being monitored by the MBP, but the OnBreakPoint handler for this MBP will not be called. The implementation of this tracing option is left to your discretion, I’ll just give you a hint, it is highly recommended not to call the RemoveBreakpoint method from the debug event handlers (indexes will disappear), there are two standard methods for removing BP / MBP / HBP in this debugger implementation, the ReleaseBreakpoint parameter when the BP handler is called , or the RemoveCurrentBreakpoint procedure available in any of the handlers. Probably in the following implementations of the TFWDebugerCore class this behavior will be revised,
Tracing, of course, is good, but I didn’t want to talk about it in the practical part of the article, so there are no tracing examples in the demo that goes with the article.
Receiving a debug string:
To start, I wanted to show the receipt of strings that the application sends to the debugger using the OutputDebugString function. To do this, place the button in the test application and, for example, write the following code in its handler:
Then, in the debugger, close the OnDebugString event by implementing the following code in it:
Run the debugger, in it the debugged application and click on the button. The message "Test debug string" is displayed in the log? If yes, then everything was done correctly :)
Exception handling:
Remember, I talked about using BP as an anti-debugging application? Now let's try to consider about the same option. In the test application, add another button and write the following code in it:
This, in principle, is not even anti-debugging, but strangely enough sometimes some reversers are scorching even on such a primitive scheme.
The essence of this method is as follows: at the beginning of the article I gave an example of a debugging cycle, in it, at each iteration, the ContinueStatus parameter, with which the ContinueDebugEvent function is called, was initialized with the DBG_CONTINUE constant. What does this mean? This is a signal that our debugger has successfully processed the exception that has arisen and is not worth fiddling with it further.
Well, now what does this mean with the example of the above code: by invoking the “INT3” instruction, we raise an exception. During normal operation of the application, there is no one to handle this exception, so when it occurs, a transition to the exception..end handler takes place, in which we say that everything is fine. If we are under the debugger, then he will catch this exception and the application handler will not be called.
You can check, launch the application and click the button with this code, it will honestly say - we are under the debugger.
It is just as easy to overcome this code, it is enough to block the OnUnknownBreakPoint event (int3 is a breakpoint, and it was not set by us, therefore, it will be caught in this event). In the event handler, write the following code:
Everything is simple in it, based on the address at which BP is installed, we determine its location in the application body or not (roughly taking the range from the application download address to $ 500,000). If BP is installed in the body of the application, then this is some kind of anti-debugging. We tell the debugger that we don’t know what to do with it by setting the DBG_EXCEPTION_NOT_HANDLED flag, otherwise, we simply log the information that someone else is playing with breakpoints.
As a result of such gestures, the exception artificially raised by the application will not be processed and it will happily inform us that it did not detect the debugger :)
What happens when the stack overflows:
Well, the last thing I wanted to show you is how the stack overflow looks from the side of the debugger. I’ll take an example of overflow from one of the previous articles, for example, like this:
Add this code to the test application and click the button. The response of the debugger may be different, but the result will always be the same - the debugger will become very bad. What happens in this case? The mechanism for detecting stack overflows is quite simple, the border that cannot be crossed is represented by a separate page marked with the PAGE_GUARD flag. Well, yes, this is the same mechanism by which we set up our MVR, but in this case it is used for other purposes. When overflowing, the EXCEPTION_STACK_OVERFLOW will initially receive a notification to the debugger. In principle, right here you can “dry the oars” and shut down the debugger, but we are persistent and will start the test application further. If you remember, the nuance of the PAGE_GUARD flag is that it is removed after the first call, here is the same case.
We implement the overflow handler in the OnUnknownException event, because TFWDebugerCore does not throw these two exceptions as separate events. We will write the following in it:
It should turn out like this:
Basically, this is all I wanted to tell about the debugger implementation. There are a few unrevealed topics, but they will be in the third part.
I regret that the article turned out to be very voluminous, but, alas, it did not work out to break it into smaller parts. At least I tried to give not dry facts, but to pay maximum attention to the nuances that are usually omitted in technical articles.
I hope there will be people who find this material useful :)
The source code for the article can be downloaded at this link: http://rouse.drkb.ru/blog/dbg_part2.zip
Well, in the third part of the article we will look at the debugger’s opposition to the application, which really doesn’t want to be debugged :)
And on this I really have everything.
© Alexander (Rouse_) Bagel
Moscow, November 2012
If you are already familiar with the work of the debugger - it's okay, it is likely that some aspects of its work mentioned in the article will be of interest to you.
If you have never before encountered an independent implementation of the debugger, but are interested in it, then at least you should start with this link: Debugging and Error Handling. Using
it you can learn about the main aspects of debugging, such as the structured handling of exceptions, working with debugging information, minidumps. Working with the image of the executable file, headers, sections, a process memory card, what is RVA and VA, and so on and so forth.
But this is only if you want to understand all this kitchen.
I’ll try to describe only part of it in a simpler language, so that you have a point from which you could push off, if you suddenly become interested, and of course, if you are implementing application protection, you need to understand at least the intricacies of the debugger (otherwise how else?).
There will be a lot of code in the text of the article, but I will not consider all the parameters of each of the structures when debugging events occur, for this there is MSDN. I will dwell only on the debugger necessary for the work and try to reveal some of the nuances that you most likely will encounter when you independently implement the debugging engine.
From you, it is desirable to have at least minimal knowledge of assembler, because alas, this article can’t do without it.
Let's start by attaching the debugger to the process:
Before connecting to a process, the very first step is to obtain debugging privileges. This is done with such simple code:
function SetDebugPriv: Boolean;
var
  Token: THandle;
  tkp: TTokenPrivileges;
begin
  Result := false;
  if OpenProcessToken(GetCurrentProcess,
    TOKEN_ADJUST_PRIVILEGES or TOKEN_QUERY, Token) then
  begin
    if LookupPrivilegeValue(nil, PChar('SeDebugPrivilege'),
      tkp.Privileges[0].Luid) then
    begin
      tkp.PrivilegeCount := 1;
      tkp.Privileges[0].Attributes := SE_PRIVILEGE_ENABLED;
      Result := AdjustTokenPrivileges(Token, False,
        tkp, 0, PTokenPrivileges(nil)^, PDWord(nil)^);
    end;
  end;
end;
The next step is determined: will we join the already running process, or will we start a new process from scratch.
If the process is already running and we wanted to join it, then we only need to find out the PID of the process and execute the following code:
function TFWDebugerCore.AttachToProcess(ProcessID: DWORD;
  SentEntryPointBreakPoint: Boolean): Boolean;
begin
  Result := False;
  if FProcessInfo.ProcessID <> 0 then Exit;
  FSetEntryPointBreakPoint := SentEntryPointBreakPoint;
  FProcessInfo.ProcessID := ProcessID;
  Result := DebugActiveProcess(ProcessID);
end;
True, this code does not always execute successfully for at least two reasons.
The fact is that on Windows it is impossible to connect to the process with two debuggers at the same time, and if a debugger is already attached to the process we need, then the call to the DebugActiveProcess function will not be successful, and GetLastError will return an error code to us: ERROR_INVALID_PARAMETER.
The second reason may be that the process we need is started with higher privileges than the debugger. In this case, the call to the DebugActiveProcess function will also fail, and GetLastError will return an error code: ERROR_ACCESS_DENIED.
In the second case, you can work around this error by running the debugger with the required privileges.
The second option is to attach the debugger to the process, by starting the process with this code:
function TFWDebugerCore.DebugNewProcess(const FilePath: string;
  SentEntryPointBreakPoint: Boolean): Boolean;
var
  PI: TProcessInformation;
  SI: TStartupInfo;
begin
  Result := False;
  if FProcessInfo.ProcessID <> 0 then Exit;
  FSetEntryPointBreakPoint := SentEntryPointBreakPoint;
  ZeroMemory(@SI, SizeOf(TStartupInfo));
  SI.cb := SizeOf(TStartupInfo);
  Result := CreateProcess(PChar(FilePath),
    nil, nil, nil, False, DEBUG_PROCESS or DEBUG_ONLY_THIS_PROCESS,
    nil, nil, SI, PI);
  if Result then
  begin
    FProcessInfo.ProcessID := PI.dwProcessId;
    FProcessInfo.CreatedProcessHandle := PI.hProcess;
    FProcessInfo.CreatedThreadHandle := PI.hThread;
  end;
end;
Everything is simple here, in the above code we started the process with the DEBUG_PROCESS flag and additionally specified the DEBUG_ONLY_THIS_PROCESS flag, indicating that we will not debug the processes created by the debugged one.
After starting the process, remember its parameters (useful).
As soon as we joined the process as a debugger, this process stops working on its own and will wait for our team for each of its movements - what should it do next. To do this, he will generate debugging events and wait until we react to them.
We can get the debugging event from the debugged process by calling the WaitForDebugEvent function, after which we can perform any necessary actions and return control to it by calling the ContinueDebugEvent function, after which again we must wait for the next event.
Those. roughly, we have to implement a Debug Event Loop.
MSND recommends the following implementation of Debug Event Loop.
Writing the Debugger's Main Loop
We will implement approximately the same in our debugger.
procedure TFWDebugerCore.RunMainLoop;
var
  DebugEvent: TDebugEvent;
  CallNextLoopIteration: Boolean;
  ThreadIndex: Integer;
begin
  CallNextLoopIteration := False;
  repeat
    ContinueStatus := DBG_CONTINUE;
    if not WaitForDebugEvent(DebugEvent, MainLoopWaitPeriod) then
    begin
      if GetLastError = ERROR_SEM_TIMEOUT then
      begin
        DoIdle;
        if FProcessInfo.ProcessID = 0 then Exit;
        CallNextLoopIteration := True;
        Continue;
      end
      else
      begin
        DoMainLoopFailed;
        Break;
      end;
    end;
    case DebugEvent.dwDebugEventCode of
      CREATE_THREAD_DEBUG_EVENT:
        DoCreateThread(DebugEvent);
      CREATE_PROCESS_DEBUG_EVENT:
        DoCreateProcess(DebugEvent);
      EXIT_THREAD_DEBUG_EVENT:
        DoExitThread(DebugEvent);
      EXIT_PROCESS_DEBUG_EVENT:
      begin
        DoExitProcess(DebugEvent);
        Break;
      end;
      LOAD_DLL_DEBUG_EVENT:
        DoLoadDll(DebugEvent);
      UNLOAD_DLL_DEBUG_EVENT:
        DoUnLoadDll(DebugEvent);
      OUTPUT_DEBUG_STRING_EVENT:
        DoDebugString(DebugEvent);
      RIP_EVENT:
        DoRip(DebugEvent);
      EXCEPTION_DEBUG_EVENT:
      begin
        ThreadIndex := GetThreadIndex(DebugEvent.dwThreadId);
        case DebugEvent.Exception.ExceptionRecord.ExceptionCode of
          EXCEPTION_BREAKPOINT:
            ProcessExceptionBreakPoint(ThreadIndex, DebugEvent);
          EXCEPTION_SINGLE_STEP:
            ProcessExceptionSingleStep(ThreadIndex, DebugEvent);
          EXCEPTION_GUARD_PAGE:
            ProcessExceptionGuardPage(ThreadIndex, DebugEvent);
        else
          CallUnhandledExceptionEvents(ThreadIndex, CodeDataToExceptionCode(
            DebugEvent.Exception.ExceptionRecord.ExceptionCode), DebugEvent);
        end;
      end;
    end;
    CallNextLoopIteration := ContinueDebugEvent(DebugEvent.dwProcessId,
      DebugEvent.dwThreadId, ContinueStatus);
  until not CallNextLoopIteration;
end;
In the process of debugging, we will constantly be inside this cycle and process the events known to us. The WaitForDebugEvent function at each iteration of the debug loop returns a DEBUG_EVENT structure. Based on the dwDebugEventCode parameter of this structure, we can identify the type of the received event, the process ID and thread in which the event occurred, as well as the parameters of each event, presented in the form of union by the last field of this structure:
PDebugEvent = ^TDebugEvent;
_DEBUG_EVENT = record
  dwDebugEventCode: DWORD;
  dwProcessId: DWORD;
  dwThreadId: DWORD;
  case Integer of
    0: (Exception: TExceptionDebugInfo);
    1: (CreateThread: TCreateThreadDebugInfo);
    2: (CreateProcessInfo: TCreateProcessDebugInfo);
    3: (ExitThread: TExitThreadDebugInfo);
    4: (ExitProcess: TExitProcessDebugInfo);
    5: (LoadDll: TLoadDLLDebugInfo);
    6: (UnloadDll: TUnloadDLLDebugInfo);
    7: (DebugString: TOutputDebugStringInfo);
    8: (RipInfo: TRIPInfo);
end;
{$EXTERNALSYM _DEBUG_EVENT}
TDebugEvent = _DEBUG_EVENT;
DEBUG_EVENT = _DEBUG_EVENT;
{$EXTERNALSYM DEBUG_EVENT}
Each event has its own set of parameters, but we will dwell on them a bit later.
If any of the events is not processed by our code, we simply continue to run the debugged process by calling the ContinueDebugEvent function by setting the ContinueStatus parameter to DBG_CONTINUE.
Nuance: if WaitForDebugEvent returned an error (for example, by timeout), you should not call ContinueDebugEvent, it will also return an error. At this point, they often stumble, do not forget to take it into account in your own debugger implementation.
So far, everything is quite simple, now let's see what events give us.
CREATE_PROCESS_DEBUG_EVENT:
The very first event that the debugger will receive when debugging starts. It doesn’t matter if we started the process ourselves, or joined it by calling DebugActiveProcess, we will start working with it. The parameters for this event are stored in the DebugEvent.CreateProcessInfo structure (CREATE_PROCESS_DEBUG_INFO structure).
In general, the handler for this event looks like this:
procedure TFWDebugerCore.DoCreateProcess(DebugEvent: TDebugEvent);
begin
  // Сохраняем данные о процессе
  FProcessInfo.AttachedFileHandle := DebugEvent.CreateProcessInfo.hFile;
  FProcessInfo.AttachedProcessHandle := DebugEvent.CreateProcessInfo.hProcess;
  FProcessInfo.AttachedThreadHandle := DebugEvent.CreateProcessInfo.hThread;
  FProcessInfo.EntryPoint := DWORD(DebugEvent.CreateProcessInfo.lpStartAddress);
  AddThread(DebugEvent.dwThreadId, FProcessInfo.AttachedThreadHandle);
  // Устанавливаем BreakPoint на точку входа процесса
  if FSetEntryPointBreakPoint then
    SetBreakpoint(FProcessInfo.EntryPoint, 'Process Entry Point Breakpoint');
  if Assigned(FCreateProcess) then
  begin
    FCreateProcess(Self, GetThreadIndex(DebugEvent.dwThreadId),
      DebugEvent.CreateProcessInfo);
    DoResumeAction(GetThreadIndex(DebugEvent.dwThreadId));
  end;
end;
In it, we simply remember the process parameters, and also add the ID and handle of the main thread of the process to the internal list. These data will be useful to us later.
Here we can also determine the process entry point (Entry Point), its value is recorded in the DebugEvent.CreateProcessInfo.lpStartAddres parameter and, if desired, set a breakpoint (hereinafter referred to as BP) at its address and start the process to execute. If you are a little coarse, then by performing this action we will simulate the behavior of the Delphi debugger when you press the F7 button.
What is the entry point: when the loader creates the process, until the moment when it starts, a lot of preparatory actions are performed. Creating the main thread of the application, setting up stacks, process environment / thread blocks, loading libraries, executing their TLS callbacks, etc. Only after all this is completed, does the loader transfer control directly to the entry point, from where the code implemented by the programmer is already starting. The address of this point is stored directly in the header of the PE file, from where it can be obtained by any application displaying the structure of the PE file, for example PEiD or PeExplorer, or you can read this value yourself by reading out the TImageDosHeader structure located at the very beginning of the file, its _lfanew field will be offset to start of TImageNtHeaders,
Try to compile an empty project, and press F7 in it, and then go to the CPU-View tab, it should look something like this: The
address of the entry point turned out: 0x0043E2D4. Now let's see what PEiD tells us about the resulting application:
He says that the entry point value is 0x0003E2D4.
Although it does not coincide with the number that we saw in the debugger, nevertheless, everything is correct here, since the value stored in the AddressOfEntryPoint parameter is represented as RVA (Relative Virtual Address). The peculiarity of this addressing is that it does not take into account the load address of our module (hInstance). In order to get VA (Virtual Address) from the RVA address, you need to add the hInstance module to it.
There is a caveat: this is true only for applications, for libraries it works a little differently. For them, you have to focus on the addresses of the sections. More details can be found in this demo: “Implementing the file properties bookmark” .
In it, in the DebugHlp.pas module, an implementation of the ImageRvaToVa () function is given, by which you can clearly study the rules for casting addresses.
Well, for the application, the base load address is always equal to the value specified by us in the linker settings in the Image Base parameter, which by default is 0x00400000. Adding these two numbers, we just get the required 0x0043E2D4.
LOAD_DLL_DEBUG_EVENT:
Immediately after CREATE_PROCESS_DEBUG_EVENT, we will begin to receive library loading events, with parameters in the DebugEvent.LoadDll structure (LOAD_DLL_DEBUG_INFO structure).
In the general case, we can observe the loading of libraries in the Delphi debugger, which displays notifications of loading in the event log:
When this event is received, Delphi, the debugger, if BP is installed to load the module, is interrupted immediately after it is loaded.
We can also notify the user about loading a module with this code:
procedure TFWDebugerCore.DoLoadDll(DebugEvent: TDebugEvent);
begin
  if Assigned(FLoadDll) then
  begin
    FLoadDll(Self, GetThreadIndex(DebugEvent.dwThreadId),
      DebugEvent.LoadDll);
    DoResumeAction;
  end;
  CloseHandle(DebugEvent.LoadDll.hFile);
end;
In which, in addition to raising the event, we immediately close the handle of the loaded library, we will no longer need it (in this version of the debugger implementation).
The nuance is this: the address with the path to the loaded library, stored in the DebugEvent.LoadDll.lpImageName parameter, is not located in our address space, so we will have to read it through ReadProcessMemory.
The second nuance: this value is also a pointer to a buffer along which data about the path are located, i.e. have to read at least twice.
The third caveat: the path can be both in Ansii and in Unicode encoding.
Well, for a snack, the fourth caveat: we may not read the data :)
To get a valid path to the loadable library, the TFWDebugerCore class provides the GetDllName method that takes into account all these points.
Consider the implementation.
The TFWDebugerCore class will notify us of loading the library by calling the external OnLoadDll event, where we will write the following code:
procedure TdlgDebuger.OnLoadDll(Sender: TObject; ThreadIndex: Integer;
  Data: TLoadDLLDebugInfo);
const
  FormatStrKnownDLL = 'Load Dll at instance %p handle %d "%s"';
  FormatStrUnknownDLL = 'Load unknown Dll at instance %p handle %d';
var
  DllName: AnsiString;
  IsUnicodeData: Boolean;
begin
  FCore.ContinueStatus := DBG_EXCEPTION_NOT_HANDLED;
  IsUnicodeData := Data.fUnicode = 1;
  DllName := FCore.GetDllName(Data.lpImageName, Data.lpBaseOfDll, IsUnicodeData);
  if DllName <> '' then
  begin
    if IsUnicodeData then
      Writeln(Format(FormatStrKnownDLL, [Data.lpBaseOfDll,
        Data.hFile, PWideChar(@DllName[1])]))
    else
      Writeln(Format(FormatStrKnownDLL, [Data.lpBaseOfDll,
        Data.hFile, PAnsiChar(@DllName[1])]));
  end
  else
    Writeln(Format(FormatStrUnknownDLL, [Data.lpBaseOfDll, Data.hFile]));
end;
Here, we call the TFWDebugerCore.GetDllName () method and (focusing on the fUnicode parameter) print the data to the console.
The implementation of the GetDllName method is as follows:
function TFWDebugerCore.ReadData(AddrPrt, ResultPtr: Pointer; DataSize: Integer): Boolean;
var
  Dummy: DWORD;
begin
  Result := ReadProcessMemory(FProcessInfo.AttachedProcessHandle,
    AddrPrt, ResultPtr, DataSize, Dummy) and (Integer(Dummy) = DataSize);
end;
function TFWDebugerCore.ReadStringA(AddrPrt: Pointer;
  DataSize: Integer): AnsiString;
begin
  SetLength(Result, DataSize);
  if not ReadData(AddrPrt, @Result[1], DataSize) then
    Result := '';
end;
  function GetMappedFileNameA(hProcess: THandle; lpv: Pointer;
    lpFilename: LPSTR; nSize: DWORD): DWORD; stdcall; external 'psapi.dll';
function TFWDebugerCore.GetDllName(lpImageName, lpBaseOfDll: Pointer;
  var Unicode: Boolean): AnsiString;
var
  DllNameAddr: Pointer;
  MappedName: array [0..MAX_PATH - 1] of AnsiChar;
begin
  if ReadData(lpImageName, @DllNameAddr, 4) then
    Result := ReadStringA(DllNameAddr, MAX_PATH);
  if Result = '' then
  begin
    if GetMappedFileNameA(FProcessInfo.AttachedProcessHandle,
      lpBaseOfDll, @MappedName[0], MAX_PATH) > 0 then
    begin
      Result := PAnsiChar(@MappedName[0]);
      Unicode := False;
    end;
  end;
end;
That is, first we try to get the library path by reading data from the address space of the debugged process (ReadData + ReadStringA), and if it doesn’t work out, we take this data by calling the GetMappedFileNameA function. It returns data using symbolic links, so the good result still needs to be brought to the normal path, but in this case, I did not do this, so as not to over complicate the code.
CREATE_THREAD_DEBUG_EVENT
We will receive this event at the moment when a new thread is created in the debugged application. The parameters for this event are stored in the DebugEvent.CreateThread structure (CREATE_THREAD_DEBUG_INFO structure).
Of all the parameters, we are most interested in DebugEvent.CreateThread.hThread, which it is desirable to save in the internal list.
The nuance is that most events contain data only on the ID of the thread, and when we want to work with it (for example, install Hardware Breakpoint), we will have to make an OpenThread call on the transmitted ID. In order not to bother with these actions, we will keep the ThreadID = ThreadHandle pairs in our own cache.
The handler code for this event is as follows:
procedure TFWDebugerCore.DoCreateThread(DebugEvent: TDebugEvent);
begin
  AddThread(DebugEvent.dwThreadId, DebugEvent.CreateThread.hThread);
  if Assigned(FCreateThread) then
  begin
    FCreateThread(Self, GetThreadIndex(DebugEvent.dwThreadId),
      DebugEvent.CreateThread);
    DoResumeAction;
  end;
end;
In addition to saving the parameters of the thread and calling an external handler, there is nothing in it.
OUTPUT_DEBUG_STRING_EVENT:
The event is generated at the moment when the debugged application is trying to communicate something to the calls to the OutputDebugString function. The parameters for this event are stored in the DebugEvent.DebugString structure (OUTPUT_DEBUG_STRING_INFO structure).
The event handler is simple:
procedure TFWDebugerCore.DoDebugString(DebugEvent: TDebugEvent);
begin
  if Assigned(FDebugString) then
  begin
    FDebugString(Self, GetThreadIndex(DebugEvent.dwThreadId),
      DebugEvent.DebugString);
    DoResumeAction;
  end;
end;
those. we just call the external handler where we need to read the transmitted string according to the same principle as we read the path to the loadable library.
For example, like this:
procedure TdlgDebuger.OnDebugString(Sender: TObject; ThreadIndex: Integer;
  Data: TOutputDebugStringInfo);
begin
  if Data.fUnicode = 1 then
    Writeln('DebugString: ' + PWideChar(FCore.ReadStringW(Data.lpDebugStringData,
      Data.nDebugStringLength)))
  else
    Writeln('DebugString: ' + PAnsiChar(FCore.ReadStringA(Data.lpDebugStringData,
      Data.nDebugStringLength)));
end;
In the handler, we look in what encoding the buffer is passed to us, focusing on the Data.fUnicode parameter and call the corresponding function of the debugger core ReadStringХ ().
UNLOAD_DLL_DEBUG_EVENT, EXIT_THREAD_DEBUG_EVENT, EXIT_PROCESS_DEBUG_EVENT, RIP_EVENT:
Unloading the library, closing the thread, terminating the process, and an error in the kernel of the debugger.
These four events I will skip. There is nothing extraordinary about them. Upon receipt of each of them, external handlers are called and internal lists stored by the debugger are cleaned.
There are no nuances when working with them.
EXCEPTION_DEBUG_EVENT:
All eight of the above events are, in principle, secondary. The main work begins only after the arrival of the EXCEPTION_DEBUG_EVENT event.
Its parameters go to the DebugEvent.Exception structure (EXCEPTION_DEBUG_INFO structure) .
The generation of this event means that a certain exception occurred in the debugged application, the type of which can be found in the DebugEvent.Exception.ExceptionRecord.ExceptionCode parameter. Remember, in the first part of the article I mentioned that debugging is done through the structured error handling (SEH) mechanism? Now we will consider this in more detail.
Most exceptions during the debugging process are pointed. That is, getting an exception does not mean that an error has occurred in the program itself. Most likely, the exception occurred due to the intervention of the debugger in the application, for example, by installing BP.
Nuance: If an error occurs in the application itself, we will also receive it in the form of a debugging exception and we will need to implement the debugger code in such a way that we can distinguish our induced errors from user errors.
Typically, the debugger provides three mechanisms for working with BP (well, if you do not take into account BP to load the module, because in fact this feature is not a classic BP).
- Standard BP per line of code.
- BP to the memory address (Memory Breakpoint or truncated Data Preakpoint in Delphi).
- Hardware BP (not available in Delphi).
To work with them, it is enough to handle three types of exceptions:
EXCEPTION_DEBUG_EVENT:
begin
  ThreadIndex := GetThreadIndex(DebugEvent.dwThreadId);
  case DebugEvent.Exception.ExceptionRecord.ExceptionCode of
    EXCEPTION_BREAKPOINT:
      ProcessExceptionBreakPoint(ThreadIndex, DebugEvent);
    EXCEPTION_SINGLE_STEP:
      ProcessExceptionSingleStep(ThreadIndex, DebugEvent);
    EXCEPTION_GUARD_PAGE:
      ProcessExceptionGuardPage(ThreadIndex, DebugEvent);
  else
    CallUnhandledExceptionEvents(ThreadIndex, CodeDataToExceptionCode(
      DebugEvent.Exception.ExceptionRecord.ExceptionCode), DebugEvent);
  end;
end;
In order to make it more clear why only these three exceptions are enough, you first need to consider the mechanism for setting each type of BP before proceeding with the analysis of the logic for processing the EXCEPTION_DEBUG_EVENT event.
Implementing a breakpoint on a line of code:
Installing BP on a line of code is done by modifying the code of the debugged application. Classically, this is done by writing the 0xCC opcode to the address set by BP, meaning the instruction "INT3".
There are other options, for example, the 0xCD03 opcode, which is also an “INT3” instruction. The second option is more used for anti-debugging and is installed in most cases by the application itself, trying to catch the presence of a debugger on the fact that the nuclear _KiTrap03 () can only work with a single-byte opcode and slightly incorrectly processes a double-byte one.
But, all this is lyrics, we are interested in the first opcode.
To store the list of installed BPs, the TFWDebugerCore class uses the following structures:
// Список поддерживаемых типов точек остановки (далее ВР)
TBreakpointType = (
  btBreakpoint,           // WriteProcessMemoryEx + 0xCC
  btMemoryBreakpoint      // VirtualProtectEx + PAGE_GUARD
);
// структуры для хранения данных об известных отладчику ВР
TInt3Breakpoint = record
  Address: Pointer;
  ByteCode: Byte;
end;
TMemotyBreakPoint = record
  Address: Pointer;
  Size: DWORD;
  BreakOnWrite: Boolean;
  RegionStart: Pointer;
  RegionSize: DWORD;
  PreviosRegionProtect: DWORD;
end;
TBreakpoint = packed record
  bpType: TBreakpointType;
  Description: ShortString;
  Active: Boolean;
  case Integer of
    0: (Int3: TInt3Breakpoint;);
    1: (Memory: TMemotyBreakPoint);
end;
TBreakpointList = array of TBreakpoint;
Before adding a new BP, he initializes the TBreakpoint record, filling it with the necessary parameters, and then adds it to the general list of breakpoints.
For BP on a line of code, we need to store only two values, the address of BP and the value of the byte stored at this address before we erase it with the 0xCC opcode.
Installing BP in a debugged application looks something like this:
function TFWDebugerCore.SetBreakpoint(Address: DWORD;
  const Description: string): Boolean;
var
  Breakpoint: TBreakpoint;
  OldProtect: DWORD;
  Dummy: DWORD;
begin
  ZeroMemory(@Breakpoint, SizeOf(TBreakpoint));
  Breakpoint.bpType := btBreakpoint;
  Breakpoint.Int3.Address := Pointer(Address);
  Breakpoint.Description := Description;
  Check(VirtualProtectEx(FProcessInfo.AttachedProcessHandle,
    Pointer(Address), 1, PAGE_READWRITE, OldProtect));
  try
    Check(ReadProcessMemory(FProcessInfo.AttachedProcessHandle,
      Pointer(Address), @Breakpoint.Int3.ByteCode, 1, Dummy));
    Check(WriteProcessMemory(FProcessInfo.AttachedProcessHandle,
      Pointer(Address), @BPOpcode, 1, Dummy));
  finally
    Check(VirtualProtectEx(FProcessInfo.AttachedProcessHandle,
      Pointer(Address), 1, OldProtect, OldProtect));
  end;
  Result := AddNewBreakPoint(Breakpoint);
end;
Initially, the structure is initialized, the type of BP is set, its description and parameters. Since writing to a code area that usually does not have write permissions, the corresponding rights are set, the original value located at the address BP is read, the 0xCC instruction represented by the BPOpcode constant is written, and the original page attributes are returned by a repeated call to VirtualProtectEx (). At the end of everything, if no errors have occurred, the record of the installed BP is placed in the general list of the class.
Well, now the fun begins:
After installing BP, the debugged application will continue its normal operation until the transition to the INT3 instruction we wrote down occurs. At this point, the EXCEPTION_DEBUG_EVENT event will be raised with the exception code EXCEPTION_BREAKPOINT.
Exception parameters will be passed to us in the form of a DebugEvent.Exception.ExceptionRecord (EXCEPTION_DEBUG_INFO structure) structure.
As I described earlier, BP can be installed by the debugged application itself, therefore, focusing on these parameters, you need to figure out what kind of BP worked?
For this, a list of previously saved breakpoints is useful to us. Having run through it and comparing the address stored in the DebugEvent.Exception.ExceptionRecord.ExceptionAddress parameter with the Address field of each record with type btBreakpoint, we can determine whether we installed BP at this address or is it something not ours.
If we determined that BP is really ours, then we raise an external event (in order to show the user that we are not just here, but even working) and after processing it, we proceed to restore the debugged application.
Consequences of installing BP:
By installing BP, we have lost some of the executable code.
For example, the initial code was as follows:
After our manipulations, it turned into the following:
The first step is to restore the meaning of the original instruction.
To make this more convenient, the TBreakpoint structure has an Active parameter that indicates the state of the breakpoint. Focusing on this parameter, the TFWDebugerCore class knows about their activity, and to switch the state, it implements the ToggleInt3Breakpoint method, in which, depending on the flag, turns BP on and off, returning the erased byte to its place.
procedure TFWDebugerCore.ToggleInt3Breakpoint(Index: Integer;
  Active: Boolean);
var
  OldProtect: DWORD;
  Dummy: DWORD;
begin
  CheckBreakpointIndex(Index);
  if FBreakpointList[Index].bpType <> btBreakpoint then Exit;
  if FBreakpointList[Index].Active = Active then Exit;
  Check(VirtualProtectEx(FProcessInfo.AttachedProcessHandle,
    FBreakpointList[Index].Int3.Address, 1, PAGE_READWRITE, OldProtect));
  try
    if Active then
      Check(WriteProcessMemory(FProcessInfo.AttachedProcessHandle,
        FBreakpointList[Index].Int3.Address, @BPOpcode, 1, Dummy))
    else
      Check(WriteProcessMemory(FProcessInfo.AttachedProcessHandle,
        FBreakpointList[Index].Int3.Address,
        @FBreakpointList[Index].Int3.ByteCode, 1, Dummy));
  finally
    Check(VirtualProtectEx(FProcessInfo.AttachedProcessHandle,
      FBreakpointList[Index].Int3.Address, 1, OldProtect, OldProtect));
  end;
  FBreakpointList[Index].Active := Active;
end;
The implementation is almost similar to the code setting the BP except that when reinstalling the BP it is not necessary to read the byte value again (since we already know it).
Now the caveat: if we run the debugged application right now, we get an error. And all because the “INT3” instruction has already been executed, and even if we returned the byte we had worn to the place at 0x452220, the debugged program will continue execution from the address 0x452221, where the “mov ebp, esp” instruction is located, and not from where it was a debug exception has been thrown.
The second nuance: you can, of course, dream in this direction: “Well, think about it -“ push ebp ”failed, well, the stack floated away, but we are a debugger and if something can come and fix everything ©". So that's basically correct, except for one point.
Yes, it is in this case that we, as a debugger, can correctly move the stack header and not pay attention to unfulfilled instructions, but there is such a trick that is often used as an anti-debugging (more precisely aimed at obfuscating the disassembler, the debugger will not even notice it) as a jump into middle of the instructions.
What it is:
This technique is based on the fact that the disassembler cannot always correctly interpret machine code, especially if it is written specifically to confuse disasma.
As an example, a fairly small number of developers know such a thing as “long NOP”. Moreover, a year and a half or two ago it was not in Intel's manuals, where it was said that NOP (an empty instruction used to align the code) looks only in the form of an 0x90 opcode. Accordingly, most disassemblers can only work with this opcode. Yes, however, why the majority - I have not yet met a disassembler that correctly recognizes long feet.
Since the disassembler cannot recognize it normally, we can do the following trick:
For example, take a three-byte NOP (opcode $ 0F, $ 1F, $ 00) and write this code:
asm
  db $0F, $1F, $00
  xor eax, eax
  inc eax
  neg eax
end;
And here is what the disassembler will show us: The
opcodes of all instructions are correct and they will be executed correctly, but the disassembler shows us absolutely not what we wrote initially.
Well, or the second example, already directly using the jump. Here the idea lies in the fact that before the start of the next instruction, the absolutely left byte is written, before which the instruction code “jmp +1” is written, forcing the program to skip this garbage byte and go directly to the desired code. It would seem a banal thing - but disassembler is quite confusing.
As an example, we will write the following code:
asm
   db $EB, $01   // jmp +1 (прыжок на xor пропуская "левый байт")
   db $B8        // непосредственно сам "левый" байт
   xor eax, eax  // правильный код
   inc eax
   neg eax
   not eax
   sub edx, eax
   imul eax, edx
   nop
   nop
end;
Now let's see what the disassembler shows us:
Full garbage, as expected.
So, for what I said all this: let's go back to our BP and imagine that it was installed not at 0x452220, but nine bytes further, just at the beginning of the push $ 00452245 instruction.
This instruction, in contrast to the single-byte "push epb" is presented in the form of five bytes. Even after the recovery of the value of the erased byte occurs, if we continue to execute the code, we will start not from the beginning of the instruction, but from the middle of it, and here it is not the disassembler but the debugger itself that will be mistaken, because for it this code will now look like the following way:
Those. instead of the original “push $ 00452245”, the instructions “inc epb” and “and al, [ebp + $ 00]” will be executed, which were not around here. And after a couple of instructions, we get what was expected - an error.
Therefore, returning the erased byte to its place is not enough; you need to make the debugged application continue the program from the correct address. The address of the instruction to be executed at the next iteration stores the EIP (Extended Instruction Pointer) register. Access to this register is carried out through the thread context of the debugged process in which the interrupt occurred. To change the value of the EIP register, you need to get the context by calling the GetThreadContext function, reduce the current value of the Context.Eip parameter, and then write the new value by calling the SetThreadContext function.
There is a nuance: when the EXCEPTION_DEBUG_EVENT event occurs, we get only the thread ID in the DebugEvent.dwThreadId parameter, and the GetThreadContext () and SetThreadContext () functions require a thread handle for their work, the ID is not interesting to them. You can of course get the required value by calling the OpenThread function, but in this case we don’t have to do this, because we have a saved list of thread handles stored in the form ThreadID = ThreadHandle.
Now we seem to have done everything right, restored the erased byte, set the correct address for the instruction, and we can even run the program for execution, but there is one more BUT. And what to do with the previously installed BP, because after we deleted the 0xCC opcode, the BP record remained only in the debugger lists, but in the debugged application it is not in fact? If we run the program right now, it will execute the current instruction and without stopping will go to the next one, continuing to execute the program code until it runs into some other BP or an error.
So the task appeared, we need to somehow make the application transfer control to the debugger immediately after the execution of the instruction with which we just removed the BP. If we succeed, then we can return BP to its rightful place.
There are many solutions, for example, you can calculate the size of the current instruction and put a new temporary BP at the beginning of the next, but it will have to write a length disassembler, take into account the moment that at the beginning of the next instruction BP can also be set, etc. and indeed this is not the right decision.
And the correct solution in this case is to put the processor in trace mode.
The processor flag is responsible for enabling this mode. If this flag is enabled, each instruction will trigger an “INT1” interrupt, which will throw an exception in the debugged process and the debugger will get control on the EXCEPTION_DEBUG_EVENT event with the exception code EXCEPTION_SINGLE_STEP.
You can enable this flag through the thread context, through which we changed the value of the EIP register. The flags state is controlled by the Context.EFlags parameter. The TF flag is stored in the eighth bit of this parameter. Those. making it easier to enable it, we should do something like this:
const
  EFLAGS_TF = $100; // 8-ой бит
...
  Context.EFlags := Context.EFlags or EFLAGS_TF;
Trace Nuance: The peculiarity of the “INT1” interrupt is that it resets the TF flag. Those. if we need to execute only one instruction to restore BP, this behavior suits us perfectly, because we do not need to worry about restoring the TF flag to its original state. But if we are interested in sequential tracing of each instruction, we will have to re-raise the TF flag in each EXCEPTION_SINGLE_STEP handler again. We will consider this mode later.
In summary, the algorithm for installing and processing BP at the code address is as follows:
- Initialize the structure describing BP, save the address and byte value at this address in it.
- Write the 0xCC opcode to the BP address and run the program for execution.
- Wait for EXCEPTION_BREAKPOINT exception, upon receipt of which to restore the original byte
- Change the value of the EIP register and put the processor in trace mode by enabling the TF flag
- Wait for EXCEPTION_SINGLE_STEP exception
- Return the 0xCC opcode.
Now you have a minimal idea of how many actions actually happen when you press the F7 button in the Delphi debugger :)
Well, this is how it is implemented in the TFWDebugerCore class.
EXCEPTION_BREAKPOINT exception handler:
procedure TFWDebugerCore.ProcessExceptionBreakPoint(ThreadIndex: Integer;
  DebugEvent: TDebugEvent);
var
  ReleaseBP: Boolean;
  BreakPointIndex: Integer;
begin
  ReleaseBP := False;
  BreakPointIndex := GetBPIndex(
    DWORD(DebugEvent.Exception.ExceptionRecord.ExceptionAddress));
  if BreakPointIndex >= 0 then
  begin
    if Assigned(FBreakPoint) then
      FBreakPoint(Self, ThreadIndex,
        DebugEvent.Exception.ExceptionRecord, BreakPointIndex,
        ReleaseBP)
    else
      CallUnhandledExceptionEvents(ThreadIndex, ecBreakpoint, DebugEvent);
    ToggleInt3Breakpoint(BreakPointIndex, False);
    SetSingleStepMode(ThreadIndex, True);
    if ReleaseBP then
      RemoveBreakpoint(BreakPointIndex)
    else
      FRestoreBPIndex := BreakPointIndex;
  end
  else
    CallUnhandledExceptionEvents(ThreadIndex, ecBreakpoint, DebugEvent);
end;
In it, we first look for the BP index in the internal list by the ExceptionAddress parameter.
Raise the external event.
Turn off BP by calling the ToggleInt3Breakpoint method.
Edit EIP and enable tracing by calling the SetSingleStepMode method.
If the user in the external event handler said that he wants to remove this BP, delete it by calling RemoveBreakpoint.
Well, if you just need to continue execution, we remember the index of the current BP for the EXCEPTION_SINGLE_STEP handler, where, focusing on this variable, it will restore the BP in the debugged process.
The code for the SetSingleStepMode method is as follows:
procedure TFWDebugerCore.SetSingleStepMode(ThreadIndex: Integer;
  RestoreEIPAfterBP: Boolean);
var
  Context: TContext;
begin
  ZeroMemory(@Context, SizeOf(TContext));
  Context.ContextFlags := CONTEXT_FULL;
  Check(GetThreadContext(FThreadList[ThreadIndex].ThreadHandle, Context));
  if RestoreEIPAfterBP then
    Dec(Context.Eip);
  Context.EFlags := Context.EFlags or EFLAGS_TF;
  Check(SetThreadContext(FThreadList[ThreadIndex].ThreadHandle, Context));
end;
Everything is very simple here, we get the full thread context by setting the CONTEXT_FULL flag.
If necessary, edit the EIP register.
Turn on the TF flag.
And assign a new context.
The RemoveBreakpoint method is even simpler:
procedure TFWDebugerCore.RemoveBreakpoint(Index: Integer);
var
  Len: Integer;
begin
  ToggleBreakpoint(Index, False);
  Len := BreakpointCount;
  if Len = 1 then
    SetLength(FBreakpointList, 0)
  else
  begin
    FBreakpointList[Index] := FBreakpointList[Len - 1];
    SetLength(FBreakpointList, Len - 1);
  end;
end;
Here, BP just turns off and then the BP data is removed from the debugger list.
I will not give the code of the exception handler EXCEPTION_SINGLE_STEP, because It is not only used to restore BP. I will show it at the very end of the article, when all the nuances will be considered.
Implementing BP on a memory address:
The next type of BP is used to control data changes in the memory of the debugged application. Better known as Memory Breakpoint (hereinafter MBP).
It is implemented as follows: the entire application memory is represented as a set of pages that can be listed and get their attributes. (see demo application: Process memory card ). When we want to put MBP on any address, we need to calculate the borders of the page to which this address belongs and set the PAGE_GUARD flag to it by calling the VirtualProtectEx function.
Nuance: you can certainly not calculate the page address, but simply call VirtualProtectEx at the required address, but the peculiarity of page addressing is that you can not change the protection of a small section of the page leaving all other addresses unchanged. Security attributes are always assigned entirely to a page. Therefore, if we go to track the change in just one byte, when accessing the bytes adjacent to it, the debugger will also receive notifications.
The second nuance: most debuggers do not allow you to install two or more MBPs located within the same page at the same time. This behavior is most likely due to the following point: when installing MBP, you need to remember the current state of the Protect field of the page in order to return it when the time comes to remove MBP. In the event that MBP is already set on the page, its protection attributes are changed. To get around this point, the following approach is used in the TFWDebugerCore class. When installing a new MBP, it is first checked if there is another MBP that controls this page. If one is found, it takes the value of the PreviosRegionProtect parameter; if there is no MDR, this value is obtained by calling VirtualProtectEx.
The MVR installation code looks like this:
function TFWDebugerCore.SetMemoryBreakpoint(Address: Pointer; Size: DWORD;
  BreakOnWrite: Boolean; const Description: string): Boolean;
var
  Breakpoint: TBreakpoint;
  MBI: TMemoryBasicInformation;
  Index: Integer;
begin
  Index := GetMBPIndex(DWORD(Address));
  if (Index >= 0) and (FBreakpointList[Index].bpType = btMemoryBreakpoint) then
  begin
    MBI.BaseAddress := FBreakpointList[Index].Memory.RegionStart;
    MBI.RegionSize := FBreakpointList[Index].Memory.RegionSize;
    MBI.Protect := FBreakpointList[Index].Memory.PreviosRegionProtect;
  end
  else
    Check(VirtualQueryEx(DebugProcessData.AttachedProcessHandle,
      Address, MBI, SizeOf(TMemoryBasicInformation)) > 0);
  ZeroMemory(@Breakpoint, SizeOf(TBreakpoint));
  Breakpoint.bpType := btMemoryBreakpoint;
  Breakpoint.Description := ShortString(Description);
  Breakpoint.Memory.Address := Address;
  Breakpoint.Memory.Size := Size;
  Breakpoint.Memory.BreakOnWrite := BreakOnWrite;
  Breakpoint.Memory.RegionStart := MBI.BaseAddress;
  Breakpoint.Memory.RegionSize := MBI.RegionSize;
  Check(VirtualProtectEx(FProcessInfo.AttachedProcessHandle,
    Address, Size, MBI.Protect or PAGE_GUARD,
    Breakpoint.Memory.PreviosRegionProtect));
  if Index >= 0 then
    Breakpoint.Memory.PreviosRegionProtect := MBI.Protect;
  Result := AddNewBreakPoint(Breakpoint);
end;
For MBP, you need to store much more parameters, unlike BP. In addition to the address of the controlled area and its size, the parameter configuring the MBP itself is stored - BreakOnWrite, which is responsible for the conditions for triggering an external event (when reading data from the controlled area or when writing to it). The address of the beginning of the page and its size are also stored.
After installing the MVR, you can run the program for execution. As soon as access to the monitored page occurs, the EXCEPTION_DEBUG_EVENT event will be generated with the EXCEPTION_GUARD_PAGE exception code.
There is also a nuance here. When we set the PAGE_GUARD flag on the page, the first time it is accessed, an exception is raised and this flag is removed. That is, unlike BP, we do not need to deal with the disconnection of the MVR on our own. But there is a small problem. As I said earlier, the EXCEPTION_GUARD_PAGE exception will occur whenever the page is accessed, not only the address at which the MDR is set, so the debugger must be able to restore the PAGE_GUARD flag so that the established MVR continues to work correctly.
The handler code looks like this:
procedure TFWDebugerCore.ProcessExceptionGuardPage(ThreadIndex: Integer;
  DebugEvent: TDebugEvent);
var
  CurrentMBPIndex: Integer;
  function CheckWriteMode: Boolean;
  begin
    Result := not FBreakpointList[CurrentMBPIndex].Memory.BreakOnWrite;
    if not Result then
      Result := DebugEvent.Exception.ExceptionRecord.ExceptionInformation[0] = 1;
  end;
var
  MBPIndex: Integer;
  ReleaseMBP: Boolean;
  dwGuardedAddr: DWORD;
begin
  ReleaseMBP := False;
  dwGuardedAddr :=
    DebugEvent.Exception.ExceptionRecord.ExceptionInformation[1];
  MBPIndex := GetMBPIndex(dwGuardedAddr);
  if MBPIndex >= 0 then
  begin
    CurrentMBPIndex := MBPIndex;
    while not CheckIsAddrInRealMemoryBPRegion(CurrentMBPIndex, dwGuardedAddr) do
    begin
      CurrentMBPIndex := GetMBPIndex(dwGuardedAddr, CurrentMBPIndex + 1);
      if CurrentMBPIndex < 0 then Break;
    end;
    if CurrentMBPIndex >= 0 then
    begin
      MBPIndex := CurrentMBPIndex;
      if Assigned(FBreakPoint) and CheckWriteMode then
        FBreakPoint(Self, ThreadIndex,
          DebugEvent.Exception.ExceptionRecord, MBPIndex, ReleaseMBP)
      else
        CallUnhandledExceptionEvents(ThreadIndex, ecGuard, DebugEvent);
    end
    else
      CallUnhandledExceptionEvents(ThreadIndex, ecGuard, DebugEvent);
    FBreakpointList[MBPIndex].Active := False;
    SetSingleStepMode(ThreadIndex, False);
    if ReleaseMBP then
      RemoveBreakpoint(MBPIndex)
    else
      FRestoreMBPIndex := MBPIndex;
  end
  else
    CallUnhandledExceptionEvents(ThreadIndex, ecGuard, DebugEvent);
end;
Initially, the debugger receives the address to which the call occurred due to which an exception occurred. This address is stored in the ExceptionRecord.ExceptionInformation array as the second parameter, the operation flag is the first parameter in this array. Zero means an attempt to read at an address, one means an attempt to read at an address.
Next, we search for a suitable MVR by calling CheckIsAddrInRealMemoryBPRegion which checks whether the address is in the zone controlled by the MVR.
If a suitable one is found, the BreakOnWrite parameter is checked.
The value of this parameter is compared with the value of the first parameter ExceptionInformation. If BreakOnWrite is enabled, then an external event call occurs only if the unit is in the ExceptionInformation, otherwise, if BreakOnWrite is disabled, the event call always occurs.
After all checks, the code is implemented by analogy with BP processing, the only difference from BP processing is that in this case we do not need to edit the value of the EIP register. To do this, False is passed to the SetSingleStepMode method as the second parameter.
By analogy, the recovery of the captured MVP occurs in the EXCEPTION_SINGLE_STEP handler based on the FRestoreMBPIndex index.
The following code is responsible for switching the activity of the MBP:
procedure TFWDebugerCore.ToggleMemoryBreakpoint(Index: Integer;
  Active: Boolean);
var
  Dummy: DWORD;
begin
  CheckBreakpointIndex(Index);
  if FBreakpointList[Index].bpType <> btMemoryBreakpoint then Exit;
  if FBreakpointList[Index].Active = Active then Exit;
  if Active then
    Check(VirtualProtectEx(FProcessInfo.AttachedProcessHandle,
      FBreakpointList[Index].Memory.Address,
      FBreakpointList[Index].Memory.Size,
      FBreakpointList[Index].Memory.PreviosRegionProtect or PAGE_GUARD, Dummy))
  else
    Check(VirtualProtectEx(FProcessInfo.AttachedProcessHandle,
      FBreakpointList[Index].Memory.Address,
      FBreakpointList[Index].Memory.Size,
      FBreakpointList[Index].Memory.PreviosRegionProtect, Dummy));
  FBreakpointList[Index].Active := Active;
end;
Removing the MVR is done by the same method as the BP.
In principle, there are no major cardinal differences, with the exception of a couple of nuances, in BP and the MVR. They just apply each for their tasks.
For example, sometimes MBP is used as a tracer. To implement this feature, the ICBM is simply set in the code area and after launching the debugger, we begin to receive a notification about the change in the current EIP in the remote application. A reasonably convenient thing, a pity is not feasible in the Delphi debugger.
I will show an example of such use at the end of the article. Now let's move on to the third and last type of breakpoints.
Implementation of hardware breakpoints:
The so-called Hardware BreakPoint (hereinafter HBP). Powerful debugging tool. Unlike BP and MVR, these breakpoints do not make modifications in the memory of the debugged application. The only bad thing is that there are very few of them, only four pieces for each thread.
But unlike other HBPs, it provides fairly flexible conditions for controlling the debugged application.
Compare:
BP - only tracks access to the executable code (say Execution mode);
MVR - allows you to track access in the Read or Read / Write mode.
HBP - allows you to set the condition more precisely, it distinguishes between the modes of Write, Read / Write, IO mode (access to the input / output port) and the Execution mode.
Those. HBP can emulate the operation of both BP (in Execution mode) and MBP (in Record - Read / Write modes). True, unlike MVR, it cannot control a large range of the memory area, because can only work with blocks of fixed size 1, 2 or 4 bytes.
HBP settings are stored in the context of each thread, for this DR registers are used, which are accessed when the CONTEXT_DEBUG_REGISTERS flag is specified.
There are six of them. Dr0..Dr3, Dr6, Dr7. (Dr4 and Dr5 are reserved).
The first 4 registers store the address of each of the HBP. Register Dr7 is used to fine-tune the parameters of each of the HBP. Register Dr6 serves to read the results after the operation of any of the four HBP.
The TFWDebugerCore class stores information about HBP in the form of the following structure:
THWBPIndex = 0..3;
THWBPSize = (hsByte, hdWord, hsDWord);
THWBPMode = (hmExecute, hmWrite, hmIO, hmReadWrite);
THardwareBreakpoint = packed record
  Address: array [THWBPIndex] of Pointer;
  Size: array [THWBPIndex] of THWBPSize;
  Mode: array [THWBPIndex] of THWBPMode;
  Description: array [THWBPIndex] of ShortString;
  Active: array [THWBPIndex] of Boolean;
end;
Since all 4 HBPs for each particular thread have their own, they are not stored in the general list of BP classes.
Remember at the beginning I said that we will store data about threads in a separate list in the form of a pair ID = hThreadHandle. In fact, this list is as follows:
TThreadData = record
  ThreadID: DWORD;
  ThreadHandle: THandle;
  Breakpoint: THardwareBreakpoint;
end;
TThreadList = array of TThreadData;
Those. In addition to these two parameters, each thread has its own structure that describes the settings of the HBP belonging to it.
Work with the installation, change of state and removal of HBP is extremely simple.
The installation looks like this:
procedure TFWDebugerCore.SetHardwareBreakpoint(ThreadIndex: Integer;
  Address: Pointer; Size: THWBPSize; Mode: THWBPMode;
  HWIndex: THWBPIndex; const Description: string);
begin
  if ThreadIndex < 0 then Exit;
  FThreadList[ThreadIndex].Breakpoint.Address[HWIndex] := Address;
  FThreadList[ThreadIndex].Breakpoint.Size[HWIndex] := Size;
  FThreadList[ThreadIndex].Breakpoint.Mode[HWIndex] := Mode;
  FThreadList[ThreadIndex].Breakpoint.Description[HWIndex] :=
    ShortString(Description);
  FThreadList[ThreadIndex].Breakpoint.Active[HWIndex] := True;
  UpdateHardwareBreakpoints(ThreadIndex);
end;
We simply initialize the structure and call the UpdateHardwareBreakpoints method.
The state modification is implemented by the following code:
procedure TFWDebugerCore.ToggleHardwareBreakpoint(ThreadIndex: Integer;
  Index: THWBPIndex; Active: Boolean);
begin
  if ThreadIndex < 0 then Exit;
  if FThreadList[ThreadIndex].Breakpoint.Active[Index] = Active then Exit;
  FThreadList[ThreadIndex].Breakpoint.Active[Index] := Active;
  UpdateHardwareBreakpoints(ThreadIndex);
end;
Just change the Active flag and again call UpdateHardwareBreakpoints.
Well, the removal:
procedure TFWDebugerCore.DropHardwareBreakpoint(ThreadIndex: Integer;
  Index: THWBPIndex);
begin
  if ThreadIndex < 0 then Exit;
  if FThreadList[ThreadIndex].Breakpoint.Address[Index] = nil then Exit;
  FThreadList[ThreadIndex].Breakpoint.Address[Index] := nil;
  UpdateHardwareBreakpoints(ThreadIndex);
end;
We reset the HBP address and call UpdateHardwareBreakpoints again.
The whole nuance lies precisely in the UpdateHardwareBreakpoints method.
Its main task is to fill in the Dr0-Dr3 registers with addresses of active HBPs and carry out the correct initialization of the Dr7 register.
Here it is necessary to tinker with it.
This register is a set of bit flags that determine the settings of each of the HBP and formally everything looks as follows:
The oldest 4 bits (31-28) store the settings of the Dr3 register.
It looks like this: The
upper 2 bits (LENi) of the four are responsible for the size of the monitored HBP memory.
00 - 1 byte
01 - 2 bytes
10 - this combination of bits is not used.
11 - 4 bytes
The lower 2 bits (RWi) of 4 are responsible for setting the operating mode of HBP
00 - Execute
01 - Write
10 - IO Read / Write
11 - Read / Write
Thus, if we want the HBP from the Dr3 register to respond to writing to any 4 bytes starting from the value specified in Dr3, the high 4 bits of the Dr7 register should look like 1101.
The next 4 bits (27-24) are used to configure the HBP of the Dr2 register.
Bits 23-20 refer to Dr1 and, finally, bits 19-16 to the register Dr0 .
Bit 13 of the Dr7 register (GD - Global Debug Register Access Detect) - is responsible for the integrity of the data in the debug registers. For example, if the program being debugged suddenly decided to store its values in these registers, the debugger will be notified about this.
Bit 9 of the Dr7 register (GE - Global Exact data breakpoint match) - includes work with global HBP.
Bit 8 of the Dr7 register (LE - Local Exact data breakpoint match) - enables work with local HBP.
LE bit is reset when switching tasks, more details can be found in the Intel manuals.
There are 8 bits left (7-0) represented as a pair of Gi and Li flags for each of the registers including HBP in global or local mode.
Bit 7 (Gi - Global breakpoint enable) - enables the global mode to the Dr3 register;
Bit 6 (Li - Local breakpoint enable) - enables the local mode to the Dr3 register 5-4; is
the same for Dr2
3-2 for Dr1 and 1-0 for Dr0
Confused?
Well then here is the picture:
In the form of source code, everything looks quite simple.
procedure TFWDebugerCore.UpdateHardwareBreakpoints(ThreadIndex: Integer);
const
  DR7_SET_LOC_DR0 = $01;
  DR7_SET_GLB_DR0 = $02;
  DR7_SET_LOC_DR1 = $04;
  DR7_SET_GLB_DR1 = $08;
  DR7_SET_LOC_DR2 = $10;
  DR7_SET_GLB_DR2 = $20;
  DR7_SET_LOC_DR3 = $40;
  DR7_SET_GLB_DR3 = $80;
  DR7_SET_LOC_ON  = $100;
  DR7_SET_GLB_ON  = $200;
  DR7_PROTECT     = $2000;
  DR_SIZE_BYTE    = 0;
  DR_SIZE_WORD    = 1;
  DR_SIZE_DWORD   = 3;
  DR_MODE_E       = 0;
  DR_MODE_W       = 1;
  DR_MODE_I       = 2;
  DR_MODE_R       = 3;
  DR7_MODE_DR0_E  = DR_MODE_E shl 16;
  DR7_MODE_DR0_W  = DR_MODE_W shl 16;
  DR7_MODE_DR0_I  = DR_MODE_I shl 16;
  DR7_MODE_DR0_R  = DR_MODE_R shl 16;
  DR7_SIZE_DR0_B  = DR_SIZE_BYTE shl 18;
  DR7_SIZE_DR0_W  = DR_SIZE_WORD shl 18;
  DR7_SIZE_DR0_D  = DR_SIZE_DWORD shl 18;
  DR7_MODE_DR1_E  = DR_MODE_E shl 20;
  DR7_MODE_DR1_W  = DR_MODE_W shl 20;
  DR7_MODE_DR1_I  = DR_MODE_I shl 20;
  DR7_MODE_DR1_R  = DR_MODE_R shl 20;
  DR7_SIZE_DR1_B  = DR_SIZE_BYTE shl 22;
  DR7_SIZE_DR1_W  = DR_SIZE_WORD shl 22;
  DR7_SIZE_DR1_D  = DR_SIZE_DWORD shl 22;
  DR7_MODE_DR2_E  = DR_MODE_E shl 24;
  DR7_MODE_DR2_W  = DR_MODE_W shl 24;
  DR7_MODE_DR2_I  = DR_MODE_I shl 24;
  DR7_MODE_DR2_R  = DR_MODE_R shl 24;
  DR7_SIZE_DR2_B  = DR_SIZE_BYTE shl 26;
  DR7_SIZE_DR2_W  = DR_SIZE_WORD shl 26;
  DR7_SIZE_DR2_D  = DR_SIZE_DWORD shl 26;
  DR7_MODE_DR3_E  = DR_MODE_E shl 28;
  DR7_MODE_DR3_W  = DR_MODE_W shl 28;
  DR7_MODE_DR3_I  = DR_MODE_I shl 28;
  DR7_MODE_DR3_R  = DR_MODE_R shl 28;
  DR7_SIZE_DR3_B  = DR_SIZE_BYTE shl 30;
  DR7_SIZE_DR3_W  = DR_SIZE_WORD shl 30;
  DR7_SIZE_DR3_D  = $C0000000; //DR_SIZE_DWORD shl 30;
  DR_On: array [THWBPIndex] of DWORD = (
    DR7_SET_LOC_DR0,
    DR7_SET_LOC_DR1,
    DR7_SET_LOC_DR2,
    DR7_SET_LOC_DR3
  );
  DR_Mode: array [THWBPIndex] of array [THWBPMode] of DWORD = (
    (DR7_MODE_DR0_E, DR7_MODE_DR0_W, DR7_MODE_DR0_I, DR7_MODE_DR0_R),
    (DR7_MODE_DR1_E, DR7_MODE_DR1_W, DR7_MODE_DR1_I, DR7_MODE_DR1_R),
    (DR7_MODE_DR2_E, DR7_MODE_DR2_W, DR7_MODE_DR2_I, DR7_MODE_DR2_R),
    (DR7_MODE_DR3_E, DR7_MODE_DR3_W, DR7_MODE_DR3_I, DR7_MODE_DR3_R)
  );
  DR_Size: array [THWBPIndex] of array [THWBPSize] of DWORD = (
    (DR7_SIZE_DR0_B, DR7_SIZE_DR0_W, DR7_SIZE_DR0_D),
    (DR7_SIZE_DR1_B, DR7_SIZE_DR1_W, DR7_SIZE_DR1_D),
    (DR7_SIZE_DR2_B, DR7_SIZE_DR2_W, DR7_SIZE_DR2_D),
    (DR7_SIZE_DR3_B, DR7_SIZE_DR3_W, DR7_SIZE_DR3_D)
  );
var
  Context: TContext;
  I: THWBPIndex;
begin
  if ThreadIndex < 0 then Exit;
  ZeroMemory(@Context, SizeOf(TContext));
  Context.ContextFlags := CONTEXT_DEBUG_REGISTERS;
  for I := 0 to 3 do
  begin
    if not FThreadList[ThreadIndex].Breakpoint.Active[I] then Continue;
    if FThreadList[ThreadIndex].Breakpoint.Address[I] <> nil then
    begin
      Context.Dr7 := Context.Dr7 or DR7_SET_LOC_ON;
      case I of
        0: Context.Dr0 := DWORD(FThreadList[ThreadIndex].Breakpoint.Address[I]);
        1: Context.Dr1 := DWORD(FThreadList[ThreadIndex].Breakpoint.Address[I]);
        2: Context.Dr2 := DWORD(FThreadList[ThreadIndex].Breakpoint.Address[I]);
        3: Context.Dr3 := DWORD(FThreadList[ThreadIndex].Breakpoint.Address[I]);
      end;
      Context.Dr7 := Context.Dr7 or DR_On[I];
      Context.Dr7 := Context.Dr7 or DR_Mode[I,
        FThreadList[ThreadIndex].Breakpoint.Mode[I]];
      Context.Dr7 := Context.Dr7 or DR_Size[I,
        FThreadList[ThreadIndex].Breakpoint.Size[I]];
    end;
  end;
  Check(SetThreadContext(FThreadList[ThreadIndex].ThreadHandle, Context));
end;
If you do not pay attention to the block of constants preceding the code, then the initialization of the Dr7 register is implemented with only three lines.
Context.Dr7 := Context.Dr7 or DR_On[I];
Context.Dr7 := Context.Dr7 or DR_Mode[I,
  FThreadList[ThreadIndex].Breakpoint.Mode[I]];
Context.Dr7 := Context.Dr7 or DR_Size[I,
  FThreadList[ThreadIndex].Breakpoint.Size[I]];
Well, apart from the inclusion of the LE bit represented by the constant DR7_SET_LOC_ON.
Now we turn to the processing of HBP.
When BP triggered, we received the code EXCEPTION_BREAKPOINT.
When the MVR was triggered, the code was EXCEPTION_GUARD_PAGE.
And upon interruption on HBP, we will generate an EXCEPTION_DEBUG_EVENT event with the code EXCEPTION_SINGLE_STEP, which, among other things, is used to restore the state of BP and MBP (therefore, I did not cite its implementation at the beginning of the article).
When EXCEPTION_SINGLE_STEP is received, the HBP handler implemented as the first one is called as follows:
function TFWDebugerCore.ProcessHardwareBreakpoint(ThreadIndex: Integer;
  DebugEvent: TDebugEvent): Boolean;
var
  Index: Integer;
  Context: TContext;
  ReleaseBP: Boolean;
begin
  ZeroMemory(@Context, SizeOf(TContext));
  Context.ContextFlags := CONTEXT_DEBUG_REGISTERS;
  Check(GetThreadContext(FThreadList[ThreadIndex].ThreadHandle, Context));
  Result := Context.Dr6 and $F <> 0;
  if not Result then Exit;
  Index := -1;
  if Context.Dr6 and 1 <> 0 then
    Index := 0;
  if Context.Dr6 and 2 <> 0 then
    Index := 1;
  if Context.Dr6 and 4 <> 0 then
    Index := 2;
  if Context.Dr6 and 8 <> 0 then
    Index := 3;
  if Index < 0 then
  begin
    Result := False;
    Exit;
  end;
  ReleaseBP := False;
  if Assigned(FHardwareBreakpoint) then
    FHardwareBreakpoint(Self, ThreadIndex, DebugEvent.Exception.ExceptionRecord,
      Index, ReleaseBP);
  ToggleHardwareBreakpoint(ThreadIndex, Index, False);
  SetSingleStepMode(ThreadIndex, False);
  if ReleaseBP then
    DropHardwareBreakpoint(ThreadIndex, Index)
  else
  begin
    // если два HWBP идут друг за другом,
    // то т.к. восстановление происходит через индексы
    // в ProcessExceptionSingleStep, индекс предыдущего HWBP будет претерт
    // поэтому перед перетиранием индексов нужно восстановить предыдущий HWBP
    if (FRestoredThread >= 0) and (FRestoredHWBPIndex >= 0) then
      ToggleHardwareBreakpoint(FRestoredThread, FRestoredHWBPIndex, True);
    FRestoredHWBPIndex := Index;
    FRestoredThread := ThreadIndex;
  end;
end;
Its task is to determine which particular HBP caused the interruption, trigger an external event and execute a finalization algorithm approximately similar to those already shown in the BP and MVR handlers.
To determine the HBP number, it is necessary to read the value of the Dr6 register from the thread context.
The lower 4 bits of this register are flags that take the value 1 if the corresponding DrX register has worked.
Everything is quite simple, after determining the necessary NVR, we call an external event, turn off the NVR, put the processor in trace mode (without editing EIP), then either delete the NVR or store its index in two variables, guided by which the EXCEPTION_SINGLE_STEP handler will restore the state of the NVR.
Well, it seems that we have come to a logical conclusion.
It remains only to show the implementation of the EXCEPTION_SINGLE_STEP handler itself.
It looks like this:
procedure TFWDebugerCore.ProcessExceptionSingleStep(ThreadIndex: Integer;
  DebugEvent: TDebugEvent);
var
  Handled: Boolean;
begin
  // Обрабатываем HWBP
  Handled := ProcessHardwareBreakpoint(ThreadIndex, DebugEvent);
  // Если событие поднято из-за HWPB восстанавливаем предыдущий HWBP
  if not Handled and (FRestoredThread >= 0) and
    (FRestoredHWBPIndex >= 0) then
  begin
    ToggleHardwareBreakpoint(FRestoredThread, FRestoredHWBPIndex, True);
    FRestoredThread := -1;
    FRestoredHWBPIndex := -1;
  end;
  // Восстанавливаем ВР
  if FRestoreBPIndex >= 0 then
  begin
    CheckBreakpointIndex(FRestoreBPIndex);
    if FBreakpointList[FRestoreBPIndex].bpType = btBreakpoint then
      ToggleInt3Breakpoint(FRestoreBPIndex, True);
    FRestoreBPIndex := -1;
  end;
  // Восстанавливаем MВР
  if FRestoreMBPIndex >= 0 then
  begin
    CheckBreakpointIndex(FRestoreMBPIndex);
    if FBreakpointList[FRestoreMBPIndex].bpType = btMemoryBreakpoint then
      ToggleMemoryBreakpoint(FRestoreMBPIndex, True);
    FRestoreMBPIndex := -1;
  end;
  // если на предыдущий итерации был выставлен режим трассировки
  // уведомляем о нем пользователя
  if ResumeAction <> raRun then
  begin
    CallUnhandledExceptionEvents(ThreadIndex, ecSingleStep, DebugEvent);
    // после чего настраиваем отладчик в зависимости от команды пользователя
    DoResumeAction(ThreadIndex);
  end;
end;
His task is to initially determine whether an exception has been generated due to a stop at HBP. If this is true, then by calling ToggleHardwareBreakpoint the HBP returns to its place.
If the exception was raised because the trace flag was turned on after BP or MVP processing, the variables FRestoreBPIndex and FRestoreMBPIndex will indicate the index of the breakpoint that needs to be returned to its place.
Depending on its type, calls are made to the ToggleInt3Breakpoint or ToggleMemoryBreakpoint methods.
Practice:
I will finish this with a description of the debugger implementation, but take your time - there are a few more points that I would like to show in practice.
Well, as in that joke about the plane: “now we’ll try to lift this whole canoe into the air” :)
For this, we need to implement two applications.
First, we will try to debug it. Create a new VCL project, save it with the name “test_app”, and then compile the project.
Now we will write a debugger application. For this, we will have enough form, two buttons (to start and stop the debugging process) and TMemo or TRichEdit, where all the information will be displayed.
We write:
type
  TdlgDebuger = class(TForm)
    Panel1: TPanel;
    btnStart: TButton;
    btnStop: TButton;
    edLog: TRichEdit;
    procedure btnStartClick(Sender: TObject);
    procedure btnStopClick(Sender: TObject);
  private
    FCore: TFWDebugerCore;
    FNeedStop: Boolean;
    procedure Writeln(const Value: string = '');
  end;
...
procedure TdlgDebuger.btnStartClick(Sender: TObject);
var
  Path: string;
begin
  FNeedStop := False;
  // путь к отлаживаемому приложению измените на свой
  Path := ExtractFilePath(ParamStr(0)) + '..\test_app\test_app.exe';
  FCore := TFWDebugerCore.Create(50);
  try
    btnStart.Enabled := False;
    btnStop.Enabled := True;
    if not FCore.DebugNewProcess(Path, True) then
      RaiseLastOSError;
    FCore.RunMainLoop;
  finally
    FCore.Free;
    btnStart.Enabled := True;
    btnStop.Enabled := False;
  end;
  Writeln;
  Writeln('Debug stop');
end;
procedure TdlgDebuger.Writeln(const Value: string);
begin
  edLog.Lines.Add(Value);
end;
procedure TdlgDebuger.btnStopClick(Sender: TObject);
begin
  FNeedStop := True;
end;
You should get something like this:
Click the "Start" button, if everything is done correctly, the test application will start.
In this case, the main application will cease to practically respond to mouse and keyboard commands.
The fact is that after starting it is located inside the TFWDebugerCore.RunMainLoop debugging cycle, which prevents the message queue fetching cycle from executing.
Close the test application, this will allow the debugger to exit the debugging cycle and give the opportunity to work with the window.
In a good way, the debugger needs to be run in a separate thread (more precisely, not in a good way - and this is the right approach), but even without it, we can work with it in the normal way by closing the OnIdle event of the TFWDebugerCore class, in which we write the following code:
procedure TdlgDebuger.OnIdle(Sender: TObject);
begin
  if FNeedStop then
    FCore.StopDebug
  else
    Application.ProcessMessages;
end;
Calling Application.ProcessMessages will not let our application slow down in the process.
Now let's try to get debugging information about the process in the form that the Delphi debugger displays. To do this, connect the OnCreateProcess and OnLoadDll handlers.
In the first we write the following:
procedure TdlgDebuger.OnCreateProcess(Sender: TObject;
  ThreadIndex: Integer; Data: TCreateProcessDebugInfo);
var
  T: TThreadData;
begin
  T := FCore.GetThreadData(ThreadIndex);
  Writeln(Format('CreateThread ID: %d', [T.ThreadID]));
  Writeln(Format('ProcessStart ID: %d', [FCore.DebugProcessData.ProcessID]));
end;
In the second, this code:
procedure TdlgDebuger.OnLoadDll(Sender: TObject; ThreadIndex: Integer;
  Data: TLoadDLLDebugInfo);
const
  FormatStrKnownDLL = 'Load Dll at instance %p handle %d "%s"';
  FormatStrUnknownDLL = 'Load unknown Dll at instance %p handle %d';
var
  DllName: AnsiString;
  IsUnicodeData: Boolean;
begin
  FCore.ContinueStatus := DBG_EXCEPTION_NOT_HANDLED;
  IsUnicodeData := Data.fUnicode = 1;
  DllName := FCore.GetDllName(Data.lpImageName, Data.lpBaseOfDll, IsUnicodeData);
  if DllName <> '' then
  begin
    if IsUnicodeData then
      Writeln(Format(FormatStrKnownDLL, [Data.lpBaseOfDll,
        Data.hFile, PWideChar(@DllName[1])]))
    else
      Writeln(Format(FormatStrKnownDLL, [Data.lpBaseOfDll,
        Data.hFile, PAnsiChar(@DllName[1])]));
  end
  else
    Writeln(Format(FormatStrUnknownDLL, [Data.lpBaseOfDll, Data.hFile]));
end;
After that, we will start the debugging application again and press the “Start” button.
The following should work:
Well, it seems - it seems.
Trace Implementation:
Now let's try to work with the debugger. To begin, consider two trace options, the first through the TF flag, the second through MBP. We will trace the first 40 bytes from the program entry point. Let's immediately see how they look:
In order to start tracing for good, you need to wait for the process to initialize, after which you can safely set BP / MVR and so on. To do this, you must tell the debugger to install BP on the application entry point. The second parameter of the DebugNewProcess function is responsible for this. We have it already set to True, and it remains only to process this BP. To do this, connect the OnBreakPoint handler in which we set the trace mode.
procedure TdlgDebuger.OnBreakPoint(Sender: TObject; ThreadIndex: Integer;
  ExceptionRecord: Windows.TExceptionRecord; BreakPointIndex: Integer;
  var ReleaseBreakpoint: Boolean);
begin
  // Выводим пойманный ВР в лог
  Writeln(Format('!!! --> Breakpoint "%s"',
    [FCore.BreakpointItem(BreakPointIndex).Description]));
  // Снимаем его (больше он нам не потребуется)
  ReleaseBreakpoint := True;
  // Включаем режим трассировки
  FCore.ResumeAction := raTraceInto;
  // Инициализируем количество трассировочных прерываний
  FStepCount := 0;
end;
Since tracing occurs through the generation of the OnSingleStep event, we also implement it:
procedure TdlgDebuger.OnSingleStep(Sender: TObject; ThreadIndex: Integer;
  ExceptionRecord: Windows.TExceptionRecord);
begin
  // Выводим пойманный ВР в лог
  Inc(FStepCount);
  Writeln(Format('!!! --> trace step №%d at addr 0x%p',
    [FStepCount, ExceptionRecord.ExceptionAddress]));
  // В зависимости от количества срабатываний отключаем трассировку
  if FStepCount > 10 then
    FCore.ResumeAction := raRun
  else
    FCore.ResumeAction := raTraceInto;
end;
The result will be the following conclusion:
We did a StepIn trace, this clearly shows us the fifth trace step that occurred at 0x00409FF4, this is the beginning of the _InitExe () function, which is called at 0x00409C53. Tracing is a rather slow process and I did not wait for control to return from the _InitExe () function, for demonstration I limited myself to a dozen steps.
The second trace mode is the installation of the MVR.
In order to demonstrate it, it is necessary to block the OnPageGuard event and, upon reaching the entry point, call the SetMemoryBreakpoint method with a controlled memory range of zero. In this case, the debugger will know about the page being monitored by the MBP, but the OnBreakPoint handler for this MBP will not be called. The implementation of this tracing option is left to your discretion, I’ll just give you a hint, it is highly recommended not to call the RemoveBreakpoint method from the debug event handlers (indexes will disappear), there are two standard methods for removing BP / MBP / HBP in this debugger implementation, the ReleaseBreakpoint parameter when the BP handler is called , or the RemoveCurrentBreakpoint procedure available in any of the handlers. Probably in the following implementations of the TFWDebugerCore class this behavior will be revised,
Tracing, of course, is good, but I didn’t want to talk about it in the practical part of the article, so there are no tracing examples in the demo that goes with the article.
Receiving a debug string:
To start, I wanted to show the receipt of strings that the application sends to the debugger using the OutputDebugString function. To do this, place the button in the test application and, for example, write the following code in its handler:
//
//  Вывод отладочной строки
// =============================================================================
procedure TForm1.btnDebugStringClick(Sender: TObject);
begin
  OutputDebugString('Test debug string');
end;
Then, in the debugger, close the OnDebugString event by implementing the following code in it:
procedure TdlgDebuger.OnDebugString(Sender: TObject; ThreadIndex: Integer;
  Data: TOutputDebugStringInfo);
begin
  if Data.fUnicode = 1 then
    Writeln('DebugString: ' +
      PWideChar(FCore.ReadStringW(Data.lpDebugStringData, Data.nDebugStringLength)))
  else
    Writeln('DebugString: ' +
      PAnsiChar(FCore.ReadStringA(Data.lpDebugStringData, Data.nDebugStringLength)));
end;
Run the debugger, in it the debugged application and click on the button. The message "Test debug string" is displayed in the log? If yes, then everything was done correctly :)
Exception handling:
Remember, I talked about using BP as an anti-debugging application? Now let's try to consider about the same option. In the test application, add another button and write the following code in it:
//
//  Детектируем отладчик через поднятие отладочного прерывания
// =============================================================================
procedure TForm1.btnExceptClick(Sender: TObject);
begin
  try
    asm
      int 3
    end;
    ShowMessage('Debugger detected.');
  except
    ShowMessage('Debugger not found.');
  end;
end;
This, in principle, is not even anti-debugging, but strangely enough sometimes some reversers are scorching even on such a primitive scheme.
The essence of this method is as follows: at the beginning of the article I gave an example of a debugging cycle, in it, at each iteration, the ContinueStatus parameter, with which the ContinueDebugEvent function is called, was initialized with the DBG_CONTINUE constant. What does this mean? This is a signal that our debugger has successfully processed the exception that has arisen and is not worth fiddling with it further.
Well, now what does this mean with the example of the above code: by invoking the “INT3” instruction, we raise an exception. During normal operation of the application, there is no one to handle this exception, so when it occurs, a transition to the exception..end handler takes place, in which we say that everything is fine. If we are under the debugger, then he will catch this exception and the application handler will not be called.
You can check, launch the application and click the button with this code, it will honestly say - we are under the debugger.
It is just as easy to overcome this code, it is enough to block the OnUnknownBreakPoint event (int3 is a breakpoint, and it was not set by us, therefore, it will be caught in this event). In the event handler, write the following code:
procedure TdlgDebuger.OnUnknownBreakPoint(Sender: TObject;
  ThreadIndex: Integer; ExceptionRecord: Windows.TExceptionRecord);
var
  ApplicationBP: Boolean;
begin
  ApplicationBP :=
    (DWORD(ExceptionRecord.ExceptionAddress) > FCore.DebugProcessData.EntryPoint) and
    (DWORD(ExceptionRecord.ExceptionAddress) < $500000);
  Writeln;
  if ApplicationBP then
  begin
    Writeln(Format('!!! --> Unknown application breakpoint at addr 0X%p',
      [ExceptionRecord.ExceptionAddress]));
    Writeln('!!! --> Exception not handled.');
    FCore.ContinueStatus := DBG_EXCEPTION_NOT_HANDLED;
  end
  else
  begin
    Writeln(Format('!!! --> Unknown breakpoint at addr 0X%p',
      [ExceptionRecord.ExceptionAddress]));
    Writeln('!!! --> Exception handled.');
    FCore.ContinueStatus := DBG_CONTINUE;
  end;
  Writeln;
end;
Everything is simple in it, based on the address at which BP is installed, we determine its location in the application body or not (roughly taking the range from the application download address to $ 500,000). If BP is installed in the body of the application, then this is some kind of anti-debugging. We tell the debugger that we don’t know what to do with it by setting the DBG_EXCEPTION_NOT_HANDLED flag, otherwise, we simply log the information that someone else is playing with breakpoints.
As a result of such gestures, the exception artificially raised by the application will not be processed and it will happily inform us that it did not detect the debugger :)
What happens when the stack overflows:
Well, the last thing I wanted to show you is how the stack overflow looks from the side of the debugger. I’ll take an example of overflow from one of the previous articles, for example, like this:
//
//  Разрушаем стек приложения через переполнение
// =============================================================================
procedure TForm1.btnKillStackClick(Sender: TObject);
  procedure T;
  var
    HugeBuff: array [0..10000] of DWORD;
  begin
    if HugeBuff[0] <> HugeBuff[10000] then
      Inc(HugeBuff[0]);
    T;
  end;
begin
  try
    T;
  except
    T;
  end;
end;
Add this code to the test application and click the button. The response of the debugger may be different, but the result will always be the same - the debugger will become very bad. What happens in this case? The mechanism for detecting stack overflows is quite simple, the border that cannot be crossed is represented by a separate page marked with the PAGE_GUARD flag. Well, yes, this is the same mechanism by which we set up our MVR, but in this case it is used for other purposes. When overflowing, the EXCEPTION_STACK_OVERFLOW will initially receive a notification to the debugger. In principle, right here you can “dry the oars” and shut down the debugger, but we are persistent and will start the test application further. If you remember, the nuance of the PAGE_GUARD flag is that it is removed after the first call, here is the same case.
We implement the overflow handler in the OnUnknownException event, because TFWDebugerCore does not throw these two exceptions as separate events. We will write the following in it:
procedure TdlgDebuger.OnUnknownException(Sender: TObject;
  ThreadIndex: Integer; ExceptionRecord: Windows.TExceptionRecord);
var
  Cause: string;
begin
  Writeln;
  case ExceptionRecord.ExceptionCode of
    EXCEPTION_STACK_OVERFLOW:
    begin
      Writeln('!!! --> Stack overflow detected. Probe to continue.');
      FCore.ContinueStatus := DBG_CONTINUE;
    end;
    EXCEPTION_ACCESS_VIOLATION:
    begin
      {
        The first element of the array contains a read-write flag that
        indicates the type of operation that caused the access violation.
        If this value is zero, the thread attempted to read the inaccessible data.
        If this value is 1, the thread attempted to write to an inaccessible address.
        If this value is 8, the thread causes a user-mode data execution prevention (DEP) violation.
        The second array element specifies the virtual address of the inaccessible data.
      }
      case ExceptionRecord.ExceptionInformation[0] of
        0: Cause := 'read';
        1: Cause := 'write';
        8: Cause := 'DEP violation';
      else
        Cause := 'unknown cause';
      end;
      Writeln(Format('!!! --> Access violation at addr 0x%p %s of address 0x%p',
        [
          ExceptionRecord.ExceptionAddress,
          Cause,
          Pointer(PDWORD(@ExceptionRecord.ExceptionInformation[1])^)
        ]));
      Writeln('!!! --> Process Stopped.');
      FCore.ContinueStatus := DBG_CONTROL_C;
    end;
  else
    Writeln(Format('!!! --> Unknown exception code %p at addr 0x%p',
      [
        Pointer(ExceptionRecord.ExceptionCode),
        ExceptionRecord.ExceptionAddress
      ]));
  end;
  Writeln;
end;
It should turn out like this:
In summary:
Basically, this is all I wanted to tell about the debugger implementation. There are a few unrevealed topics, but they will be in the third part.
I regret that the article turned out to be very voluminous, but, alas, it did not work out to break it into smaller parts. At least I tried to give not dry facts, but to pay maximum attention to the nuances that are usually omitted in technical articles.
I hope there will be people who find this material useful :)
The source code for the article can be downloaded at this link: http://rouse.drkb.ru/blog/dbg_part2.zip
Well, in the third part of the article we will look at the debugger’s opposition to the application, which really doesn’t want to be debugged :)
And on this I really have everything.
© Alexander (Rouse_) Bagel
Moscow, November 2012