AWS CloudWatch: Custom Metrics
 Hi habravchane!
 Recently changed his job, but still absorbed in cloud technology. And now I will have much more projects, and with them the articles, I hope, are interesting.
So, it was necessary to create metrics for parameters that Cloud Watch can’t count. You can measure a lot of things, but, for example, take the Load Average. This strange but understandable parameter explains the state of the system. In general, we can evaluate server health by this condition. Naturally, not always, but as an example, LA is ideal.
What do we need for this?
1. Amazon CloudWatch Command Line Tools
2. Several scripts
Let's start preparations on the server.
- In the / opt folder, create a folder - aws
- Unpack the command line utilities in the / opt / aws / mon folder
- The key and certificate pk are **. Pem and cert are **. Pem. Put in the folder / opt / aws / keys
- We will direct the necessary folder with Java symlink to / usr / java / latest
First, we’ll understand how we will get the Load Average. I like this:
load_average=$(uptime | awk -F'load average:' '{ print $2 }' | awk '{ print $2 }')
load_average=${load_average%%','}
In this variable we save LA for 5 minutes (second).
Next, we need TimeStamp in a specific format:
timestamp=$(date -u +%Y-%m-%dT%H:%M:%S.000Z)
Well, the last thing is registering the metric value:
mon-put-data --metric-name "LoadAverage" --namespace "CustomMetric" --timestamp $timestamp --value $load_average
--metric-name "LoadAverage" - the name of the metric
--namespace "CustomMetric" - where this metric will be located
So, the final script with variables, perpetual loop and logging looks like this:
/opt/aws/cw_scaler.sh
#!/bin/bash
export AWS_CLOUDWATCH_HOME=/opt/aws/mon
export AWS_CLOUDWATCH_URL=https://monitoring.amazonaws.com
export PATH=$AWS_CLOUDWATCH_HOME/bin:$PATH
export JAVA_HOME=/usr/java/latest
export TOOLS_HOME=/opt/aws
export EC2_PRIVATE_KEY=$TOOLS_HOME/keys/pk-GWO6MOXPTCZA5EY7**********RSFJ.pem
export EC2_CERT=$TOOLS_HOME/keys/cert-GWO6MOXPTCZA5EY7**********RSFJ.pem
while [ true ]; do
load_average=$(uptime | awk -F'load average:' '{ print $2 }' | awk '{ print $2 }')
load_average=${load_average%%','}
timestamp=$(date -u +%Y-%m-%dT%H:%M:%S.000Z)
mon-put-data --metric-name "LoadAverage" --namespace "CustomMetric" --timestamp $timestamp --value $load_average
echo "$timestamp: Load Average $load_average" >>$TOOLS_HOME/cw_scaler.log
echo "" >>$TOOLS_HOME/cw_scaler.log
sleep 14
done
Do not forget about the init script to start / stop our mini-daemon:
/etc/init.d/cw_scaler-init
#!/bin/bash1
#chkconfig: 2345 55 25
# source function library
. /etc/rc.d/init.d/functions
#Set environement
export TOOLS_HOME=/opt/aws
start()
{
    $TOOLS_HOME/cw_scaler.sh&
}
stop()
{
    kill $(ps ax | grep '/opt/aws/cw_scaler.sh' | grep -v "grep"  | awk '{print $1}')
}
case "$1" in
	start)
		echo "Starting Cloud Watch scaler."
		start
		;;
	stop)
		echo "Stopping  Cloud Watch scaler."
		stop
		;;
	*)
		echo $"Usage: cw_scaler.sh {start|stop}"
		exit 1
		;;
esac
Well with actually what we got in the end? After 5-10 minutes, you will see the type of metrics in the Cloud Watch panel: CustomMetric, and LoadAverage in it:
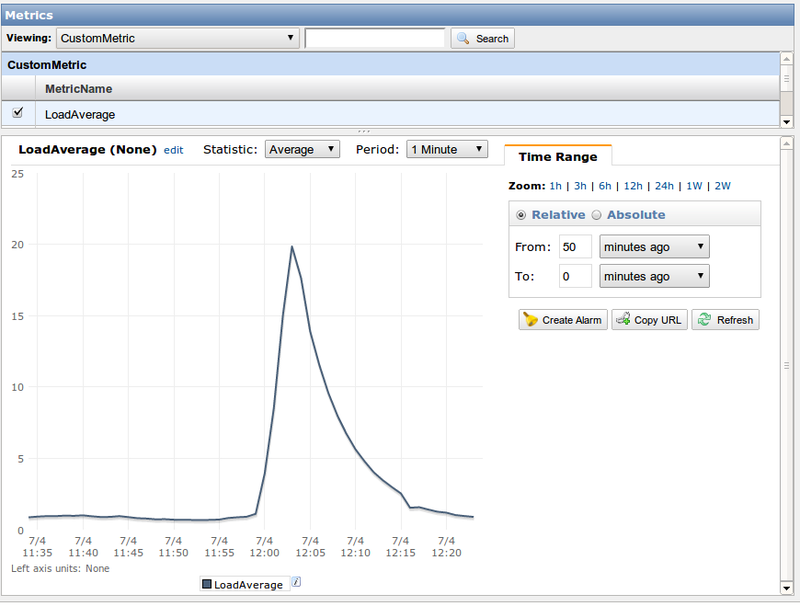
Yes, gentlemen, everything is very simple, and you can take any kind of data that can be transferred in numerical terms and based on them build autoscaling.
Threat. If you notice, this is my first article on the EPAM Systems corporate blog. Please love and respect! =)