Top-Down approach. Product economics. Gross profit
For over 5 years I have been analyzing products, marketing, management decisions in IT companies or companies with a lot of IT support. I decided to systematize my knowledge and write a series of articles on the organization and conduct of product analysis. I will touch on the topic of assessing the economy, the effectiveness of features, arranging relationships with marketing, databases, assessing customer behavior and all that.
The key task is to go through all the management tools and product evaluations, discuss the management, marketing and analytical tools used. Immersed in the application of Big Data and Machine Learning in the development of the product, determine the capabilities of these solutions and their applicability. This article opens a series of articles on product analysis.
Product economics
In order not to get lost in the tricks of evaluation of products and effects in them, it is best to start with a general picture. For this purpose, the Top-down approach is used, when we descend from the most general economic characteristics to atomic events occurring in the product. This approach allows you to always understand how each product characteristics are interconnected and always have a complete picture of the product.
Determining the contour for analysis is a key task. The economics of a product exclude a multitude of financial phenomena characteristic of the economy of an enterprise. We will start with the core of the formation of profits gradually increase the "meat" on it.
Product finances start with a simple formula:
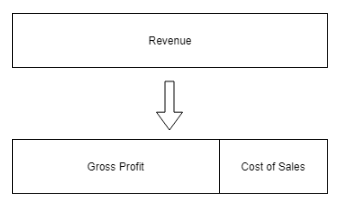
To determine gross profit, you need to correctly determine the sources of revenue and the sources of expenses directly related to sales.
Revenue - money or obligations to pay money that you receive from customers when selling your product. Usually this:
- Direct sale of goods / services
- Subscription fee, subscription fee
- Buying “electronic items” for games and applications
- Percentage of operation volume (service fee)
- One-time payment for access to the service
- Fee for the number of delivered advertising, set users, conversions, installations, etc.
Costs are the money we spent on the sales process. These costs include the direct costs of purchasing goods for sale, as well as services if they need to be purchased for each fact of sale. If you provide clean services (for example, you get money for a subscription to a game), then no direct costs can be included in your operating profit outline.
Tracking gross profit indicators is the first reporting that any product needs to have. It all starts with this chart:
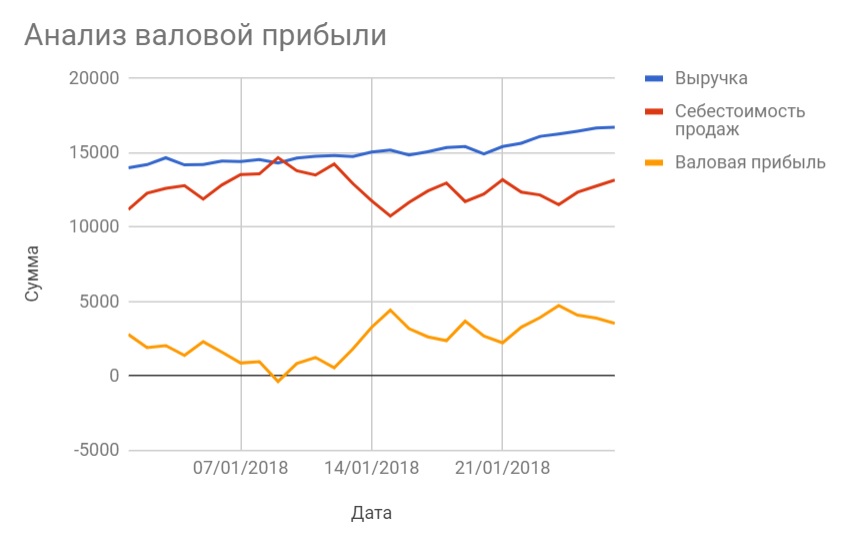
This indicator indicates your fundamental ability to generate profits.
From the point of view of product management, tracking gross profit, revenue and expenses is of interest only when:
- Sharp change in profit margins
- Long uniform trend of profit, especially long negative trend
- Reducing profits to zero or negative zone
Unfortunately, the indicator itself is the tip of the iceberg when analyzing the situation in business. But it is precisely into these characteristics that all the consequences of decisions taken and not taken are flooded.
As a manager, you do not control profit, revenue or direct costs. You control only the derivatives of these things — efforts to increase revenue, lower costs, grow LTV, and so on. That is why this data is "passive" of them can not make specific management decisions.
Total dynamics of revenue, expenses and operating profit:
Allows you to assess the situation at a very general level - everything gets worse / better, everything is bad
Almost no informed decisions on these data can not be taken
These data are a pointer to finding problems in other places (in the direction of revenue or expenses)
Other articles in the cycle: