June 13, 2012 at 14:19
Using eEPC notation to graphically describe business processes
Every thing is a form of manifestation of infinite diversity.
Kozma Rods
Introduction to eEPC Notation
Currently, there are many different principles for the graphical representation of business processes, called notations. Why are there many of them? This question has been asked for decades by anyone who is faced with the need to describe business processes. Let's deal with the reasons. There are three of them (in my opinion):
- Different tasks. Not all notations are equally convenient for solving various problems. For example, a notation may be convenient for a top-level business process and not at all convenient for describing a workflow.
- Different developers of such notations. At different times, different developers tried to come up with new principles for describing circuits. They did this out of good intentions, when in practice they came across a situation where the notation they use could not reflect the necessary subtleties (or not clearly). Sometimes in the process of evolution, such notations become as if parallel, i.e. look different, but the tasks are solved the same.
- The desire to stand out. This is when, for unknown reasons, a new notation suddenly appears, which does not have anything outstanding in itself, but, for some reason, promoted by its creator as the most perfect know-how. This is still happening.
The purpose of this article is not to consider all kinds of notations (I do not knowingly name them), but to dwell on the detailed description of the notation that I chose for my projects in the course of a long search for the most optimal option.
If someone is interested to know what other notations are and what they are used for, I plan to do this in another article, which will be called “Talk about notations,” but this is still in the plans.
It's time to start our story about a very interesting, simple and practical notation of eEPC (translated: an expanded description of the event chain of processes). Her literal translation reveals the main purpose: a description of the chain of business processes. The main "trick" of the notation in its principle of "eventfulness", which we will consider in detail.
What are the benefits of eEPC notation:
- Firstly, this is not entirely pure notation. Those. if in some notations there is a rigid set of elements and rules for their use (otherwise everything will be confused), then the eEPC principle allows you to add your own elements. How is this ensured? Of course, there is a certain “core” around which everything is built, that is, a set of clear rules by which the scheme is built and by which it is then read. In addition, you can add your own element, include the rules for its use in your own corporate standard (to exclude initiative, which can confuse the scheme and complicate its readability) and that’s all! This is a very important point. In addition, any other restrictions and rules can be set in your corporate standard.
- eEPC contains logic elements. This allows you to build schemes with the conditions that are necessary to describe the activity ("if the agreement is agreed, then ...., otherwise ...")
- The simplicity of the elements allows you to draw diagrams both in software products and in any other way, even on paper, you will not get confused.
- eEPC is so easy to learn and understand that it can be used in real life activities, and not just gather dust in a closet. It will take about 2 hours to learn the rules (if the learner wishes).
Of course, like everything in this world, it also has drawbacks. But rational use minimizes them. The main drawback, in my opinion, is the fact that if we use simple tools (i.e. programs for drawing diagrams, and not for modeling business processes), then we do not have a single database of objects. In addition, it is difficult to control the inputs and outputs (it is necessary to precisely control them, i.e. to come up with a method of such control, if required). But, on the other hand, the use of tools for modeling complex business processes costs quite impressive amounts, and a project using them is measured in millions. And so we have a very economical and understandable tool. More precisely, this drawback relates specifically to the description method that I am considering, i.e. using MS Visio or similar software. If you will use specialized systems for describing business processes that support databases of objects, then this drawback can be avoided. Well, it's time to start ...
The main core of eEPC notation
As I already mentioned, the literal translation of the abbreviation eEPC conceals the concept of eventuality. This is a very important point on which the whole principle of constructing a circuit is built. So, there are two key concepts: “Event” and “Function”. When someone tries to draw their process in the form of an eEPC diagram for the first time, a question often arises, but how does an event differ from a function? You need to clearly understand this yourself, otherwise you will get an unpredictable result. So: an event is a fact of accomplishing something, moreover, having no duration in time, or this time tends to zero (or does not matter). Moreover, the event always necessitates the execution of the function, and the execution of the function always ends in an event. I will explain by example. The phone rings. The manager picked up the phone. In this case, “The phone rings” is an event. Telephone conversation is a feature. The conversation is completed (hung up) - again an event. Thus, the event chain is observed: Call - conversation - end of the call. And the completion of the call will probably require the implementation of a new function: recording the result of the call, etc.
Let's try to draw it. First you need to find out how the "Event" and "Function" elements are displayed.
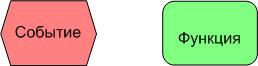
These two simple elements form the basis of the business process description rules in eEPC notation. I think I need to say a few words about the colors used. If you came across a description of processes in other notations, as a rule they were black and white. And rightly so, there should not be an explicit dependence of the content on color, because the scheme can be drawn in pencil on paper, printed on a black and white printer, etc. In this case (in the eEPC nti) it has so historically developed that the elements have certain colors. Not to say that it was necessary, but a habit is developed, and electronic perception is better - you can immediately see what is what. These colors can be considered as a recommendation. Why are they like that? I’m definitely not sure, but it seems to me that when ARIS made eEPC notation support in its product, it gave them such colors, they "took root". By the way, sometimes this notation is also called “ARIS”, “ARIS EPC”, which is not entirely true, because ARIS did not invent this notation, but made its support in its business process modeling program. In general, I recommend using colors. The main thing is that the form of the elements themselves should not be the same (i.e. differ only in color), because in black and white, this can cause confusion. There are other rules that allow you to give “harmony” to the eEPC diagram, we will talk about them. differ only in color), because in black and white, this can cause confusion. There are other rules that allow you to give “harmony” to the eEPC diagram, we will talk about them. differ only in color), because in black and white, this can cause confusion. There are other rules that allow you to give “harmony” to the eEPC diagram, we will talk about them.
So, there is an event, there is a function. How are they connected?
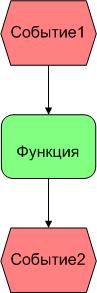 We see that event1 led to the need to perform some function that culminated in event2 . If applied to the example with a phone call, it will be like this: An
event bundle - a function - it is customary to display an event from top to bottom in one line or from left to right. The direction of the chain is indicated by connecting lines with arrows.
In order to make the diagram more visual, the notation provides several more standard elements:
We see that event1 led to the need to perform some function that culminated in event2 . If applied to the example with a phone call, it will be like this: An
event bundle - a function - it is customary to display an event from top to bottom in one line or from left to right. The direction of the chain is indicated by connecting lines with arrows.
In order to make the diagram more visual, the notation provides several more standard elements: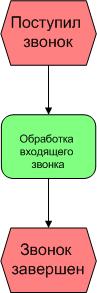
- Position (executor). The one who performs this function
- Information . Any information used to perform a function other than documentary. For example, a phone call, instructions for performing an operation, etc.
- The document . The “Document” element is intended for displaying information carriers (paper or electronic). Those. presentation of information in a specific structure.
- Program (application). The software used to perform the function.

All other elements are auxiliary, and are practically not regulated by the requirements of the eEPC itself. However, there are no barriers to adding your own elements. The main thing is to fix this in the internal standard so that there is a common understanding of how they look and why they are applied. Such an extension does not violate the requirements, if the link event-function-event is not violated, and is intended only to improve the perception of information or to adapt the description rules in any industry specifics. I added my own set of elements, which I will discuss below.
It is still necessary to find out how the elements considered should be arranged. All of these elements must somehow be associated with the function. This is a general rule: not a single element is associated with an event except a function.Those. All these elements must be connected by arrows with the function. As for the arrows and their directions: it is generally accepted that if there is no direction for transmitting information, then instead of the arrow, a simple line is displayed. If the information enters (enters the entrance), then the direction of the arrow from the object to the function, if it exits, then vice versa.
Just a couple of words about the location of these elements on the diagram and we can redraw our diagram, specifying the execution of the call processing function. There are no strict requirements for the arrangement of elements, but it is customary to display them equally on all schemes (for uniformity and harmony of the scheme). To unify the appearance of the graphical diagrams of business processes, such rules must be fixed in the internal standard and followed. A little later I will give some recommendations on this subject.
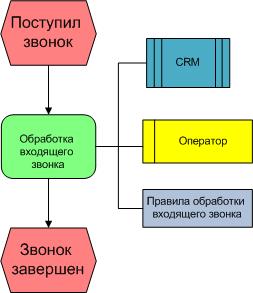
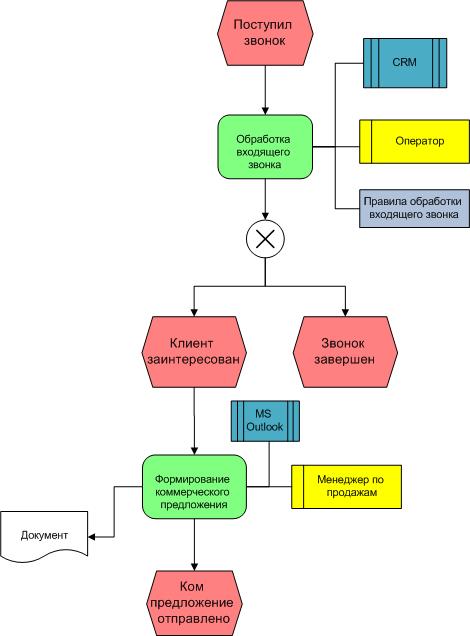
Now we re-draw our scheme: We see that the operator processes the incoming call, acting in accordance with the rules for processing incoming calls and uses the CRM program for this. Neither incoming nor outgoing documents are used. As I mentioned, one of the strengths of notation is the elements of logic. At the same time, this is one of the most difficult moments to understand. Therefore, first I will give an example, and then we will separately deal with the elements of logic.
Let it be like in our example: if the client is interested, the sales manager carries out further work with him and puts out a commercial proposal, which he sends by mail using the MS Outlook mail client. If there is no interest, then the call processing is completed. In real life, it would be nice to use the rules for ending a call, but I’m so, by the way, while it’s simplified. Here is the result:
Logic Elements in eEPC Notation Schemes
The elements of logic are simple, but there are some peculiarities and rules for the circuit to be logical and unambiguously interpreted. The most important rule that you must adhere to is 100%: logical decisions can only be made when performing a function . Those. after some event there can be no branching. Why? Because in this case it contradicts the very concept of an event - it is simple and instantaneous, without execution time. For example, if the phone rings, and the person sits thinking whether to pick up the phone or not, this will theoretically be a function where he makes a decision. But practically, including from common sense, he violates the rules for processing calls, because they pay him a salary so that he processes these calls, and there is nothing to argue here (in general, as shown in the diagram).
In total 3 logic elements are distinguished:
- And . When two or more events occur simultaneously;
- OR . When can one or several events happen, but at least one must happen necessarily;
- EXCLUSIVE OR . Either one or the other. Those. two options are simultaneously impossible.
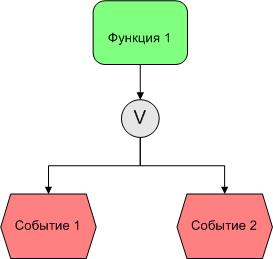
Here's how some look: As you can see, there are two options for graphically representing logic elements. They are no different, completely alternative. I brought them both, because in practice, both sources can be seen in various sources. Which one to use, you decide. I like the first one better. Now you need to understand the application of logic elements. First, consider the options encountered, then move on to the example. Let's analyze each element separately. The logical element "AND". When the execution of a function requires the simultaneous execution of several events: Example: If the reporting period is closed (event 1) and the deadline for submitting a report to the head (event 2), the employee prepares a monthly report.

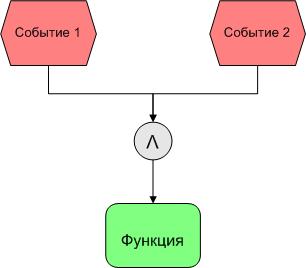
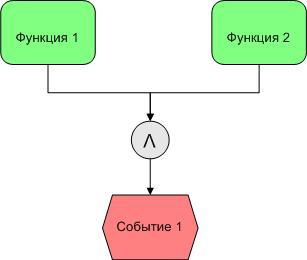
Connection of elements, if during the execution of a function several events occur: Example: Some work with the customer has been completed. Two events were simultaneously recorded: settlements were reconciled (event 1), the act was signed (event 2). In practice, this application is not common. As a rule, if in one function many actions are combined. The combination of elements, if during the performance of several functions, an event occurs: Example: The storekeeper collected the order (function 1), the operator wrote out the documents (function 2), the goods are ready for shipment (event). Connection of elements if the occurrence of one event leads to the performance of several functions: Example

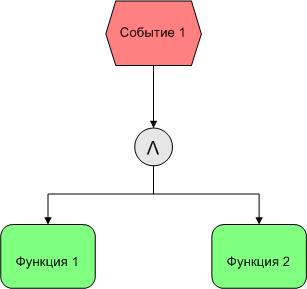
: Received a shipment (event). At the same time, the shipment of goods previously ordered by customers and the placement of the remaining goods in the warehouse begin.
The logical element "OR".
The combination of elements, if one of the events can cause the function to execute: Example : An application has been received by phone (event 1) or an application has been received by email (event 2) will make it necessary to process it. Connection of elements, if one function can cause at least one event: Example: An invoice has been prepared and sent for shipment to a client. The invoice could be sent by mail (event 1), by fax (event 2). Joining elements when several functions trigger an event: Example:

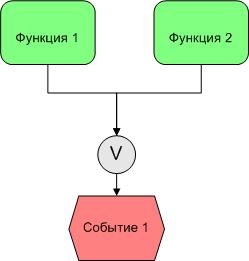
A service is provided (function 1) or a product is sold (function 2), a debt has arisen from the client (event 1).
Logical element "EXCLUSIVE OR".
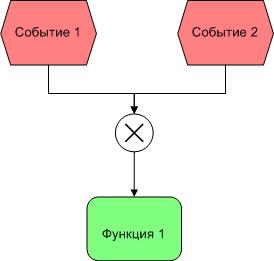
A combination of elements when one and only one of the events is necessary to perform a function: Example: A customer arrived in person at a store (event 1) or made an order via the Internet (event 2). You must ship the goods (function 1). Connection of elements, if as a result of the function execution a maximum of one of the events occurs: Example: The decision is either made or not. The connection of elements, if with the occurrence occurs after one and only one of the functions is performed. Example
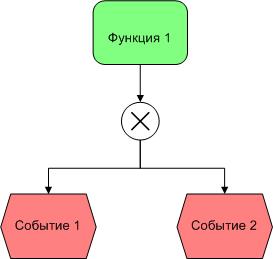
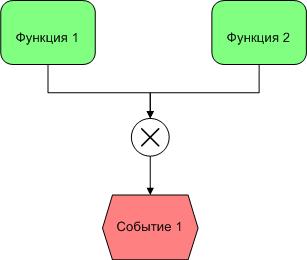
: The goods were delivered (event 1) either by our own transport (Function 1) or by the transport company (function 2) The
correct application of logic elements requires some practice. But it is not difficult. It should be noted that not all the combinations considered are widely used in practice (but in general this is determined by the analyst’s way of thinking).
Try putting logic elements into practice. If there are difficulties, write to me, I will try to help.
Extending notation with native elements
As I said before, eEPC is not exactly a notation, but description rules. And these rules do not prohibit adding your own elements to the diagram. The main thing is that these elements are understandable, and there is a document where such extensions of elements are fixed. For example, I use the following additional elements that arose gradually in the process of describing real processes for various tasks, from a simple description to setting tasks for automation. File with data . Used if a data file is created as a result of the operation or the file is used to perform the operation. Database. Used to describe information flows between automated systems. Card file.

Used to display a paper file or archive.
Material flow. Used to indicate incoming and outgoing material flows, as well as resources consumed during the process. The material flow is displayed to the left of the accompanying documents.
Information cluster Used to indicate structured information (entity representation). The diagram can be used to denote documents generated programmatically using custom applications. In this case, the Cluster element is located to the left of the corresponding document. Those. says that the user not only created a paper document, but also created an instance of it in the program.
Agreement on the rules for placing figures on the diagram
The eEPC notation itself does not impose strict requirements on the arrangement of elements relative to each other, although it is customary to draw a diagram from top to bottom or from left to right. If it is not possible to unify it in the case of several specialists, then a peculiar “vinaigrette” may turn out. To avoid this, it is recommended to develop and approve your own rules for the location of elements.
I adhere to (and recommend) the following rules:
- The sequence of events and functions is arranged from top to bottom (better) or from left to right (if there is not enough space);
- Elements denoting performers are located to the right of the functions;
- Incoming documents at the top left of the functions; arrow direction from documents to function;
- Outgoing documents to the bottom left of the functions; arrow direction from function to documents;
- The "Information" element is located at the bottom right of the function. If there is not enough space, an arbitrary arrangement is allowed, as close as possible to the function;
- The Application element is located at the top right of the functions. (if file storages that are not reports are used for this, they are displayed similarly). Communication without an arrow.
- The elements “Database” and “File cabinet” are arranged randomly;
- The “Material flow” element is located to the left of the documents accompanying it, snapping to the document with a line without an arrow;
- The “Cluster” element, when used in conjunction with the “Document” figure to indicate a document in electronic form, is located to the left of the corresponding document.
For example: A payroll calculator calculates a payroll based on the Brigadier Outfit documents provided to him. At the same time, he is guided by the document "Regulation on Wages", the calculation is made in the program "1C: ZiK." The result of the calculation is the document "Statement".
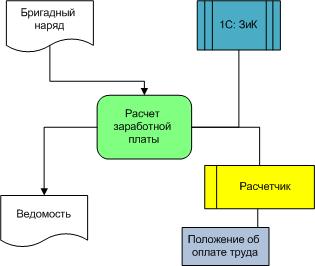
Chart Identification
As you know, a competent approach to the description of business processes involves their identification, i.e. when each process has its own code name. Accordingly, individual functions within the process also have their own names and identifiers.
The figures “Document” and “Function” are subject to mandatory identification on the diagram.
The document is identified by indicating in the upper left corner the code of the report or document in accordance with the registry. Documents received from suppliers of goods and services (incoming) are identified only by name.
The function is identified by indicating the sequence number of the function for this group of processes. Those. The function number always starts with the process group code. The issues of identifying process groups are beyond the scope of this article; we will consider them separately. Moreover, you should learn how to identify processes before you begin to describe them, otherwise there may be a desire to describe all the activities of the company in one diagram, as they sometimes try to do.
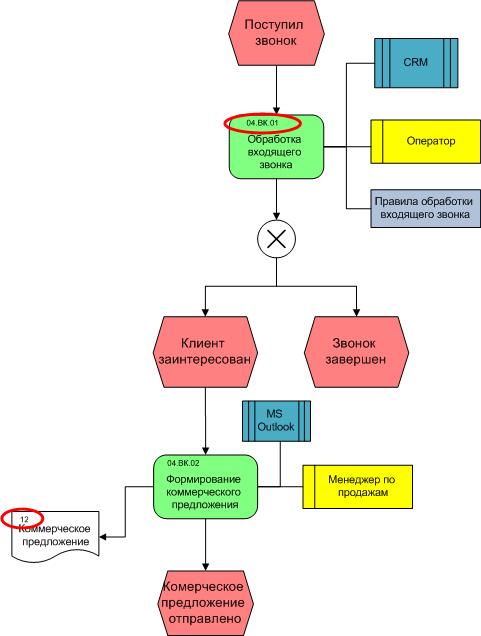
Therefore, now I will only show with an example how this can be represented in the diagram. Let's go back to the call processing example. Suppose that we assigned the code “04” to the sales department, the code “VK” for the processing of the incoming contact. Then the scheme will take the following form (identification is highlighted in red for clarity). The document code at the same time indicates the serial number of the document in the general register of documents (we will also consider this separately when we get to the examination of the document management system).
Feedback display
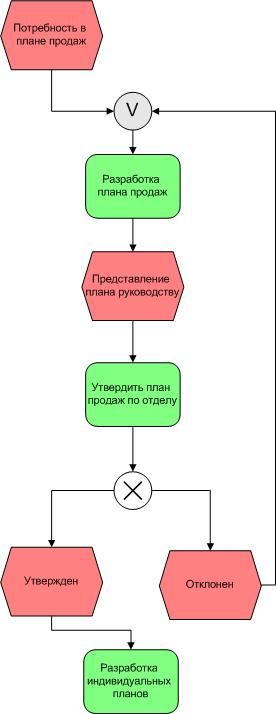
When constructing models, the need often arises for cyclic execution of a process under some condition or the need to reflect the activities of decision makers. In this case, we are talking about feedback.
To display control feedback, the principle of “direct inclusion” in the process of an additional control function with subsequent branching is used (the logical element “Exclusive OR” is used). For instance:
Text description of processes
No matter how hard we try to display the business process on the diagram, we won’t be able to achieve full detail, otherwise you can wallow in endless chains of elements and conditions. To avoid this, as well as add to the description of the process information that cannot be displayed graphically, the description is supplemented with textual accompaniment. To do this, develop various text templates that are filled in the description process. The forms of such templates can be different, include separate sections with descriptions of inputs and outputs, consumed resources, used software, etc.
In the simplest case, a business process description template may look like this:
| Buisness process: | Inbound Contact Processing | 04.VK |
| Process Functions: | ||
| Name | Description | Scheme number |
| Incoming call processing | When an incoming call arrives, the operator processes the call in accordance with the rules for processing incoming calls. It reveals customer interest, provides information about services | 04.VK.01 |
| Commercial proposal formation | In the presence of customer interest, the operator transfers the contact to the sales manager. The sales manager prepares a quotation and sends it to the customer by e-mail. | 04.VK.02 |
| Process indicators: | ||
| Name | Evaluation / Measurement Method | |
| Number of failures | Database Statistics | |
Outside of the scope of this article, such important topics as collecting information, highlighting business processes, decomposition, and highlighting indicators remain. We will definitely study these issues in future issues.