What are we doing online. Alternative version
Time counter
So, please love and favor - Time Counter . This is a browser extension that collects statistics about time spent on the Internet. I will not write loud and pompous words about what a wonderful product this is. Everyone will determine the degree of his “remarkableness” for himself, I will only describe the main points of his work.
Foreword
I want to say right away that initially I was not going to post this material on Habré. It seemed to me that my work was too insignificant and would not be interesting to the local public. But, after reading a recent blog post on the Opera Software blog, I realized that I was wrong.Idea of creation
The idea of creation appeared after reading a post on timeStats on Habré . Then I liked it, and I decided to make an analogue for "the best browser in the universe" - opera .Installation and use
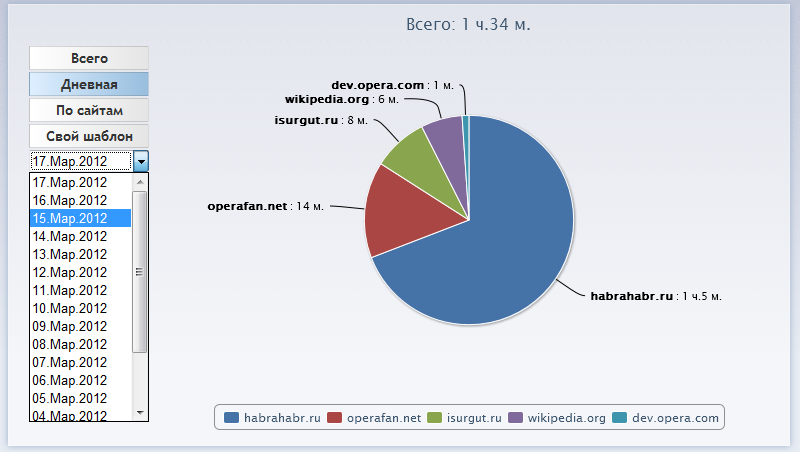
When installing the extension, a new badge appears on the panel with the signature 0:00 . This signature shows the daily stay on this domain. Accordingly, over time this value will change.
 At the moment, the extension can collect several types of statistics:
- Common
- Daytime
- Custom template (more on that below)
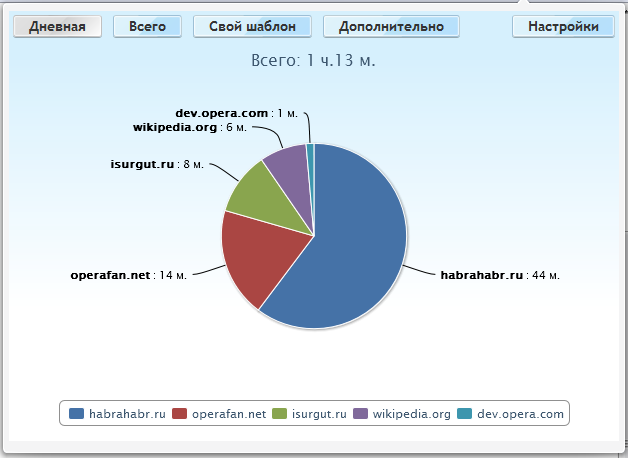
General and daily statistics
I think everything is clear here. By timer we count the time spent on the site and write it in memory. But my implementation of time counting is slightly different from the "competitors". The extension does not count every second, but every five seconds, and this is saved in the browser’s memory only if you spent more than one minute on the site per day. On the one hand, such an implementation gives an error on statistics. You can dial a few minutes with such "short" visits, but they will not be reflected in the statistics. But on the other hand, I do not see the need to record every second. As a result, all this “garbage” would begin to affect the speed of the browser. I chose speed, to the detriment of accuracy. Later I will still work on this.
Custom template
This is a fairly exclusive feature that I have not seen in anyone. The original idea belongs to operafan.net Dither , for which he thanks a lot. The meaning is that a person, if desired, can set his own template, according to which individual statistics will be collected.For example: you suddenly wondered how much time you spend on a particular blog on Habré. To do this, using RegExp , we create a separate template. And now, in addition to the daily and the general, separate statistics are collected on Habr's blogs.

* These statistics were collected before the changes on the hub Now, unfortunately, to collect such statistics probably will not work.
Graphs
All collected information can be seen on visual graphs. The graph of general statistics for the current day is in a pop-up window, and more detailed information is on the "additional" page. There, in addition to pie charts, you can see the schedule of visits to a particular site.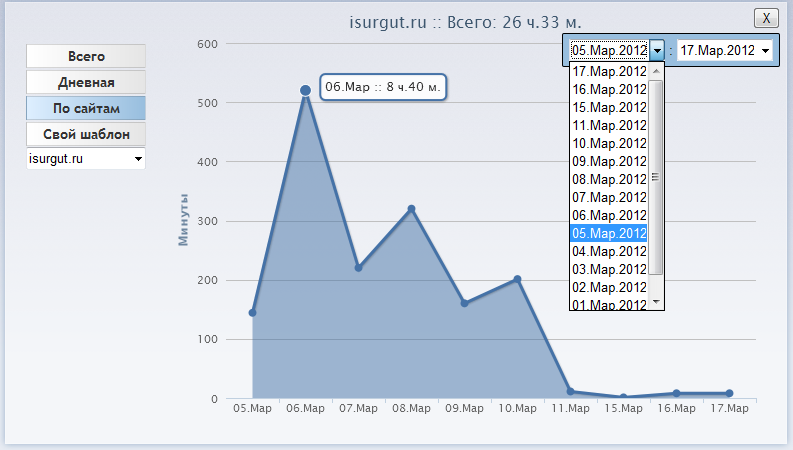
* The button on the top right allows you to select a period.
Settings
The extension has several simple settings. They are all contained on a separate page. I have an opportunity:- set "custom template".
- add or remove domains for which statistics will be collected taking into account three levels (by default, it is collected taking into account two levels of a domain).
- Reset all data. With protection from the "fool" (I myself somehow worn out and dumped everything by accident).

Some facts
- On the pie chart, not all sites are displayed, but only those that occupy more than 1% of the total time. The rest are placed in the item "other".
- All IP addresses are counted as LAN.
- Charts for general and daily statistics are clickable. By clicking with the mouse, the selected site opens in a new contribution.
- All graphs are made using the highcharts library .