June 1, 2012 at 16:05
Analysis of the global market structure using graph theory methods
Researchers at the Zurich Institute of Technology analyzed the global financial market using graph theory methods. Scientists tried to find the most influential, private financial structures. As part of the work, about 85 million companies were analyzed, dependencies between them were built and the most significant corporations were identified.
As a data structure, a weighted, oriented multigraph was chosen , constructed as follows:
The weighing process is as follows. The value of the company is written to the top of the graph. The edge is assigned a value in the range from 0 to 1, corresponding to the share of ownership of one company in another. For example, an edge connected the vertices A and B and had a weight of 0.51, then this meant that A owned 51 percent of company B. Obviously, to assess the influence of the company on the market, it is not enough to evaluate which vertices the edges coming out of it are connected with - it is necessary to consider reachability from one top to another. In this case, the numbers on the edges are multiplied (indeed, if A owns 50 percent of B, and B owns 50 percent of C, then A owns 25 percent of C, situation A in the figure).
A few examples of weighting are illustrated in the following figure:

Company information was taken from the databaseOrbis 2007 . The uniqueness of this repository is that it provides not only general information about a huge number of companies, but also individual characteristics of the enterprise, such as the structure of the company, risk factors, etc.
Three different methods were used to analyze the resulting graph:
As a result of the application of the above models, it became possible to identify components of strong coherence in the graph that correspond to the largest global holdings and corporations.
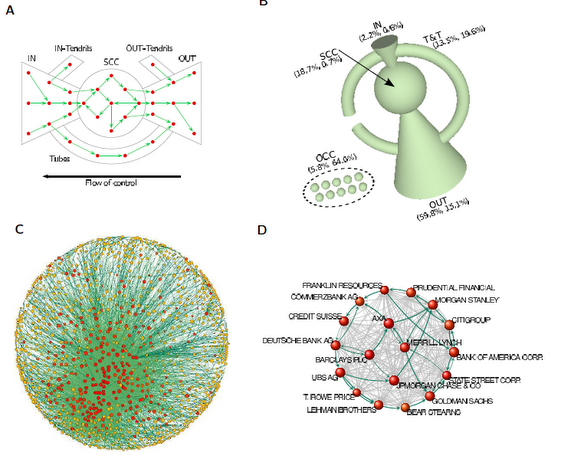
The result of the visualization of the work was a bow-tie diagram. The center of the “butterfly” is the component of strong connectedness, from which the dependent tendrils, which are subsidiaries, depart from.
conclusions
In my opinion, the results can be used for risk analysis and stress testing of both leading corporations and the entire world economy.
If the topic of financial risk analysis, stress testing is interesting, then I will try to prepare a short series of articles on the mathematical modeling of these processes (VaR, SVA, etc.).
A preprint of the article is available here .

Methodology for constructing data structures and analysis
As a data structure, a weighted, oriented multigraph was chosen , constructed as follows:
- Peaks - enterprises / companies
- Two entities were connected by an edge with a beginning at vertex A and an end at vertex B if vertex A belonged to the part indicated by vertex B
The weighing process is as follows. The value of the company is written to the top of the graph. The edge is assigned a value in the range from 0 to 1, corresponding to the share of ownership of one company in another. For example, an edge connected the vertices A and B and had a weight of 0.51, then this meant that A owned 51 percent of company B. Obviously, to assess the influence of the company on the market, it is not enough to evaluate which vertices the edges coming out of it are connected with - it is necessary to consider reachability from one top to another. In this case, the numbers on the edges are multiplied (indeed, if A owns 50 percent of B, and B owns 50 percent of C, then A owns 25 percent of C, situation A in the figure).
A few examples of weighting are illustrated in the following figure:
Company information was taken from the databaseOrbis 2007 . The uniqueness of this repository is that it provides not only general information about a huge number of companies, but also individual characteristics of the enterprise, such as the structure of the company, risk factors, etc.
Three different methods were used to analyze the resulting graph:
- Linear model. Control over the company is divided among all owners in proportion to ownership interests.
- Threshold model. The construction scheme is similar to a linear one, but only if the share of owners does not exceed the established threshold of “control” (in the study this value is 50%, but this is not always true). In the event that the company has a majority owner - that is, the entity that owned more than 50 percent of the company, then it completely passed under its control.
- Density Model In this model, control over the company is divided depending on the ratio of shares of all owners. In this case, for example, if one of the owners has a small share, but all the others have an even smaller share, then he can concentrate in his hands a significant part of the control over the company.
As a result of the application of the above models, it became possible to identify components of strong coherence in the graph that correspond to the largest global holdings and corporations.
The result of the visualization of the work was a bow-tie diagram. The center of the “butterfly” is the component of strong connectedness, from which the dependent tendrils, which are subsidiaries, depart from.
conclusions
In my opinion, the results can be used for risk analysis and stress testing of both leading corporations and the entire world economy. If the topic of financial risk analysis, stress testing is interesting, then I will try to prepare a short series of articles on the mathematical modeling of these processes (VaR, SVA, etc.).
A preprint of the article is available here .