October 21, 2011 at 12:56
Interpolation: drawing smooth graphics using PHP and GD
A common task for a programmer is to draw graphs. The input is an array of points (x i ; y i ). As a rule, we know only some values - at certain points in the graph. To build a continuous graph of the curve, you must resort to interpolation or approximation .

Interpolation - construction of a curve passing through given points.
Approximation is the approximation of a curve to the original, but not necessarily passing through given points.
In this topic I want to demonstrate my libraryfor PHP, which interpolates using the Lagrange polynomial, C-spline and Akima spline, as well as an approximation of the Bezier curve. Additionally, it implements the rendering of the segment with smoothing (anti-aliasing).
We briefly consider the interpolation and approximation methods.
The first thing that comes to mind is to connect the points by segments:
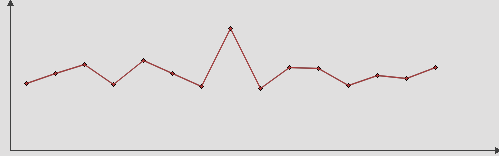
The best solution for speed, but the resulting schedule is broken - this is not what we need.
A polynomial of degree n for n + 1 points. Its formula is very simple: It is


simple to implement, but has two serious drawbacks:
1) it requires a significant amount of computation
2) it behaves unpredictably between given points (nodes)
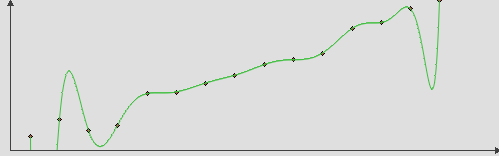
The cubic spline is free from the drawbacks of the previous method. For each interval between nodes, a polynomial of degree at most 3 is specified, while the first and second derivatives of the function must be continuous. On the one hand, this simplifies the calculations, and on the other, it avoids sudden jumps in curvature.
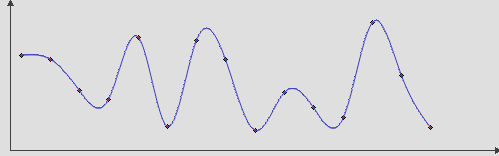
I ported the implementation of the cubic spline from a C # code taken from Wikipedia .
Cubic splines have a drawback: in the vicinity of a point far from the neighbors, such splines can make unexpected “outliers”. This problem can be solved using splines proposed by Hiroshi Akim. Please note that Akima’s spline is more stable:

I ported the implementation of Akima ’s spline from David Frey’s program code for debian aspline .
Sometimes it’s useful not to draw the curve through the given points, but use them as reference points. The Bezier curve method will help us in this (I ported the Tolg Birdal example from C # ). The curve passes through the first and last points

It was carried out for a graph of 500x500 size without rendering on the Xeon 5560 2.8GHz server, the number of experiments = 1000. Average execution time, s:
The following conclusions can be drawn from the above table:
1) The calculation time of the Lagrange polynomial grows rapidly with increasing number of points.
2) Akima spline works faster than cubic.
3) The construction of a Bezier curve is slower than splines.
Think first: do you even need to draw a curve between the points? If there are few points, can it be better to use a table? If you are dealing with statistics on grouping ranges (for example, the average temperature for months over long-term data), then it is better to use a histogram.
If you need to draw a curve through known points, I would recommend using the Akima spline. If the points themselves do not play a big role, then I would approximate the graph of the Bezier curve.
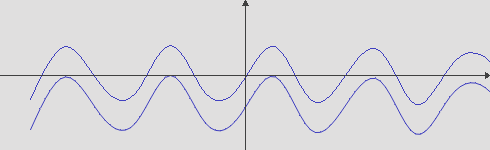
Creating a curve in the gd library can be done in segments. To do this, the curve is divided into sections with a certain step (at least 1 pixel) and between the beginning and end of the section we draw a segment with the imageline function. However, this segment of PHP will render without anti-aliasing. The algorithm for drawing a segment with screen smoothing comes to the aid - the Wu algorithm. The Wu algorithm can only draw segments at an angle of ± 45 °, so in other cases it has to be “rotated”. The figure shows a graph of the function sin (x) without anti-aliasing, and nothing below with anti-aliasing.
For each interpolation / approximation method, I wrote a separate class: LagrangePolynomial, CubicSpline, AkimaSpline, BezierCurve. Each class has 3 public methods:
setCoords (& coordinates, step, [x_min, [x_max]]) - sets the initial coordinates and parameters of the curve construction, returns false in case of an error
process () - returns an array of coordinates to construct the curve
getError () - returns an error message
Coordinates are transferred in the form of an array array (x1 => y1, x2 => y2 ... xn => yn)
For plotting, the auxiliary class Plot is implemented. Its capabilities are very modest (for example, there is no scaling - the graph is plotted 1: 1), so instead of it you can use another class or native PHP functions. Methods:
The constructor receives an array of coordinates.
drawLine (image, color, [x0, [y0]]) - draws a broken line, the image is the resource identifier, the color must be set to imagecolorallocate, x0 and y0 is the origin offset (by default, in the lower left corner of the image)
drawAALine (image , color, [x0, [y0]]) - draws a broken line with anti-aliasing of segments, parameters are similar to drawLine
drawDots (image, color, [x0, [y0, [size]]]) - draws points without connecting segments, parameters are similar to drawLine , size - diameter of the
drawAxis dots (image, color, [x0, [y0, [1sq]]]) - draws axes, the parameters are similar to drawLine, if 1s = true (default to), the axes are drawn only for the first quadrant - in the positive direction
Example (function sin (x)):
Download library and demo version
E.P. Kuzmin, D.V. Ivanov Algorithmic Basics of Computer Graphics (Lecture No. 4)
Interpolation with Splines
Original article by Akims
. Comparison of cubic and spline. Akims.
Bezier Curves Made Simple
Wikipedia:
Lagrange polynomial .
Cubic Spline
Bezier Curves
Interpolation - construction of a curve passing through given points.
Approximation is the approximation of a curve to the original, but not necessarily passing through given points.
In this topic I want to demonstrate my libraryfor PHP, which interpolates using the Lagrange polynomial, C-spline and Akima spline, as well as an approximation of the Bezier curve. Additionally, it implements the rendering of the segment with smoothing (anti-aliasing).
We briefly consider the interpolation and approximation methods.
Piecewise linear interpolation
The first thing that comes to mind is to connect the points by segments:
The best solution for speed, but the resulting schedule is broken - this is not what we need.
Lagrange Interpolation Polynomial
A polynomial of degree n for n + 1 points. Its formula is very simple: It is
simple to implement, but has two serious drawbacks:
1) it requires a significant amount of computation
2) it behaves unpredictably between given points (nodes)
Cubic Spline (c-spline)
The cubic spline is free from the drawbacks of the previous method. For each interval between nodes, a polynomial of degree at most 3 is specified, while the first and second derivatives of the function must be continuous. On the one hand, this simplifies the calculations, and on the other, it avoids sudden jumps in curvature.
I ported the implementation of the cubic spline from a C # code taken from Wikipedia .
Spline Akims
Cubic splines have a drawback: in the vicinity of a point far from the neighbors, such splines can make unexpected “outliers”. This problem can be solved using splines proposed by Hiroshi Akim. Please note that Akima’s spline is more stable:
I ported the implementation of Akima ’s spline from David Frey’s program code for debian aspline .
Bézier curve approximation
Sometimes it’s useful not to draw the curve through the given points, but use them as reference points. The Bezier curve method will help us in this (I ported the Tolg Birdal example from C # ). The curve passes through the first and last points
Performance testing
It was carried out for a graph of 500x500 size without rendering on the Xeon 5560 2.8GHz server, the number of experiments = 1000. Average execution time, s:
| Number of points: | 5 | fifteen | fifty |
| Lagrange polynomial | 1.789 | 5.664 | 20.446 |
| Cubic spline | 0.153 | 0.230 | 0.313 |
| Spline Akims | 0.017 | 0.024 | 0.049 |
| Bezier curve | 0.244 | 0.276 | 0.304 |
The following conclusions can be drawn from the above table:
1) The calculation time of the Lagrange polynomial grows rapidly with increasing number of points.
2) Akima spline works faster than cubic.
3) The construction of a Bezier curve is slower than splines.
Method selection
Think first: do you even need to draw a curve between the points? If there are few points, can it be better to use a table? If you are dealing with statistics on grouping ranges (for example, the average temperature for months over long-term data), then it is better to use a histogram.
If you need to draw a curve through known points, I would recommend using the Akima spline. If the points themselves do not play a big role, then I would approximate the graph of the Bezier curve.
Antialiasing
Creating a curve in the gd library can be done in segments. To do this, the curve is divided into sections with a certain step (at least 1 pixel) and between the beginning and end of the section we draw a segment with the imageline function. However, this segment of PHP will render without anti-aliasing. The algorithm for drawing a segment with screen smoothing comes to the aid - the Wu algorithm. The Wu algorithm can only draw segments at an angle of ± 45 °, so in other cases it has to be “rotated”. The figure shows a graph of the function sin (x) without anti-aliasing, and nothing below with anti-aliasing.
Library
For each interpolation / approximation method, I wrote a separate class: LagrangePolynomial, CubicSpline, AkimaSpline, BezierCurve. Each class has 3 public methods:
setCoords (& coordinates, step, [x_min, [x_max]]) - sets the initial coordinates and parameters of the curve construction, returns false in case of an error
process () - returns an array of coordinates to construct the curve
getError () - returns an error message
Coordinates are transferred in the form of an array array (x1 => y1, x2 => y2 ... xn => yn)
For plotting, the auxiliary class Plot is implemented. Its capabilities are very modest (for example, there is no scaling - the graph is plotted 1: 1), so instead of it you can use another class or native PHP functions. Methods:
The constructor receives an array of coordinates.
drawLine (image, color, [x0, [y0]]) - draws a broken line, the image is the resource identifier, the color must be set to imagecolorallocate, x0 and y0 is the origin offset (by default, in the lower left corner of the image)
drawAALine (image , color, [x0, [y0]]) - draws a broken line with anti-aliasing of segments, parameters are similar to drawLine
drawDots (image, color, [x0, [y0, [size]]]) - draws points without connecting segments, parameters are similar to drawLine , size - diameter of the
drawAxis dots (image, color, [x0, [y0, [1sq]]]) - draws axes, the parameters are similar to drawLine, if 1s = true (default to), the axes are drawn only for the first quadrant - in the positive direction
Example (function sin (x)):
// For convenience, let us define the sizes in advance
define ('GRAPH_WIDTH', 490);
define ('GRAPH_HEIGHT', 150);
// General abstract class SmoothCurve
include_once ('SmoothCurve.class.php');
// Cubic spline class
include_once ('CubicSpline.class.php');
// You can also use
// include_once ('AkimaSpline.class.php');
// include_once ('BezierCurve.class.php');
// Helper class for drawing graphs
// Instead, you can use your own or native PHP functions
include_once ('Plot.class.php');
// Set the coordinates in the array array (x1 => y1, x2 => y2 ... xn => yn)
$ testCoords [-215] = -24.2705098312;
$ testCoords [-145] = -9.27050983125;
$ testCoords [-110] = -17.6335575688;
$ testCoords [-75] = 30;
$ testCoords [-40] = -17.6335575688;
$ testCoords [-5] = -9.27050983125;
$ testCoords [30] = 28.5316954889;
$ testCoords [65] = -24.2705098312;
$ testCoords [100] = 0;
$ testCoords [135] = 24.2705098312;
$ testCoords [170] = -28.5316954889;
$ testCoords [205] = 9.27050983125;
$ testCoords [240] = 17.6335575688;
$ testCoords [275] = -30;
// Create a truecolor image (for anti-aliasing)
$ im = imagecreatetruecolor (GRAPH_WIDTH, GRAPH_HEIGHT);
// Set the colors
$ bgColor = imagecolorallocate ($ im, 224, 223, 223);
$ textColor = imagecolorallocate ($ im, 0, 0, 0);
$ axisColor = imagecolorallocate ($ im, 64, 64, 64);
$ dotColor = imagecolorallocate ($ im, 192, 64, 64);
$ graphColor = imagecolorallocate ($ im, 64, 64, 192);
// Background
imagefill ($ im, 0, 0, $ bgColor);
// Create a chart object
$ testGraph = new Plot ($ testCoords);
// Optional: draw known points
// Passing GRAPH_WIDTH / 2 and GRAPH_HEIGHT / 2 we shift the origin to the center of the image
$ testGraph-> drawDots ($ im, $ dotColor, GRAPH_WIDTH / 2, GRAPH_HEIGHT / 2, 5);
// Create a spline object
$ curve = new CubicSpline ();
// Pass it the coordinates, rendering step = 5
$ curve-> setCoords ($ testCoords, 5);
if (! $ curve-> getError ())
{
// Calculate the coordinates of the curve
$ curveCoords = $ curve-> process ();
if ($ r)
{
// Another graph object
$ curveGraph = new Plot ($ curveCoords);
// Draw the curve
$ curveGraph-> drawLine ($ im, $ graphColor, GRAPH_WIDTH / 2, GRAPH_HEIGHT / 2);
}
}
// Give the user
header ("Content-type: image / png");
imagepng ($ im);
imagedestroy ($ im);
?>
Download library and demo version
Todo
- You can combine setCoords and process () in one method - there is no use in separating them.
- Improve error handling.
- Antialiasing sometimes doesn’t work very well - a “ladder” is visible on vertical lines with a small pitch.
- Allow multiple Y values for one X for a Bezier curve.
- The Plot object must be made reusable - do not pass the coordinates to the constructor, as it is now.
- Add comments in code and documentation

Literature
E.P. Kuzmin, D.V. Ivanov Algorithmic Basics of Computer Graphics (Lecture No. 4)
Interpolation with Splines
Original article by Akims
. Comparison of cubic and spline. Akims.
Bezier Curves Made Simple
Wikipedia:
Lagrange polynomial .
Cubic Spline
Bezier Curves