The second generation AMD Ryzen: testing and detailed analysis
- Transfer
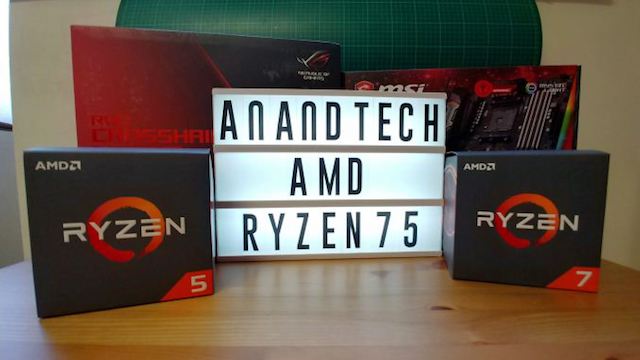
With the end of 2017, in which the Ryzen processor became one of the most successful AMD products, a logical question arose: what next? At the beginning of 2018, plans were announced: Ryzen of the second generation should appear in the middle of the year, after which the second generation of Threadripper will be released on the 12-nm process of GlobalFoundries. This is not yet the next AMD microarchitecture, which, as we know, will be the Zen 2 at 7 nm technical process. This release of components with some improvements, plus the ability to use the production process, which allows you to raise the limit of frequency and performance. Today, AMD launches four processors, we tested them all.
Right to the point: new processors
For readers who want to go straight to the point, we are reporting: AMD launches Ryzen 7 2700X, Ryzen 7 2700, Ryzen 5 2600X and Ryzen 5 2600.

Now Ryzen 7 2700X takes first place, shifting from the pedestal Ryzen 7 1800X, and at the price of an additional 10 W TDP provides a base frequency of 3.7 GHz and a turbo frequency of 4.3 GHz on eight cores with simultaneous multithreading. This is an additional +100 MHz and +300 MHz respectively, which is higher than the average overclocked 1800X.
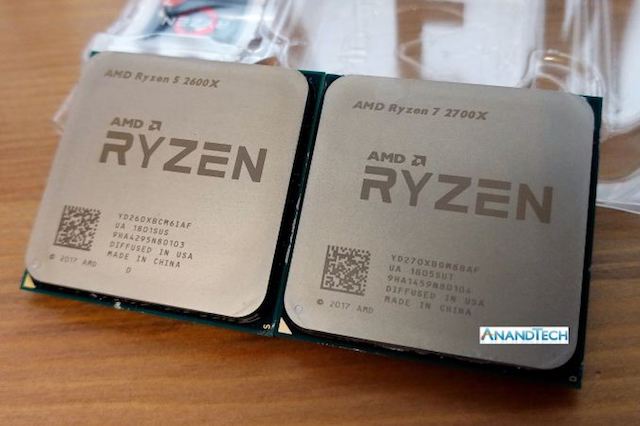
Important news: with the 2700X, AMD lowered the maximum cost of the top-end AM4 Ryzen processor: at launch, the 1800X cost $ 499 and was delivered without a cooler. Yes, most recently the 1800X fell in price to $ 349 to compete with powerful Intel processors. The 2700X has plugged both champions into the belt, entering the market with a suggested retail price of $ 329, plus it is bundled with the best business class cooler: AMD Wraith Prism RGB. AMD is strongly advancing on all fronts: aggressive pricing, maximum performance and the best equipment, all at once and in one product.
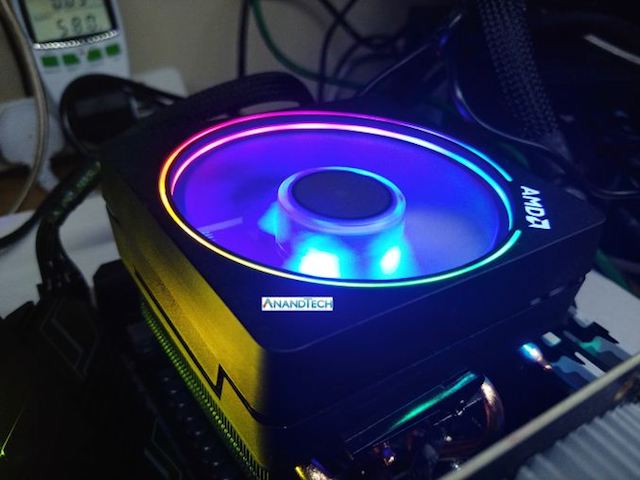
Ryzen 5 2600X is a six-core processor variant, also with an aggressive frequency strategy: 3.6 GHz and 4.2 GHz turbo. With a 95 watt TDP and a suggested retail price of $ 229, it comes bundled with an AMD Wraith Spire cooler, which, again, is a very impressive stock product.
The Ryzen 7 2700 and Ryzen 5 2600 are 65-watt versions of the X-analogs, offering almost the same frequencies for $ 30 cheaper. All processors will support dual-channel DDR4-2933 memory, which is higher than the maximum frequency support for 2017 DDR4-2666 Ryzen processors. One of the main changes is that now each processor comes bundled with a cooler, ranging from the Silent 65W Stealth models to the large Prism RGB, each of which is sufficient for the stable operation of the processor in turbo mode.
The planned AMD AM4 Ryzen line will now look like this:
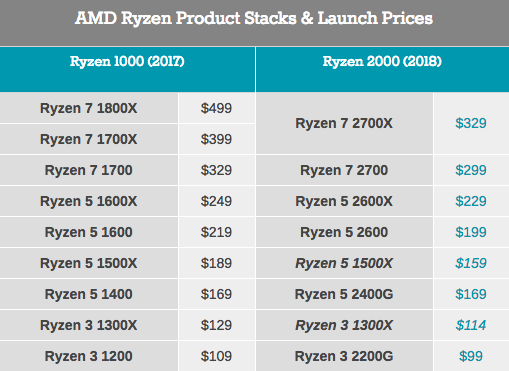
Taking off to the top of Olympus, the 2700X deprives the championships of 1700X and 1800X. AMD revised its product line and replaced three previous-generation products with two new Ryzen, possibly based on sales figures. As will be seen from our review, the 2700X squeezes everything from the current silicon process to the limit.
The complete list is ultimately a combination of Ryzen 2000 (new), APU Ryzen 2000 series processors, plus a pair of Ryzen 1000 series products. We have already studied APU in detail in recent reviews, and showed that they quite successfully replaced some of the original models of the first generations. So, four new 2000 series processors now occupy the top of the list, but AMD often focuses on new products, so over time (quite likely) several more new 2000 series products will appear.
Other information from today's review
Of course, our review is just beginning, because we have not yet talked about options. AMD uses the 12-nm manufacturing process of GlobalFoundries, the advantages of which are obvious. There are many firmware enhancements, updated features and roles for AMD Precision Boost and XFR technologies that can have a direct impact on performance. There is a new chipset (along with 30+ motherboards), ready to work with a new line of processors, as well as new or renamed functions, such as StoreMI. We want to explore how these new products fit into AMD's long-term plans and if they fit in with them as a whole.
Consider these questions in the article. Here you will find the test results.
AMD competitor Ryzen 2000: Intel's Coffee Lake
As part of the launch of the new product, AMD has provided extensive information on testing its new chips. From the presented data it was quite clear that the new processors are aimed to compete with the most modern Intel processors: Coffee Lake. This contrasts with the fact that the Ryzen 1000 series, which was released last year, contrasted the eight-core Ryzen 7 1800X to the Intel's 8-core Broadwell-E: around this time, Intel updated the main processor line to six high-frequency cores.
As a result, AMD now offers to compare the Ryzen 7 2700X with the Core i7-8700K and the Ryzen 5 2600X with the Core i5-8500K. This is an important point - now both major players in the x86 processor market have pushed their latest products against each other, head to head. This has not happened for several generations. Nevertheless, some indicators have remained in their places since last year’s issue:
- Intel is expected to have an advantage in frequency and IPC
- AMD will not lag behind in frequency and will offer more cores at the same price.
AMD's crown of multithreading is especially sparkling in internal testing, but the performance of a single thread is still lagging behind its competitor. A number of new features in the Ryzen 2000 series should remedy the situation: a slightly higher IPC, higher frequencies, a higher TDP, and an improved model of dynamic frequency boost. We will look at them on the next few pages.
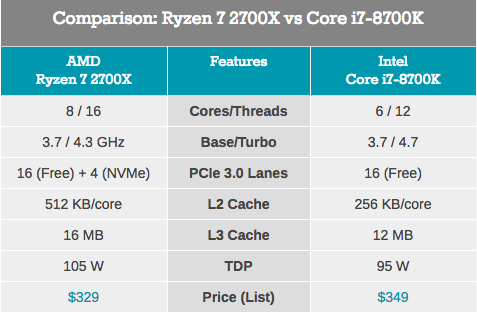
The frequency and number of cores are only part of the equation. The fact that AMD and Intel have different cache models will play a significant role. One of the points that we will see in this analysis is the comparative performance of the cache memory, and the tuning that AMD made to close the problem areas. As for the price, AMD Ryzen 7 2700X is cheaper than the i7-8700K, + the Wraith Prism RGB cooler is added, which easily replaces the cooler costing 30-40 dollars, saving the consumer money.

Ryzen 5 2600X and Core i5-8600K are more similar than their older brothers. These processors do not differ in the number of cores, although Ryzen 5 has twice as many threads. For any multi-threaded workload that is able to use simultaneous multithreading, this is probably an important indicator. Core i5-8600K has a slightly higher core frequency and, as expected, the advantage of IPC. Again, AMD offers a processor equipped with a good cooler, while Intel's offer is a “bare” processor.
In general, AMD states that its new high-end processors will show results in the range of 1-2% of competitors at 1440p games, but they will increase 20% in "creative performance". We have several ways to verify this.
Articles in this review:
- AMD launches the Ryzen 7 2700X, Ryzen 7 2700, Ryzen 5 2600X and Ryzen 5 2600
- Speaking of 12nm and Zen +
- Cache hierarchy enhancement
- Translated to IPC (instructions per cycle): all this for 3%?
- Precision Boost 2 and XFR2: Need more hertz
- New X470 chipsets and motherboards
- StoreMI way to faster JBOD
- Test parameters
- CPU System Tests
- CPU Rendering Tests
- CPU Web Tests
- CPU Encoding Tests
- CPU Office Tests
- CPU Legacy Tests
- Gaming Performance: Civilization 6
- Gaming Performance: Shadow of Mordor
- Gaming Performance: Rise of the Tomb Raider
- Gaming Performance: Rocket League
- Gaming Performance: Grand Theft Auto
- Conclusions: the burden of competition
Speaking of 12nm and Zen +
One of the highlights of the launch of the Ryzen 2000 series is that these processors use the GlobalLoundries 12LP manufacturing process, after the first generation of the 14th generation Ryzen processors. Both AMD and GlobalFoundries discussed the differences in the processes, but it is worth understanding that the goals of the companies are different: AMD should promote only what helps its products, while GlobalFoundries is a major semiconductor manufacturer with a large “customer base” and can provide figures and the “ideal scenario” data. This year we were invited to GlobalFoundries Fab 8 (upstate New York), where we were able to interview Dr. Gary Patton, Technical Director.

In this interview several interesting points were covered. Firstly, the technical director does not necessarily have to take care of how certain technical processes are called: their clients know the performance of this process regardless of the declared “nm” figure based on the development tools provided to them. Secondly: 12LP is just a slightly improved 14LPP process — minor changes to improve performance. The upgrade is obtained as a result of a partial optical reduction and a slight change in production rules in the back end and the middle part of the production process. In the past, such changes might not have caused such loud news, but GF customers want to take advantage of the improved process.
Overall, GlobalFoundries stated that its 12LP process provides a 10% improvement in productivity and a 15% improvement in element density compared to 14LPP.
This was interpreted in various ways, such as an additional 10% frequency at the same power or lower power for the same frequency, or as the ability to create smaller chips.
As part of today's launch, AMD explained what the transition to the 12LP process meant for the Ryzen 2000 series:
- Maximum clock speed growth at ~ 250 MHz (~ 6%)
- The cores work in turbo mode at 4.2 GHz
- ~ 50 mV decrease in core voltage
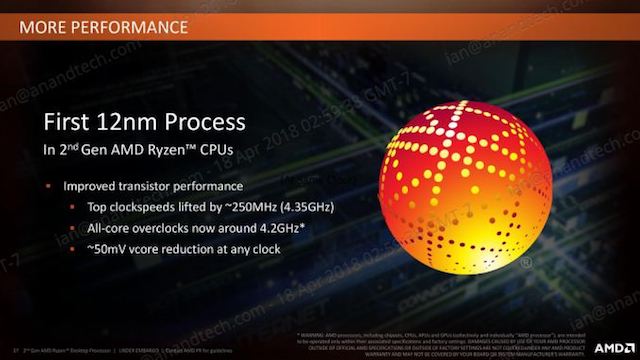
AMD patiently explains that at the same frequency, the new processors of the Ryzen 2000 series consume 11% less power than the Ryzen 1000 series, which means + 16% performance with the same power. Yet the statements are a bit ambiguous, since AMD has other new technologies in the 2000 series that will affect performance.
One interesting point is that, although GF claims that a 15% density improvement has occurred, AMD claims that these processors have the same matrix size and number of transistors as the previous generation. In the end, this seems to be counterintuitive - will AMD really not want to use smaller matrices to fit more chips per plate?
Ultimately, the new processors are almost exact replicas of old ones, both in terms of design and microarchitecture. AMD calls the design of Zen + cores to distinguish them from the design of the previous generation Zen, mainly because of the way microarchitecture functions are located on silicon. Many of the key functions have not changed - they just take up less space, leaving empty silicon between the elements.
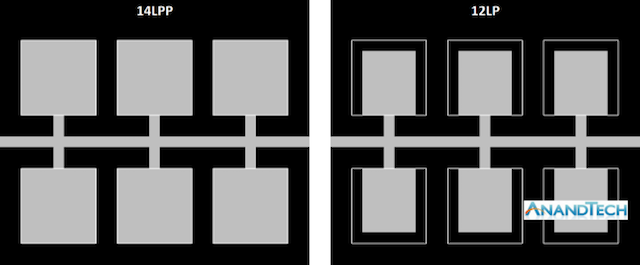
Here is a very rough representation of the functions associated with the data path. On the left is the 14LPP design, and each of the six functions has a specific size and connects to the bus. Between the elements there is a “dark silicon” - unused silicon, which is either considered as useless or can be used as a thermal buffer between elements with a high energy release. On the right is the 12LP design presentation: each of the functions has been reduced in size, simply leaving “dark silicon” between the elements (the white squares show the original size of the function). In this context, the number of transistors has not changed, as well as the size of the matrix. But if somewhere in the design there were thermal limitations due to the proximity of the “hot” elements, now there is more distance between them so that the elements do not interfere with each other.
For reference, AMD voiced the size of these new processors as 213 mm2, containing 4.8 billion transistors, identical to the design of the first-generation silicon. AMD confirmed that it uses 9T transistor libraries, as in the previous generation, although GlobalFoundries also offers 7.5T design.
So, Zen +: a new micro-architecture or a change in the technological node?
Ultimately, nothing in most of the physical design of Zen + is new. In addition to changing the production site and the likely minor adjustments, the main improvements are in the firmware and support:
- Correction of cache delays resulting in + 3% IPC
- Supports increased DRAM frequency for DDR4-2933
- Improved voltage / frequency curves resulting in + 10% overall performance
- Improved Performance with Precision Boost 2
- Better thermal reaction with XFR2
Cache hierarchy enhancement
The greatest internal change for Ryzen 2000 series processors is a reduction in cache latency. AMD claims that they were able to remove one cycle from the L1 and L2 caches, several cycles from L3, and improve the performance of DRAM. Since the net base IPC is closely intertwined with caches (size, latency, bandwidth), these figures lead AMD to claim that the new processors can provide a + 3% increase in IPC compared to the previous generation.

Numbers provided by AMD:
- 13% L1 latency improvement (1.10ns vs. 0.95ns)
- 34% L2 latency improvement (4.6ns vs. 3.0ns)
- 16% improvement in L3 latency (11.0ns vs. 9.2ns)
- 11% improvement in memory latency (74ns vs. 66ns on DDR4-3200)
- Support for increased DRAM frequency (DDR4-2666 vs. DDR4-2933)
Interestingly, in the official presentation, AMD mentions latency, measured as time, although in private conversations at our briefing it was discussed in terms of clock cycles. Ultimately, latency, as measured by time, can take advantage of other internal improvements; however, the real engineer prefers to discuss clock cycles.
Naturally, we looked at two aspects of this equation: are the cache figures lower, and do we get an increase in IPC?
So what about the cache?
For testing, we use the memory latency checker at every step of the cache hierarchy of one core. For this test, we used the following:
- Ryzen 7 2700X (Zen +)
- Ryzen 5 2400G (Zen APU)
- Ryzen 7 1800X (Zen)
- Intel Core i7-8700K (Coffee Lake)
- Intel Core i7-7700K (Kaby Lake)
The most vivid comparison between AMD processors. Here we have the first series Ryzen 7 1800X, the Ryzen 5 2400G APU, which combines Zen cores with Vega graphics, and the new Ryzen 7 2700X processor.
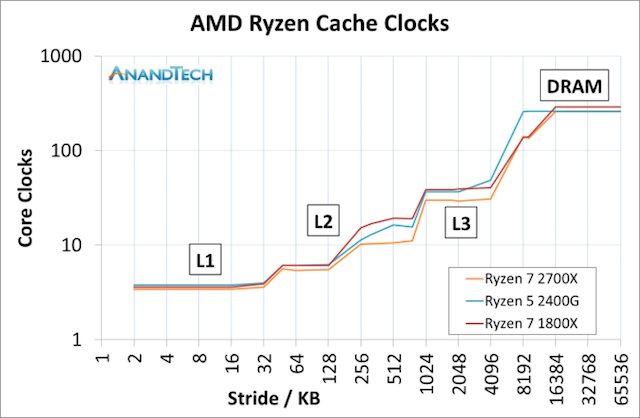
This graph is logarithmic in both axes.
This graph shows that the latest Ryzen 7 2700X requires fewer core cycles on each phase of cache design. The biggest difference is the L2 cache latency, but L3 also has a significant increase. The reason why the L2 gain is so great, especially between 1800X and 2700X, is very curious.
When AMD first launched the Ryzen 7 1800X, the L2 latency was tested and defined in 17 cycles. It was quite a lot - it turned out that engineers initially assumed that the L2-latency would have 12 cycles, but the lack of time to set up the firmware and layout, before sending the project to production, forced to leave 17 cycles as the best compromise, so that the design would be efficient and did not cause problems. With Threadripper and APU Ryzen, AMD has tweaked the design enough to achieve L2 latency in 12 cycles, but at the time this fact was not highlighted, despite the advantages it provides. Now with the Ryzen 2000 series, AMD has reduced latency to 11 cycles. We were told that this is due both to the new production process and to the additional settings that ensure the consistency of the signals.
The difference in L3 latency is a bit unexpected: AMD announced a decrease in latency by 16%: from 11.0 ns to 9.2 ns. We saw a change from 10.7 ns to 8.1 ns, which means a decrease from 39 to 30 cycles.
Of course, we could not do without comparing AMD with Intel. And the comparison was very interesting. The cache configurations between the Ryzen 7 2700X and Core i7-8700K are now different:

AMD has a larger L2 cache, but the AMD L3 cache is not an inclusive victim cache, which means that it cannot use prefetching as opposed to the Intel L3 cache .
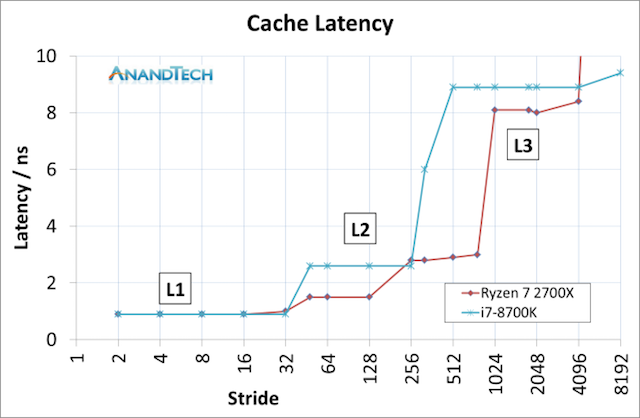
The result was unexpected, because it became apparent that AMD has the advantage of waiting time in L2 and L3 caches. There is a significant difference in DRAM, but the main performance indicators here are in the lower caches.
We can extend the test to include three AMD chips, as well as Intel Lake Lake and Kaby Lake cores.

This is a graph using cycles, not a time delay. Intel has a slight advantage in L1, but larger L2 caches in AMD Zen projects mean that Intel will achieve a higher L3 latency. And yet, Intel does its job quickly due to the low latency of DRAM.
Translated to IPC (instructions per cycle): all this for 3%?
Contrary to popular belief, increasing IPC is not an easy task. Attempting to ensure that each port is involved in each cycle requires extensive decoders, large instruction queues, fast caches, and the correct configuration of the execution port. It may seem that it is easy to compile, but both physics and economics say "no": the chip still has to be thermally efficient, and it should bring money to the company. Each processor design update will focus on what is called “low-hanging fruit”: small changes that bring the greatest gains with minimal effort. Usually reducing cache latency is not the easiest task, and for engineers not from the “semiconductor” sphere (including me), this generally sounds like a lot of work for a small gain.
For testing IPC we use the following rules. Each processor allocates four cores without additional threads, and the power modes are disabled, so the cores work only at a certain frequency. DRAM is configured as officially supported by the processor, so the new processors are DDR4-2933, and for the previous generation DDR4-2666. There have been recent debates on whether this is fair or not, and this is the opinion: this is an IPC test, not a system effectiveness test. Official DRAM support is part of the hardware specifications, as well as the size of the caches or the number of ports of execution. Running two processors on the same DRAM frequency gives an unfair advantage to one of them: it is either a large overclock / underclock or a deviation from the intended design.
So, for the test, the new Ryzen 7 2700X, the first generation Ryzen 7 1800X and the pre-Zen Bristol Ridge based on A12-9800, is based on the AM4 platform and uses DDR4. We use each processor on four cores, without multithreading, at a frequency of 3.0 GHz. We proceed to the tests.

In this graph, we used the first generation Ryzen 7 1800X as a 100 percent marker, and the blue columns as the Ryzen 7 2700X. The problem with trying to determine the increase in IPC by 3% is that 3% can easily get lost in the noise of the control run: if the cache is not fully set before launch, we may encounter different performance. As shown above, a greater number of tests fall within the range of ± 2%.
However, when calculating heavy tasks, the advantage was 3-4%: here is Corona, LuxMark, CineBench and GeekBench. We did not include the results of the GeekBench subtests in the above graph, but most of them show an increase of 2-5%.
If we take the Cinebench R15 nT result and Geekbench memory tests, the average gain for all tests will be + 3.1% for the new Ryzen 2700X. Sounds like jingle coins for AMD.
Returning to the result of the Cinebench R15 nT, which showed a 22 percent increase: we also had several other IPC tests performed at 3.0 GHz, but with 8C / 16T (which we could not compare with Bristol Ridge), and some other tests also showed a 20% + increase. This is probably a sign that AMD has also adjusted simultaneous multithreading control. This question requires further testing.
10% overall improvement
Considering the advantages of the 12LP production process, we wondered why AMD didn’t rework some elements of the micro-architecture to get even better results. In the end, it turns out that the “free-of-charge” increase in frequency is simply transferred to the same design (as mentioned earlier, the 12LP design is based on 14LPP with improved performance). In the past, such a solution might not have been mentioned as a separate product line. Thus, product promotion for the same design is an easy victory, allowing teams to focus on the next major core redesign.
Summarizing the above, AMD has already announced its intentions regarding Zen + Core - at CES at the beginning of the year, AMD said that it wanted Zen + and future products to go beyond the “industry standard” 7-8% performance each year.

Obviously, 3% IPC is not enough, so AMD combines performance gains with an increase in the frequency of +250 MHz, which is about another 6% increase in the peak frequency, with the best work in turbo mode with Precision Boost 2 / XFR 2. This is about 10 % increase, but at least on paper. Let's see what the tests say.
Precision Boost 2 and XFR2: Need more hertz
One of the most serious changes in the new Ryzen-2000 series is the implementation of the turbo mode of the processor. Up to this point (with the exception of the recent launch of the APU), the processors relied on the step-by-step implementation of the function: the system determines how many threads are loaded, tries to implement a certain frequency on these cores, if possible, and then refers to the reference table of the number of threads per frequency. The goal of AMD Precision Boost 2 is to make this process more dynamic.
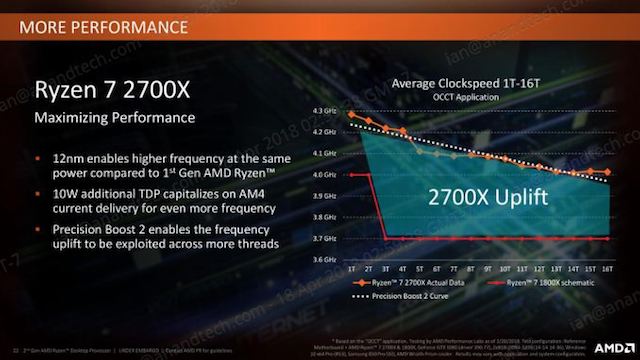
AMD's slide shows this feature: the system will determine how much of the performance margin is still available, and turbo the processor as far as possible until it reaches one of the limiting factors. These factors can be any of the following (although not only they):
- Total peak chip power
- Individual voltage / frequency response
- Thermal interactions between adjacent cores
- Power limits for individual nuclei / groups of nuclei
- General thermal characteristics
The new AMD Ryzen Master 1.3 software, used on the Ryzen 2000 series processor, has several indicators for determining marginal factors. For the most part, the way the processor is turbocharged and the response to the environment will be transparent to the user.

The best way to test this in action, from my point of view, is to look at the power consumption of the first and second generation Ryzen processors. We can consider the internal estimated power consumption of each core individually, since, fortunately, AMD left these registers open, and we received the following data:

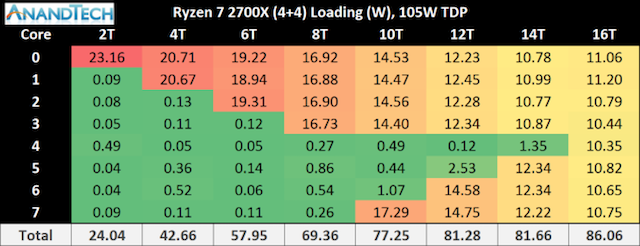
This is only the power consumption of the cores, not the entire processor, which will include a DRAM controller, Infinity Fabric and an IO processor. This means that we get numbers different from the nominal TDP, but the danger here is that the Ryzen 7 2700X is 10 W higher than the TDP than the Ryzen 7 1800X, where the 2700X consumes more power, and this may seem like a TDP response .
Building a graph of energy consumption gives the following picture:

Even in this case, it is clear that the Ryzen 7 2700X consumes more energy, up to 20 W, with a different number of threads. Let's change the graph as a function of peak power:

The results are no longer so obvious: it looks like the 1800X consumes as a percentage of the maximum power more with a low number of threads, but the 2700X consumes more on the average number of threads.
It is worth noting that the final result of Precision Boost 2 has two sides: better performance, but also increased power consumption. Users who want to place a low-power processor in a small form factor system may want to turn off this mode and return to the standard step-by-step function to control the thermal mode.
Note - despite the fact that the marketing name sounds like Precision Boost 2, the internal name of the function in the BIOS is “Core Performance Boost”. It is similar to Multi-Core Enhancement, which is a feature of some Intel motherboards designed to go beyond the limits of the turbo mode of the processor. However, this is just the standard PB2 from AMD: if you turn off “Core Performance Boost,” it disables the PB2. We initially turned it off, thinking that this is a motherboard manufacturer's tool to do some clean tests. It looks like a strange disagreement between engineers and AMD's marketing.
Extended Frequency Range 2 (XFR2)
For the Ryzen 2000 series, AMD changed the way XFR works. In the previous generation, it was used on some processors, allowing them to exceed the maximum frequency of the turbo mode, when the thermal situation contributes to higher frequencies and higher voltage in states with a low number of threads. The new generation XFR is still related to thermal conditions, but now applies to any load on the core: if the processor temperature is up to 60ºC, the frequency can increase independently of the maximum frequency of Precision Boost 2 (so why not get more from using PB2?). However, the core must still be in a suitable voltage / frequency range in order to maintain stability.

On some motherboards, such as the ASUS Crosshair VII Hero, there are additional options for supporting XFR2 beyond AMD. ASUS does not go into specific details, but I suspect that it implements a more aggressive version, perhaps expanding the voltage / frequency curve, raising the power limits and / or adjusting the temperature limit.
New X470 chipsets and motherboards
Focus on power
For our reviews of AMD products, we received two motherboards: ASUS ROG Crosshair VII Hero (Wi-Fi) and MSI X470 Gaming M7 AC. These are two high-end motherboards on the new X470 chipset.
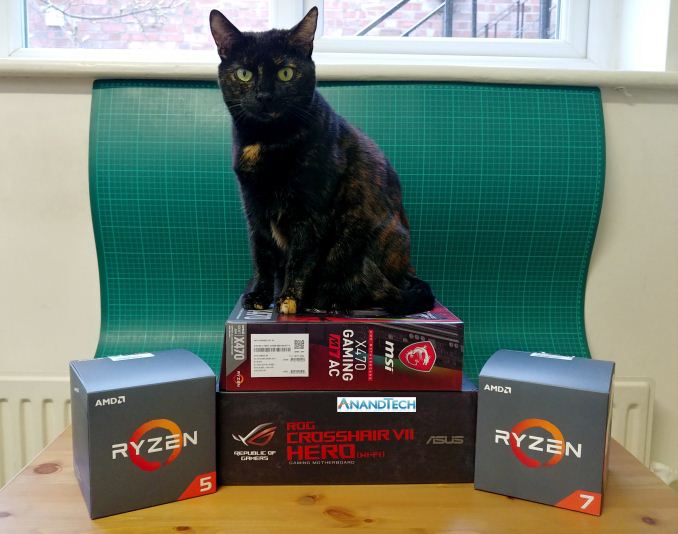
Katamari loves motherboards. Or just likes to sit on samples for reviews. The
new X470 chipset should take place above the X370 chipset, although, looking at the specifications, users may not even notice the difference. Technically, the X470 has the same PCIe and SATA support as in the older X370 chipset, and for a while AMD will implement both chipsets simultaneously for the mainstream motherboard manufacturers. Both motherboards will use the AM4 socket, which AMD has been supporting for several generations.

The main changes in the chipset relate to power consumption. Currently, the X370 chipset, built on a 55nm manufacturing process using ASMedia IP, runs on 6.8 watts TDP (at full load). Regarding X470, we were informed that this is the same process and IP, but the chip will now consume 4.8 W at its peak and 1.9 W in standby mode. This is due to an improved power infrastructure inside the chip, and AMD also claims that the overall throughput is improved. Chipset firmware is also tuned to provide better support for overclocked memory and its stability.
The next important component is StoreMI, to which we will devote the following article. This new option does not technically require support for the chipset, but the installer checks for the presence of the X470 chipset before granting a free license, otherwise the software will cost $ 20, and there will be no AMD branding.
All X470 boards and X370 boards with the latest BIOS updates will support the new Ryzen 2nd Gen processors. The new X370 motherboards, which have already updated the BIOS, will have the “Ryzen 2000 Desktop Ready” logo on the box, but the X470 motherboards support the new processors anyway.
AMD boot kit
For buyers of X370 / B350 / A320 motherboards with old firmware, AMD offers to solve the problem through the support page. Consumers should first try to replace the board with a new updated BIOS from a retailer, but in case of failure, users with registered purchases can get an AMD “boot kit” - an A-series processor for a short-term lease, which can be used to update the BIOS with their new processor.
AMD will provide the kit for free if the user:
- Will show a photo of a new 300 motherboard,
- Will show a photo of the new processor series Ryzen 2000,
- With model numbers / unique serial numbers in the frame and,
- A copy of the purchase invoice.
This means that users who want to take advantage of the Boot Kit will have to buy components at retail, and used ones. The kit includes an A-series processor (Bristol Ridge) and a cooler, as well as a prepaid label for returning equipment. Such a generous set for updating the BIOS of a motherboard is an unheard of suggestion. Prior to that, users had to solve the issue through the seller and pay for the RMA. However, it can be assumed that AMD has a sufficient number of A-series processors so that this is not a problem, and the positive response from such a service outweighs the cost of sending and returning.
Users who need the Boot Kit can follow this link to find official data.
X470 motherboards
Each manufacturer has already announced several new motherboards for the chipset, although it is clear that this is not a complete stack.


Most vendors will offer the X470 and X370 at the same time, and the X470 will occupy a niche premium product.
ASUS ROG Crosshair VII Hero
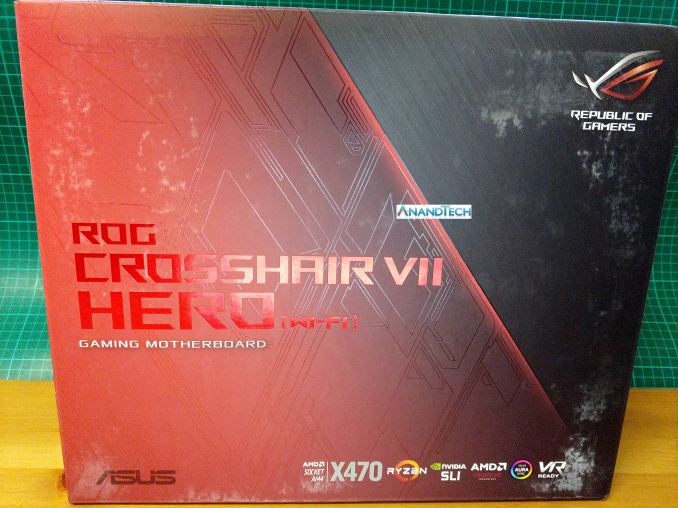
The first motherboard we discovered was ASUS ROG Crosshair VII Hero (Wi-Fi). The package turned out to be pretty shabby - either upon delivery or during storage.
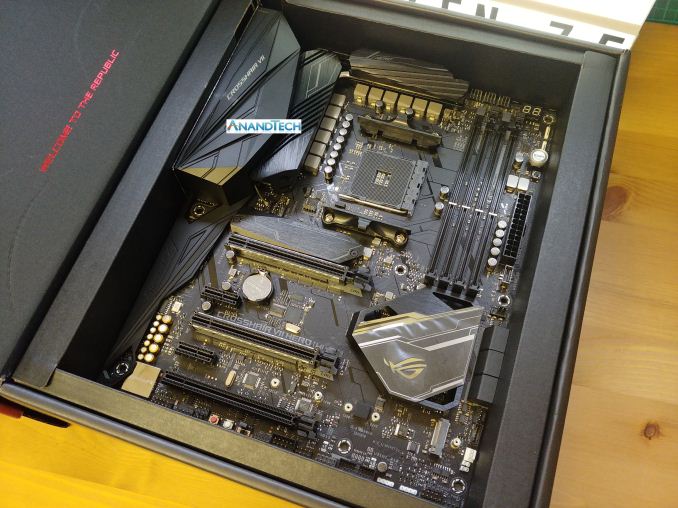
At first glance, we see several excellent options: a combined 12-phase power supply (most likely 10 + 2) on the CPU, with two M.2 slots and enhanced PCIe for working with SLI x8 / x8. The rear I / O panel is pre-attached to the system using a casing, and there is a small cable connecting the built-in LEDs on the motherboard.
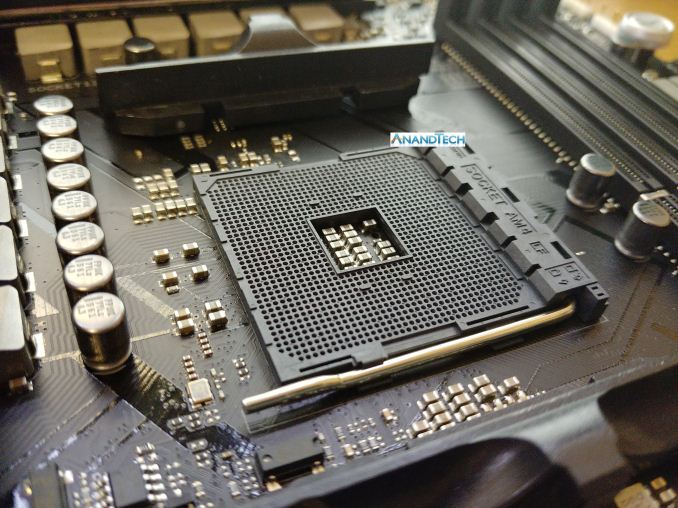
The socket has not changed: AM4 with a 1331 hole for the processor. The latch mechanism is the same as the size of the cooler.
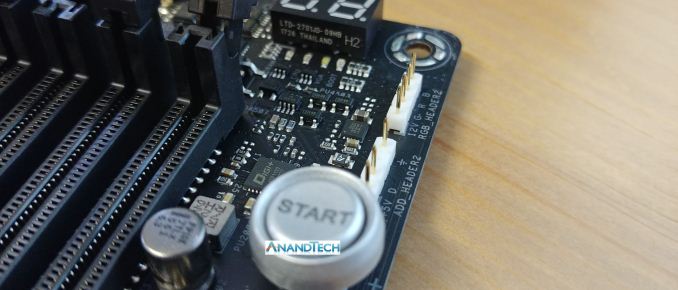
ASUS added a series of RGB connectors to the board, as well as something that looks like convenient voltage reading points (or points that allow using any 5-volt system, such as a cold cathode backlight?).
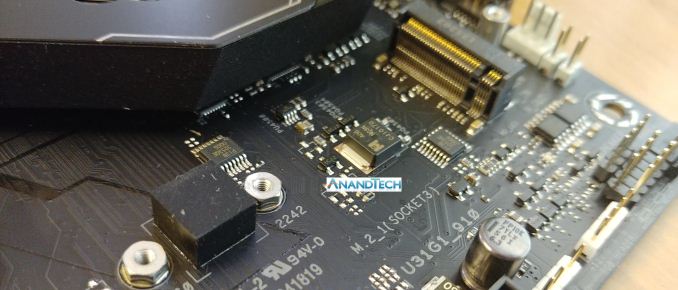
Of the two sockets M.2, one is PCIe 3.0 x4 from the CPU, and the other is PCIe 2.0 x4 from the chipset. There are also six SATA ports for connecting storage devices.
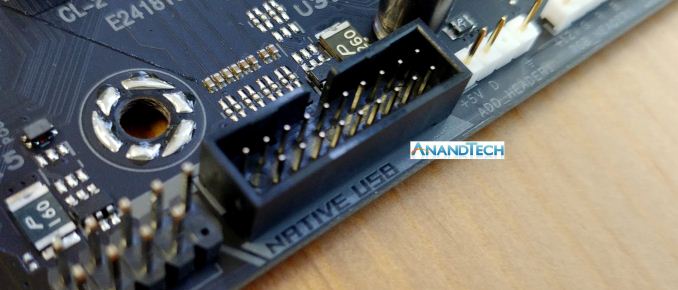
There are various USB 3.1, USB 3.0 and USB 2.0 ports on the board, although it seemed to me quite funny that ASUS decided to sign the “Native USB” ports to emphasize that this refers to the chipset and not to the controller. This makes sense for VR, which requires its own ports, which allows the user to install the front panel connectors into native USB connectors.

To make the premium board shine even brighter, ASUS has placed its SupremeFX sound card. It is based on the Realtek ALC1220A custom codec, Nichicon audio capacitors, EMI screens, PCB disconnection and a set of software.
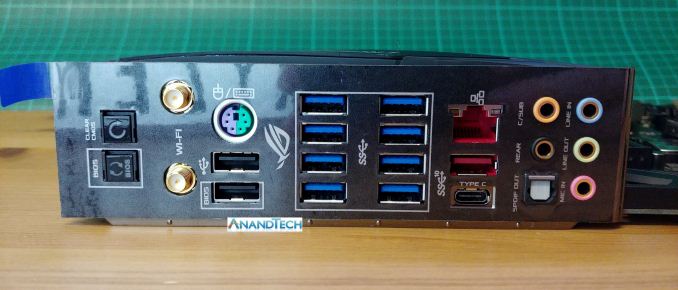
On the reverse side we have: the ASUS BIOS Flashback button, so that users can update the BIOS without installing CPU / GPU / DRAM; Clear CMOS button; 802.11ac Wi-Fi; two USB 2.0 ports; combined PS / 2, eight USB 3.0 ports, two USB 3.1 ports (one type C), a gigabit Ethernet port and audio jacks.
MSI X470 Gaming M7 AC
Unlike the previous one, the MSI X470 Gaming M7 AC package was not damaged, and the image of the motherboard was shown directly on the front side. Usually we are used to seeing the names “MSI” and “ACK” on Gaming M7 motherboards with Wi-Fi, which indicates the use of the Killer network controller, but not here.
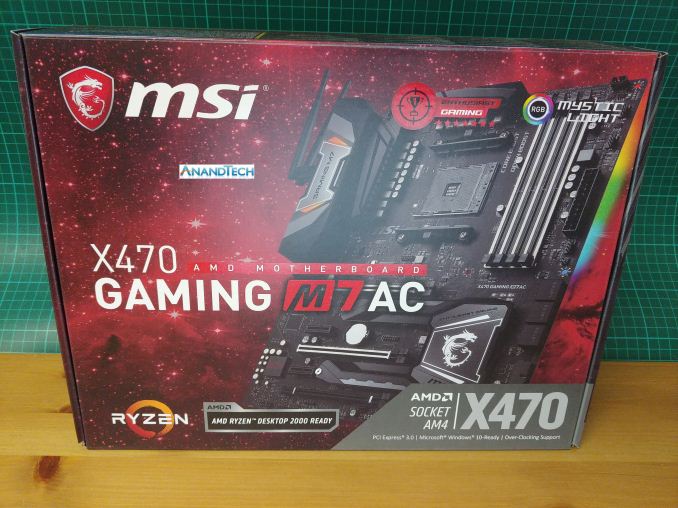

At first glance, the motherboard looks less focused on the “style” than ASUS, although MSI is also striking. Obvious features include DRAM support, multiple power chokes, and a U-shaped radiator that hides two M.2 slots.

A close look at the DRAM connectors shows that this is how MSI develops its concept of “enhanced memory slot”. We can argue whether the above concept makes sense (it certainly helps the PCIe), but there is clearly a place for aesthetics.

I calculated 14 chokes on this motherboard, and this is probably the largest power delivery option on any AM4 motherboard. The heat sinks are not connected together, which may indicate the cost, or MSI's confidence in the efficiency of the power supply. It is worth noting that MSI uses an 8-pin power supply to the CPU here, compared to the 8 + 4-pin layout on the ASUS ROG.

One of the most esoteric features of the latest MSI motherboards is this big handle, with numbers up to 11. This is MSI's Game Boost overclocking feature, designed in such a way that each turn gives a greater level of overclocking to the processor. Previously, such a function would be too heavy for most processors, in an attempt to increase the frequency as much as possible, previously we could never go beyond "2" with air cooling. Fortunately, there are power / reset buttons next to the pen.

The branded MSI Audio Boost 6 audio is not very different from the competition: Realtek ALC1220 codec with specialized audio capacitors, EMI screen and PCB connector. MSI adds software licensed from Nahimic, which offers various equalizer settings and additional benefits for gamers.

Like ASUS, MSI offers a BIOS update feature without CPU / GPU / DRAM installed. On the back panel, we see two USB 2.0 ports: a PS / 2 port, four USB 3.0 ports, a Wi-Fi 802.11ac module, two USB 3.1 ports, a Gigabit Ethernet port, and audio jacks.

A few interesting notes about the back panel of the board are near the chipset's radiator area, MSI posted a warning stating that the stand screws should not roll around the motherboard. Since most housings are designed to accommodate any form factor on the motherboard, users who use older housings and do not remove unnecessary support screws can cause a short circuit and, possibly, destruction of the hardware. Although, if the user does not remove the old support, I doubt that he will attend to reading the text on the back of the motherboard.

Here's a nice addition to the motherboard: the user is informed of the number of PCB layers. In this case, six. To be clearer, the cheapest motherboards usually have three or four layers, most of the main boards will have six or sometimes eight, and the high-end motherboards for desktop PCs usually have eight or ten. Motherboards for which price is not an argument, for example, server systems, can have twelve. Additional options, such as double copper or high humidity protection, can add + 50% to the cost of a clean printed circuit board.
StoreMI way to faster JBOD
When AMD released APU Ryzen at the beginning of this year, one of the minor announcements was the promotion of a software called FuzeDrive from Enmotus. The software was offered to consumers for an additional $ 20. For new desktop processors of the Ryzen-2000 series and the X470 platform, this software has become part of the AMD software stack and can be downloaded for free from the AMD website under the StoreMI brand.
Cache benefits
The principle of the StoreMI operation is that the user can take a mid-level system running on a slow disk and add a small but fast drive to increase the speed of working with the most frequently used files. The software creates a “storage system” from a fast and slow drive, providing the user with one disk with a total capacity of two disks, while the software implements pattern recognition to understand which files need to be placed on the fast disk for maximum system acceleration.
Multi-tier storage is not new - it is used in many enterprise storage systems supported by sophisticated software. Fast storage systems are somewhat costly, while data is usually large: content delivery networks (CDN), such as Netflix or Steam, use multi-level storage and caching. Thus, frequently used movies or games are available from the storage, which is located next to the user and at the same time is the fastest available.
In today's computer, the fastest storage is built-in memory / DRAM. Files and programs are loaded here, when the processor needs to access data or keep the data “close” for permanent access. This has been the case throughout the history of software. In recent years, some enthusiasts have used RAMDisks, creating disk space using RAM to get a fast repository. The only drawback of this method is that the data is lost upon reboot, because the data stored in DRAM is unstable (or not permanent).
A modern-day enthusiast's machine will most likely include some kind of solid-state drive (SSD) based on NAND flash memory: either a drive connected via PCIe strips, like super-fast storage, or connected via the SATA port. These users often have a mechanical hard disk, based on rotating plates, as backup storage for large volumes, usually called a hard disk (HDD), and speed is limited by how the system reads data from a disk that rotates at a speed of 7200 or 5400 times per second. Many machines still come with hard drives as main and mass storage, which is very troubling for users who are attracted by the advantages of using SSDs.
With StoreMI, a user can use any PCIe SSD, SATA SSD or HDD configuration and implement them as a multi-level drive. The combined single drive will have the capacity of all the drives in the stack, and the software will control which data should be moved to the high-speed drive. This process is gradual, the software will take time to find out which files are the most important - which means that the effect will not be noticeable immediately, but after the third or fourth download of software or games, the system should show good results.

The StoreMI tool also allows the user to add up to 2 GB of RAM to the storage stack. This process does not add extra capacity to a “single disk”, but DRAM acts as the fastest cache and will only store copies of data stored on other disks in order to avoid data loss. As mentioned above, since the internal memory is unstable, the in-memory cache will speed up when restarted. In a conversation with AMD, we were told that 2 GB is a good amount of memory for the DRAM cache: due to the nature of the software, a larger cache will not show a noticeable increase, according to the campaign. The software allows even systems with only 8 GB of total system memory to use the software.
Configurations
Unlike RST caching technology (which recently supported caching on non-boot disks), AMD's StoreMI can be used at any time during the system's life cycle. For any user who wants to postpone the purchase of an NVMe SSD or SSD SATA, or delay the purchase of a larger drive, it is possible not to hurry and add a new drive to the multi-level storage later.
StoreMI can support almost any configuration involving boot disks and storage disks. When working with a boot disk, AMD recommends installing the operating system on a slower and more spacious disk, and then adding a clean SSD as a quick access level, although the opposite is also possible for users who want to add a larger disk later (there may be additional steps for completion of the process). The only difference is that the software is likely to transfer a large amount of data at the beginning.

Configurations that are offered for the StoreMI:
- HDD + DRAM
- HDD + SATA SSD
- HDD + SATA SSD + DRAM
- HDD + NVMe SSD
- HDD + NVMe SSD + DRAM
- SATA SSD + DRAM
- SATA SSD + NVMe SSD + DRAM
- NVMe SSD + DRAM
The greatest noticeable improvement should occur in configuration 4, when the NVMe SSD is paired with a mechanical hard disk.
AMD says that if the storage stack extends from a native chipset to controller-based SATA ports, the software will most likely transfer sleep-related files to disk on native SATA ports to ensure stability; This process can take up to 30 minutes.
Users can also delete disks from multi-level storage if there is enough space to put all the data on the disk, which remains in the level. The deleted disk will remain with zero data and can be removed from the system or used for other purposes.
Serious limitation: 256 GB on Fast Tier
An important point not mentioned in our initial briefings, when FuzeDrive was launched with the APU, but clearly highlighted in the StoreMI user manual, is that the joint license from AMD and Enmotus stipulates that a faster disk in a level can be no larger than 256 GB
When adding a disk larger than 256 GB as a quick access level, the system automatically splits the empty disk, offering additional capacity as a separate drive letter.
Adding a capacious hard drive as a slower level to the SSD boot disk will only cause problems if the SSD capacity is more than 256 GB. Users in this case will need to transfer the operating system (using other software) from the SSD to the HDD, then boot the system from the hard disk, and add the (now empty) SSD as a quick access level.
Some users may decide that it takes too much effort - adding a 3 GB hard drive to a 512 GB SSD should not be so difficult. As a solution, leave the drives separated, and items such as the Steam folder, manually spread to different drives, leaving your favorite games on the SSD. However, StoreMI is more focused on systems that initially have a capacious hard drive - to add a small fast SSD, say, 64 GB-128 GB. Such a case is considered as the most likely.
Failure rate: JBOD deficiencies
Most of the options for combining disks in the array modify the element of speed (reading data on many disks simultaneously), and protection against failures (data is replicated or the parity bit is entered). Typically, the parameters of the storage array combine both functions, while focusing on one function to the detriment of another. For users who need to store files, one of the options for combining disks is known as JBOD or “just a bunch of disks”. JBOD does not offer any additional speed or protection against failures.
The JBOD array does one thing: it combines the disks into an array to display them as one common file space, and perceives the array as such. The inclusion of eight 10 TB disk drives in JBOD will be visible to the system as one 80 TB disk. However, it does not read or write to disks at the same time — JBOD will simply write data sequentially and read data from the disk on which they are located. As a result, it still works with only one drive, but if one of the disks in the JBOD array fails, the array loses its integrity and collapses. Without specialized tools, all data from the entire array, like the data on this particular disk, will almost certainly be lost. And if one drive has an average failure rate,
In this context, it is clearly seen that the StoreMI suffers from the same insufficient protection against disk failures. There is no mechanism by which data will be protected, and if one disk in the stack fails, data on all disks is lost. If the boot disk is a cheap SSD with a low-quality NAND, or the hard disk is outdated, then data loss on both drives is a real possibility.
Initially, I thought it was a serious problem. For example, if a user wants to place 10 disks on a stack, this could mean a disaster. However, the criticality of the problem was greatly reduced when I learned about the maximum size of the fast level of 256 GB. This means that most users, in all likelihood, will only be able to connect only two disks into one level. AMD’s response to the threat of failures was to show that users should use backups anyway, and no specific comments were made on increasing the failure rate of the dual-disk stack compared to a single disk. As StoreMI moves data between the SSD and the hard disk, an additional problem may occur. In this case, more data records on the SSD occur over time, than a standalone user’s bootdisk, the result is that NAND wears out faster. Neither AMD nor AnandTech takes this drawback seriously, considering that modern MLC and TLC solid-state drives do a very good job with managing damaged data blocks and have a built-in redundant representation.
And tests!
Currently, we did not have time to directly test the StoreMI, focusing on other projects and upcoming events. If we have time, we will provide a full-fledged StoreMI article.
Test parameters
Testing with installed Specter and Meltdown patches
For our testing of AMD AMD Ryzen 2000 processors and Intel processors, we used the latest version of Microsoft Windows with the latest updates, as well as BIOS microcode updates, to be sure that Specter and Meltdown vulnerabilities were patched as it could be. This means that some of the data used in this review is not comparable with previous reviews, but over time we plan to update our database with the latest fixes.
Test stand
In accordance with our policy of testing the processor, we take a premium-class motherboard suitable for a socket and equip the system with an appropriate amount of memory working at the maximum supported frequency of the manufacturer.
It is noted that some users dispute this approach, mentioning that sometimes the maximum supported frequency is rather low, or faster memory is available at a similar price, or that the use of supported frequencies may reduce performance. Although these comments make sense, in the end, very few consumers use memory profiles (XMP or others), as they require interaction with the BIOS, and most users refuse to support JEDEC speeds - this includes both home users and vendors who may want reduce the margin for a couple of cents or stay within the limits set by the manufacturer. Where possible, we will extend testing to add faster memory modules, either in this review or later.

Power analysis
One of the key debates around nutrition comes down to how TDP is interpreted, how it is measured and what it should mean. TDP or Thermal Design Power, usually used as the value of the required heat dissipation capacity for the cooler used, and not the power consumption. There are several subtle physical differences between these two concepts, but for simplicity, most users view TDP as the nominal processor power consumption.
What the TDP actually stands for is quite difficult to determine. For any Intel processor, the nominal TDP is the actual thermal dissipation requirements (or power consumption) when the processor is running at its base frequency. Therefore, for a chip such as the Core i5-8400, which is designed for 65 W, this means that the 65 W rating is applicable only at a frequency of 2.8 GHz. It is quite surprising that the official TDP value for the Turbo Core i7-8700 mode is calculated for 3.8 GHz on all cores, which is much higher than the specified base frequency. In truth, if the processor is limited in firmware to 65 W, we will see a maximum of 3.2 GHz if all the cores are loaded. This is an important point for thermally limited scenarios, but it also means that without this limit in firmware, power consumption is not tied to TDP:
In AMD, TDP is calculated somewhat differently. Previously, it was defined as the peak power consumption of the CPU, including the turbo mode, when loading all the cores (this is possible with a virus in the system). TDP is now a measure of cooling. AMD defines TDP as the difference between the temperature of the processor cover and the temperature of the fan intake divided by the minimum required performance of the cooler. Or, in other words, the minimum capacity of the cooler is defined as the temperature difference divided by the TDP. As a result, we get a sliding scale: if AMD wants to identify a cooler with a higher thermal performance, it will lower the TDP.

For Ryzen, AMD dictates that this temperature difference is 19.8ºC (61.8 ºC on the processor, when the fan inlet is 42ºC), which means that for 105 W TDP the thermal characteristics of the cooler must withstand 0.189 ºC per watt. With colder thermal characteristics of 0.4 ºC / W, TDP will be calculated as 50 W, or a value of 0.1 will give 198 W.
This ultimately makes AMD TDP largely a measure of cooling performance than energy consumption.
When testing, we are also dependent on the whims of the motherboard manufacturer. In the end, for some processors, the turbo modes are determined by the reference table. If the system uses X-cores, the processor must operate at frequency Y. Motherboard manufacturers not only can change this table in each firmware version, but Intel also stopped making this data official. Thus, we cannot say whether the manufacturer of the motherboard meets the specifications of Intel or not. In some reviews, we had three different motherboard manufacturers that have different lookup tables, but all three said they follow Intel specifications. Ok, good when everything is simple and clear.
If this is not enough, it is worth noting that we are also dependent on the whim of the case. Even in the case when two processors are produced in the same way, the reaction of processors to voltage and frequency can actually be very different. The stamp on the box is just a guaranteed minimum, and the actual performance or thermal characteristics of the processor can vary from this very minimum to something really, really good. Both AMD and Intel go through a process called “binning,” so that each processor from the production line is tested according to certain standards — if it exceeds the best standards, it is labeled as the best processor. If it does not meet these standards, it can be marked as something else. It is also known that if the manufacturer needs a larger number of middle-class processors, it can reduce the percentage of components that meet the high standard, and the same high-quality processors will be labeled as if they corresponded to the average standard. So the processor is a lottery.

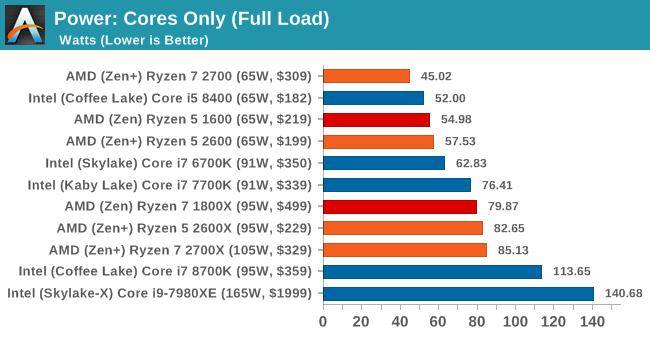
In our testing, we read the power values from the internal registers of the processor, designed to estimate power consumption and apply the parameters of the turbo and cooler. This method, strictly speaking, is not the most accurate - and therefore we will use our own multimeters. Yet the first method gives us more information than multimeters. Modern multi-core processors use different voltage plans for different parts of the processor or even for each core, so the software readings give us a good understanding of power sharing for different parts of the processor. It is very convenient if the processor makes such information available, but it is not always the case. In most situations, we can get only two main important parameters:
There is a very noticeable difference between Intel and AMD chips, the difference between the power of the cores and the power of the whole chip. AMD interconnect, Infinity Fabric, in combination with other non-core chip components, consumes much more power than Intel chips. And this, perhaps, leaves a larger supply of energy for Intel to raise frequencies. As was said, AMD ties power consumption to the TDP value: our Ryzen 7 2700 showed very high efficiency, although we seem to see averages on the Ryzen 5 2600. On the contrary, the Intel Core i7-8700K is very easy to break out of its TDP, while Older Kaby Lake processors are more in tune with their own TDP values
Our thanks
Thank you Sapphire for providing us with several AMD video cards. We met with Sapphire at Computex 2016 and discussed a platform for future testing with AMD GPUs on their equipment in several upcoming projects. Sapphire transferred a pair of RX 460, which we use as processor test cards. The amount of power consumed by the GPU can directly affect the performance of the CPU, especially if the processor has to spend all its time working with the graphics processor. The RX 460 is a very good card for our tests, as it is powerful, has low power consumption and does not require any additional power connectors. Sapphire Nitro RX 460 2GB still follows the Nitro philosophy, and in this case is a powerful card at a low price. Its 896 SPs operate at 1090/1216 MHz,

We also have to thank MSI for providing us with a GTX 1080 Gaming X 8GB GPU. Despite the size of AnandTech, providing high-performance graphics cards for CPU game tests on CPUs is quite a challenge. MSI very kindly provided us with a couple of their high-end video cards. The MSI GTX 1080 Gaming X 8GB graphics card is an excellent air-cooled product, taking place below the water-cooled Seahawk, but above the Aero and Armor versions. The card is quite large, with two Torx fans, an individual PCB design, Zero-Frozr technology, improved PWM and a large back panel for easier cooling. The card uses a GP104-400 silicon matrix on a 16-nm TSMC process, contains 2560 CUDA cores and can operate at a frequency of up to 1847 MHz in OC mode (or 1607-1733 MHz in Silent mode). The memory interface is 8 GB GDDR5X, operating at a frequency of 10,010 MHz. A very long time GTX 1080 remained card number 1.

Thank you Crucial for giving us the MX200 SSD. The critical component for our task, as the list of tests grows with new benchmarks and games, and 1TB MX200 - a strong help. Based on Marvell's 88S9189 controller and using a Micron chip with a 16-nm 128-Gbps MLC, these are 7-mm, 2.5-inch drives designed for 100K IOP random reads and 555/500 MB / s sequential read and write speeds . The 1TB models we use here support TCG Opal 2.0 and IEEE-1667 (eDrive) encryption and have a nominal endurance of 320 TB with a three-year warranty.

Thanks to Corsair for providing the AX1200i power supplies. The AX1200i was the first power supply to offer digital monitoring and control through the Corsair Link system, but under the hood it gives a rating of 1200 W at 50 ° C with Platinum certification. This ensures a minimum of 89-92% efficiency at 115 V and 90-94% at 230 V. The AX1200i is fully modular, with a larger 200-mm design, with double ball-bearing 140-mm fan for high-performance use. The AX1200i is designed as a workhorse with 8 PCIe slots for 4 x GPU systems. The AX1200i is also equipped with a Zero RPM mode for the fan, which allows you to turn off the fan if the power supply is operating under load less than 30%.

Thank you G.Skill for the memory provided. For many years, G.Skill has supported AnandTech in testing processors and motherboards, even if the review does not concern memory. We reported on their high-performance and high-frequency RAM sets, and that every year at Computex G.Skill there is a world overclocking tournament with liquid nitrogen right on the exhibition floor.

CPU System Tests
Our first test suite is general system tests. This test suite is designed to emulate for the most part what people usually do with a computer, such as opening large files or processing small stacks of data. This is somewhat different from our office testing, where industry standards testing is used. Also, some of the tests here are relatively new and unusual.
FCAT processing
One of the most interesting loads, which is used at our booth in the last quarters, is FCAT - a tool that we use to measure delays in games due to dropped or missing frames. The FCAT process requires the inclusion of a color overlay into the game, recording the gameplay and subsequent analysis of the video file using appropriate software. Such software is usually single-threaded, since the video is in a primitive RAW format, which implies a large file size and requires moving a large amount of data. For our test, we take a 90-second record of the Rise of the Tomb Raider test running on a GTX 980 Ti at 1440p, which is about 21 GB, and measure the time required for processing using a visual analysis tool.

FCAT is only a single-threaded task, and it shows the advantages of high-frequency components and high IPC from Intel. On the AMD side, the Ryzen 5 performs better than the Ryzen 7, but the results are within the margin of error.
Dolphin benchmark
Many emulators are related to single processor performance of the processor, and general reports usually suggest that Haswell has significantly improved the performance of the emulator. This benchmark launches a Wii program in which the beam tracks a complex three-dimensional scene inside the Dolphin Wii emulator. The results of this test are a completely reliable indicator of the speed of Dolphin processor emulation, which is an intense single-core task that uses most aspects of the processor. The results are shown in minutes, where the Wii itself showed a result of 17.53 minutes (1052 seconds).

Dolphin is also a single-threaded test and historically provides an advantage to Intel processors. The new Ryzen-2000 series, with increased IPC and frequency, is moving forward, overtaking Intel's Skylake.
3D Movement Algorithm Test v2.1
This is the latest version of the 3DPM benchmark we wrote. The goal of 3DPM is to simulate partially optimized scientific algorithms taken directly from my doctoral dissertation. Version 2.1 differs from 2.0 in that it transfers the basic structures of particles by reference, not by value, and reduces the number of double-> float-> double conversions performed by the compiler. This gives an acceleration of 25% compared with version 2.0, which means new data.

In this multithreaded test, the new 8-core Ryzen 7 2700X has risen another head taller than Intel's 8-core Skylake-X, compared to 1800X. However, the six-core Coffee Lake i7-8700K is sandwiched between the Ryzen 5 2600X and the Ryzen 5 2600.
Agisoft Photoscan 1.3:
Photoscan remains in our test suite from the previous test version, but now we are working in Windows 10, so features like Speed Shift on the latest processors come into play. The concept of Photoscan is the transformation of a set of 2D images into a 3D model — therefore, the more detailed the images are, and the more they are, the better the model. The algorithm consists of four stages: several single-threaded and several multi-threaded, and also has some dependence on the cache and memory. For some more varied workflows with multi-threaded features, options such as Speed Shift and XFR can take advantage of standby or idle CPUs, giving a significant performance boost on new micro-architectures.

Photoscan is a test with variable multithreading, the evolution from 1800X to 2700X shows that additional TDP and Precision Boost 2 can literally shave off minutes from the test. The slower Intel mesh architecture in Skylake-X on the 8-core 7820X compared to the Coffee Lake 8700K ring architecture means that two smaller cores on the 8700K allow it to rise higher, and yet it still loses about four minutes Ryzen 7 2700X. Intel needs a big 18-core processor to win, i9-7980XE.
Civilization6 AI Test
In our Civilization AI test, we use the Steam version of Civilization 6 and run an in-game AI test to process 25 rounds of late game preservation. We run a benchmark on our GTX 1080 at 1080p to ensure that rendering is not a limiting factor, and the results are shown as geometric average for 25 rounds in order to get the average processing time for one round of AI.

Although the AI test still uses several threads, however, the high single-core characteristics of Intel lead these processors to victory.
CPU Rendering Tests
Rendering tests is a long-recognized favorite of reviews and tests, because the code used by rendering packages is usually optimized to squeeze every bit of performance. Sometimes program rendering also depends heavily on memory — when you have many threads carrying tons of data, a memory with a low latency response can be the key to everything. Here we take some of the usual rendering packages for Windows 10, as well as some new interesting tests.
Corona 1.3
Corona is a standalone package designed to support software, such as 3ds Max and Maya, by photorealism using ray tracing. It's simple - you direct the rays, you get the pixels. Okay, a little harder, but this benchmark renders a fixed scene six times, and gives results in terms of time and number of rays per second. The official benchmark tables present user results in terms of time, but I believe that “rays per second” is the best indicator (and in general, the results, where “more means better”, are easier to explain). Corona likes to pile up threads, so the results are strongly dependent on the number of threads.

Blender 2.78
The oldest man in the world of rendering tests, Blender is still a very popular tool. We were able to run the standard workload on the February 5 Blender build, and measure the time needed to render the first frame of the scene. Blender is one of the largest open source tools, which means that both AMD and Intel are actively working to help improve the code base, which can be both beneficial and detrimental to their own microarchitecture.

This is the multi-threaded test in which the Skylake 8-core Intel processor outperforms the new AMD Ryzen 7 2700X; Blender's variable multithreading means that the grid architecture and memory bandwidth show themselves well. Although in terms of price and result, the Ryzen 7 2700X easily wins against the best performers. Ryzen 5 2600 easily bypasses the Core i7-6700K.
LuxMark v3.1
As synthetic, LuxMark may seem somewhat unreliable as a visualization tool, given that it is mainly used for testing graphics processors. However, it offers both OpenCL and standard C ++ mode. In this case, in addition to the comparison in each version of the encoding of the cores and IPC, we also see that the C ++ code and OpenCL show different performance on the same processors.


POV-Ray 3.7.1b4
Another regular benchmark in most sets, POV-Ray. Another ray tracer with a long history. As is often the case, during the preparation of AMD for the launch of Ryzen, the code base has been actively updated as developers make changes to the code and release new updates. Our test version was taken just before the start of such events, but over time we see that the POV-Ray code is being adjusted to meet new requirements.

Cinebench R15
The latest version of CineBench has also become one of those programs that have been used everywhere, in particular, as an indicator of the performance of a single thread. High IPC and high frequency give ST performance, while having good scaling and many cores is the result of the MT test.


Intel still remains a single-threaded champion in tests such as CineBench, but it seems that the Ryzen 7 2700X took the lead in a multi-threaded test.
CPU Web Tests
One of the problems when launching web tests is the habit of modern browsers to automatically install updates. This means that in any long period of benchmarking, the rule “update it outside the state of comparison” will always be broken, especially when browsers start updating, if you give them at least half a second to think about it. Despite this, we managed to find a number of commands to create a non-updatable version of Chrome 56 for our 2017 test suite. And although this means that we cannot keep up with the latest version of the browser, this makes the processor comparison scores comparable.
SunSpider 1.0.2: <a href=""> link
The oldest web test in this part of our review is SunSpider. This is a very simple JavaScript-based tool, and is ultimately a better measure of IPC and memory performance than anything else, with the majority of high-performance processors showing approximately equal results. The basic test performs 10 cycles and gives an average value. We perform this basic test 4 times.

Mozilla Kraken 1.1: link
Kraken is another Javascript-based test that uses the same test suite as SunSpider, but focuses on more rigorous real-world use cases and libraries, such as sound processing and image filters. Again, the main body of the test passes 10 cycles, and we perform this basic test four times.

Google Octane 2.0: link
Major browser developers, such as Google and Mozilla, know that JS maximum performance is often critical when compared with other OS developers. Just as SunSpider is a very early JS test, and Kraken is a bit newer, Octane tends to be more relevant for real workloads, especially in devices with limited capabilities, such as smartphones and tablets.

WebXPRT 2015: link
While the previous three tests perform calculations in the background, and then show points scored, WebXPRT is designed to better interpret the visual workloads experienced by professional users. For example, browser-based applications, graphics, image editing, data sorting and analysis, scientific analysis and financial tools.

CPU Encoding Tests
One of the interesting elements of modern processors is the coding performance. This includes encryption / decryption, as well as transcoding video from one video format to another. In the case of encryption / decryption, performance is still relevant for encrypting sensitive data "on the fly" - the process by which modern devices typically provide software security. The use of video transcoding to match the quality, file size and resolution of a video file has been booming lately. This is necessary to fit the video for the consumer device, or for game streamers who wish to download the transcoded video stream from the camera in real-time mode. As we move to live 3D video, this task will be even higher priority, and it turns out
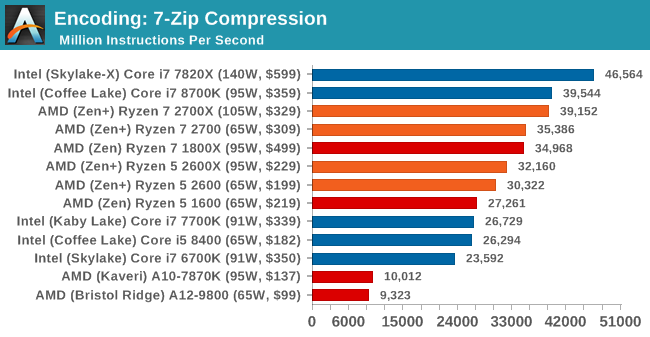
7-Zip 9.2: link
One of the frivolous archivers, allowing to evaluate the performance of processors, is 7-Zip. It is open source licensed and is a fast and easy-to-use tool for advanced users. We run the test mode via the command line, execute four cycles and get the result.


WinRAR 5.40: link
For the 2017 test package, we will use the latest version of WinRAR in our archiver test. WinRAR is more user-friendly in some aspects than 7-Zip, so we decided to include it in the package. Instead of using the benchmark mode, as is the case with 7-Zip, here we take a set of files representing a common stack (33 video files of 1.37 GB, 2834 smaller files in 370 folders of 150 MB each) in compressible and incompressible formats. The results shown are the time taken to encode the file. Due to DRAM caching, we run the test 10 times and get the average for the last five launches when the benchmark is in a steady state.

WinRAR requires a good memory base, so we see that four-channel processors top the list. High IPC Core i7-8700K also works great.
AES Encoding
Algorithms that use AES encoding have spread widely throughout the world as a ubiquitous encryption tool. However, this is another test-for-CPU, and modern CPUs have an extension of the AES command system to increase encryption performance. We often consider scaling both in frequency and in nuclei using this benchmark. We use the latest version of TrueCrypt and run it in benchmark mode with 1 GB of data in DRAM. The results shown are the mean GB / s for encryption and decryption.

HandBrake v1.0.2 H264 and HEVC: link
As mentioned above, video transcoding (both encoding and decoding) is a hot topic in terms of performance, as the pace of new content creation increases. The first assumption is a change in the video formatting standard, which can occur with or without loss of quality. It is also possible to reduce the quality of the video in favor of the file size. Along with Google's favorite codec, VP9, there are two other frequently used ones: H264, the old codec, is almost everywhere and optimized for 1080p video, and HEVC (or H265), which aims to provide the same quality as H264, but with lower file size (or higher quality for the same size). HEVC is important because it is capable of streaming video as 4k,
Handbrake is the preferred transcoding tool, so our test mode covers three areas.
H264 low quality / resolution: here we will re-encode 2-hour 640x266 H264 video and change the encoding from Main profile to High profile using the very-fast preset.

H264 high quality / resolution: a similar test, but this time we take a ten-minute double 4K file (3840x4320) displayed at a frequency of 60 Hz and recoded from Main to High using a very-fast preset.

HEVC test: using the same video in HQ, we change the resolution and codec of the original video from 4K60 to H264 to 4K60 HEVC.

For transcoding large video, the previous generation HandBrake has a problem with the new Ryzen-2000 series processors, but even with that in mind, the Core i7-8700K is ahead with a decent margin. The Core i5-8400 also performs well, but is inferior to the Ryzen processors.
CPU Office Tests
The office programs we use for benchmarking are not specific programs, but industry standard tests that weigh in the professional environment. The purpose of these tests is to use a set of programs and methods that a normal office user may encounter, for example, video conferencing, document editing, architectural modeling, and so on and so forth.
Chromium Compile (v56)
Our new compilation test uses Windows 10 Pro, VS Community 2015.3 with Win10 SDK to compile Chromium’s nightly build. We prepared a test for assembly at the end of March 2017, and in our test we launch a new full compilation. Compiling is a typical example of a multi-threaded workload — some compilation and binding processes are linear, while other parts are multi-threaded.
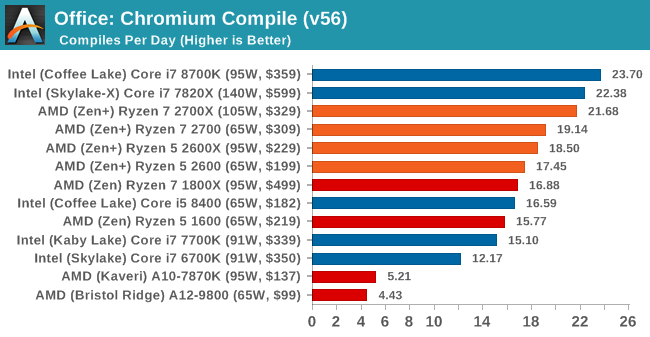
After testing for compilation, we see that the new components of the Ryzen-2000 series have taken a serious step forward compared with the first generation, probably due to the reduction in cache latency and the new precision boost. The performance per dollar for the 8700K and 2700X seems to be about the same.
PCMark8: link
Despite the fact that PCMark was first born in 2008/2009, Futuremark supports PCMark8, and it remains relevant in 2017. On the scale of complex tasks, PCMark is more focused on the low-interest range of professional workloads, which makes it a good indicator of what people consider “office work”. We run the benchmark from the command line in “traditional” mode, that is, C ++ without OpenCL, to remove the graphics card from the equation and focus exclusively on the processor. PCMark8 offers Home, Work, and Creative workloads, with some software tests common and others unique to each test suite.


PCMark 10

Geekbench4


If you live and breathe GeekBench 4, the single-threaded test results will bring Intel to the first place. As for multi-threaded tests, the best components of Intel and AMD go nostril to the nostril, however, it is clear that the quad-core processors of the previous generation are lagging behind.
CPU Legacy Tests
Our outdated tests are benchmarks that were once ahead of their time. Some of them are synthetic standards in industry, and we have data coming in for 10 years. All the data here was re-launched in Windows 10, and we plan to return to several generations of components to see how performance has developed.
3D Particle Movement v1
3DPM is a test written by us that applies basic 3D motion algorithms used in simulations of Brownian motion and tests them for speed. High performance floating point, MHz and IPC will show themselves in a single-stream version, while the multi-threaded version works with threads and loves many cores. This is the original version, written in the style of a typical “non-computer” student encoding an algorithm for a theoretical problem. It comes without any unobvious optimizations that are not yet performed by the compiler, for example, false sharing.


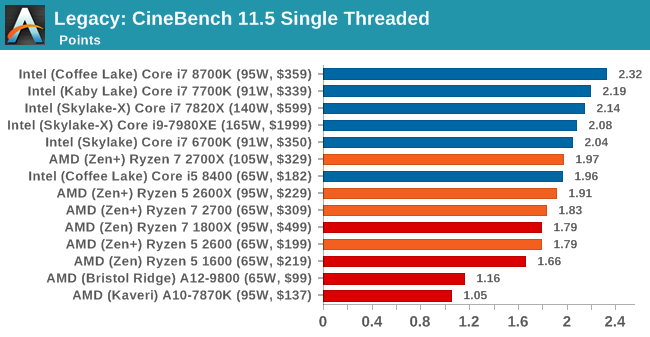
CineBench 11.5 and 10
Cinebench is a well-known performance measurement tool related to MAXON Cinema 4D animation software. Cinebench has been optimized for a decade and focuses only on processor power. This means that if there is a mismatch in bandwidth characteristics, Cinebench will most likely show this mismatch. Perhaps other software does not use all the available tools to load the processor, so the relevance of the test for the real world may be purely academic, but given our large database for Cinebench, it’s difficult to ignore a small five-minute test. In this test, we run the current version 15, as well as the old 11.5 and 10 because of our saved data.



x264 HD 3.0
Similarly, the x264 HD 3.0 package that we use here is also stored for historical regression data. The latest version is 5.0.1, and it encodes a 1080p video into a high-quality x264 file. Version 3.0 performs the same test in the 720p file, and in most cases software performance reaches the limit for high-end processors, but still works well for the middle and lower level. In addition, this version is only a few minutes, while the latter can take more than 90 minutes.


Gaming Performance: Civilization 6
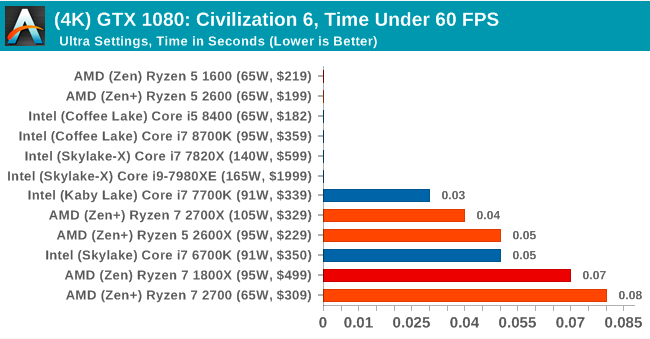
So, the first game in our processor game tests - Civilization 6. Originally launched by Sid Meier and his team, the Civ series of turn-based strategies became a cult classic. Many apologies were made for the sleepless nights of the players, who could not force Gandhi to start a war due to the overflow of whole numbers. To tell the truth, I never played the first version, but I played in every part from the second to the sixth, including the fourth, voiced by the late Leonard Nyom. This is a game that is easy to play, but hard to play well.

Civilization benchmarking has always been something like an oxymoron - for a turn-based strategy game the frame rate is not particularly important, and with the right mood, only 5 frames per second is enough for a good game. However, with Civilization 6, Firaxis has hit hardcore and raised the visualization bar, trying to get you involved in the game. As a result, Civilization may require from the player a new video card and processor, especially if you play with high details under DirectX 12.
Perhaps a more in-demand result will be visible during a late game, when, in older versions, Civilization could take 20 minutes to make the AI players move and transfer control to the person. The new version of Civilization has an integrated "AI Benchmark", although at present it is not yet included in our portfolio of tests for technical reasons that we are trying to solve. Instead, we run a graphical test, which provides an example of average game settings in options.

For resolutions of 1920x1080 and 4K, we run the same settings. Civilization 6 has sliders for MSAA, Performance Utilization and Memory Utilization. The last two relate to the detail and size of textures, respectively, and are ranked from 0 (lowest) to 5 (extreme). We run our Civ6 test in fourth position for performance (ultra) and 0 in memory, and MSAA - 2x.
For reviews where we use 8K and 16K tests (Civ6 allows you to compare extreme resolutions on any monitor) on our GTX 1080, we run 8K tests, the same as 4K, but 16K tests are set to the lowest performance option.
MSI GTX 1080 Gaming 8G Performance
1080p


4K


8K


16K


4K
8K
16K
Shadow of Mordor
The next name in our performance battle is the Middle Earth open-world action RPG: Shadow of Mordor (SoM for short). The game was created by Monolith on the engine LithTech Jupiter EX with many additional add-ons. SoM goes deeper into detail and complexity. The main plot of the game was written by the same writer that wrote Red Dead Redemption, and SoM received the Zero Punctuation's Game of the Year award in 2014.

The 2014 games are very outdated for modern testing, but the SoM has a stable code and a lot of fans, and can still stress the player’s computer. At the time, the SoM was unique, offering dynamic screen resolution, allowing users to use high-resolution settings, which are then reduced to the monitor's capabilities. This form of natural resampling was designed to allow the user to get a more complete picture of what the developers wanted if you have enough powerful graphics hardware but no monitor for 4K resolution.

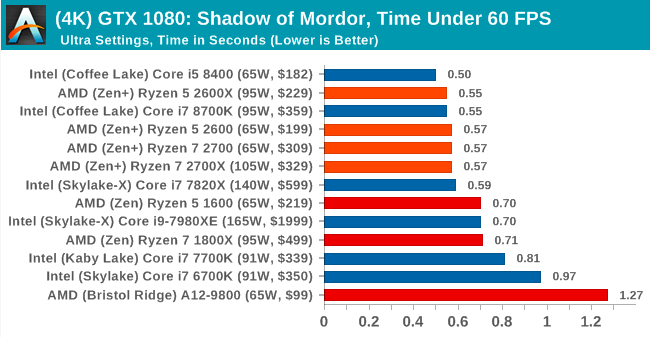
The game has a built-in benchmark, and we launch it using a script that sets up the graphics, starts the benchmark, and parses the results that the test drops to disk. Graphics settings include standard settings such as Graphical Quality, Lighting, Mesh, Motion Blur, Shadow Quality, Textures, Vegetation Range, Depth of Field, Transparency and Tessellation. There are also standard presets.
We run the benchmark on 1080p and native 4K using our 4K monitors in the Ultra settings. Results are averaged over four runs, and we derive the average FPS, the 99th percentile, and the time under analysis.
MSI GTX 1080 Gaming 8G Performance
1080p


4K


4K
Rise of the Tomb Raider
One of the newest games in our game test suite is Rise of the Tomb Raider (RoTR), developed by Crystal Dynamics, a sequel to the popular Tomb Raider, which was loved for its built-in automatic benchmark mode. But don't be fooled: the benchmark mode in RoTR is very different from the past.
Visually, the previous Tomb Raider raised the bar of realism almost to the level of TressFX, and the new RoTR is one step higher in terms of graphics accuracy. This leads to an interesting set of hardware requirements: some sections of the game are usually limited to the graphics processor, while others with more physics at large distances may be limited to the CPU, depending on how the driver distributes the DirectX 12 workload.

Where the old game had one reference scene, the new game has three different scenes with different requirements: geothermal valley (1-Valley), Tomb of the Prophet (2-Prophet) and mountain spine (3rd mountain) - and we are testing all three. These are three scenes that should be taken from the game, but it was noted that scenes like the 2-Prophet shown in the benchmark test may be the most limited elements of this level from the CPU, and the scene shown is only a small part of this level. Because of this, we report the results for each scene on each video card separately.

Graphics settings for RoTR are similar to other games of this type, offering some presets or allowing the user to adjust the texture quality, anisotropic filter levels, shadow quality, soft shadows, occlusion, depth of field, tessellation, reflections, foliage, bloom and features like PureHair, which allows you to use the TressFX library.
As before, we are testing the game at 1920x1080 and 4K resolution using our own 4K displays. At 1080p, we launch the High preset, and in 4K we use the Medium preset, which still causes a significant impact on the frame rate.
It is worth noting that the RoTR test is slightly different from our other benchmarks in that the game saves its graphical settings in the registry rather than the standard INI file, and, unlike the previous game, the built-in benchmark TR cannot be called from the command line. Nevertheless, despite the difficulties, we prepared a script to automatically start the benchmark four times and parse the results. From the obtained data, we derive the average FPS, 99 percentile and time under analysis.
MSI GTX 1080 Gaming 8G Performance
1080p


4K


4K
Rocket league
Fun simple “play-collect” games with great fun. For this reason, I am a big fan of the Katamari franchise - just press the “start” on the controller, and roll forward, picking up items to grow. Extremely simple. In the meantime, we will not get the PC version of Katamari that I can test, we will focus on the Rocket League.
Rocket League uses pick-up-and-play elements, allowing users to play with other people (or bots) to play football without rules in cars. The game was created on the Unreal Engine 3 engine, which is currently outdated, but it allows users to both run the game on low-performance systems and squeeze all the resources from the systems more powerful. Since its release in 2015, more than 5 million copies of the game have been sold, which seems to have become a star in local networks and game shows. Users who train to play become very serious, fighting in teams and leagues with a very small number of settings, and all are on the same level. Rocket League is confidently becoming one of the big names in the world of eSports,

Based on these factors, and also because this game is very nice to run and play, we decided to find the best way to test it. Unfortunately, most of the automatic tests for games will not work here. In addition, thanks to the Unreal 3 engine, the Rocket League does not have a benchmark mode. In this case, we must develop a tight run and record the frame rate.
As already mentioned, the Rocket League does not have a benchmark mode, so we have to perform a series of automatic actions, like a racing game with a fixed number of laps. We use the following approach: using Fraps to record the time taken to display each frame (and the total frame rate), we use an automation tool to start the game with 4v4 bots, while the system must perform a series of actions during the match, for example, switching angles cameras and movement.
It turned out that the described method very accurately displays data on a real match with bots, including movement, collisions, amplifications, or even getting sudden help, no matter how strange it sounds for an automated command set. To maintain consistency, the commands we use are not random, as well as fixed in time. We also conduct tests on the same card (Aquadome, which, as you know, is a heavy card for graphics processors due to water / transparency) and with constant vehicle settings. We start recording immediately after the start of the match and record within 4 minutes of playing time (I think 5 laps DIRT: Rally benchmark), and determine the average frame rate, the 99th percentile and time under.
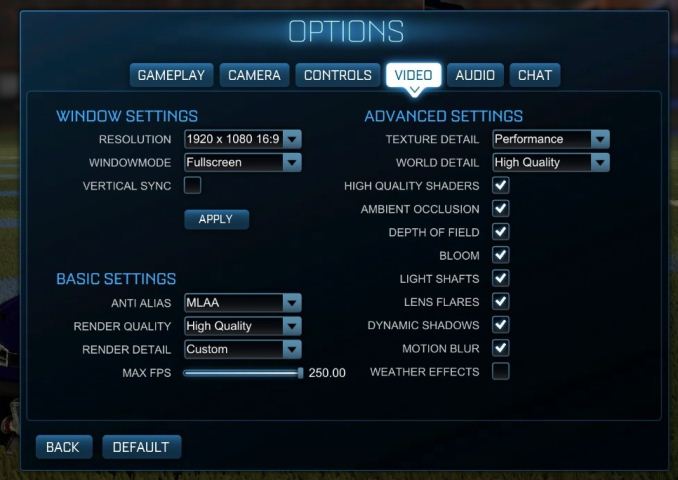
MSI GTX 1080 Gaming 8G Performance
1080p


4K


4K
Grand Theft Auto
The long-awaited iteration of the Grand Theft Auto franchise hit the shelves on April 14, 2015, and AMD and NVIDIA made efforts to optimize the game. There are no graphic presets in GTA, but still the game opens up new possibilities for users and expands the boundaries of modern graphics, loading even the most powerful computers to the limit with the aid of the Rockstar Advanced Game Engine under DirectX 11. Regardless of whether the user flies high in the mountains, where you need to draw the world at long distances, or deal with sorted garbage in the city, when it is bent to the maximum, the game creates stunning visual effects, plus hard work for both the processor and the graphics card.

For testing, we wrote several scripts for the benchmark built into the game. The internal benchmark will include five scenarios: four short panoramic scenes with variable lighting and weather effects, plus a fifth - a sequence of actions lasting about 90 seconds. We decided to use only the last scene, which includes a jet flight, then a car ride through the city through several intersections, and at the end - a collision with a gasoline tank truck that explodes, like the cars around it. This is a great combination of long-distance rendering, followed by short-range rendering. And fortunately, the game gives all the necessary test results.

There are no graphical presets in GTA, but the user can manually adjust the parameters, such as population density and drawing distance using the sliders. Some parameters such as texture / shadow / shaders / water quality switch from low quality to very high. Other customization options include MSAA, soft shadows, post effects, shadow resolution, and advanced remote rendering settings. At the top of the screen there is a convenient option that shows how much video memory the game will consume with these parameters, with obvious consequences if the user requests more video memory than he has on the card (although there is no obvious clue if you have a weak GPU with more video memory, for example, R7 240 4 GB).
As a result, we run tests in the resolution of 1920x1080, using the Very High values in the settings, as well as on 4K using the High value in most of them. The result will be averaged over four runs, average frame rate, 99th percentile, and time-under analysis.
MSI GTX 1080 Gaming 8G Performance
1080p


4К


4К
Conclusions: the burden of competition
Throughout the adventures of AMD and Zen, the pursuit of x86 high-performance computing has two goals: to be competitive, and to be the best. Undoubtedly, the first generation of Ryzen has succeeded in being competitive, and analysts and outlets demonstrate Ryzen processors in the top sales lists, and provide analytical tests where the best AMD chips compete with high-performance Intel desktop components. The goal for the next few years is to capture these easily accessible advantages micro-architecture, and later to get and take advantage of the new process technology. The first stage is the second generation Ryzen, known as the Ryzen-2000 series.
In this review, we showed that AMD has completed its task to further increase net performance by 3%, while our indicators show + 3.1%. By combining this with the increase in frequency obtained from the GlobalFoundries 12nm manufacturing process, and turbo functions like Precision Turbo Boost, which make most of the temperature limits intuitive, AMD generally achieved a 10% intergenerational increase in performance. This does not sound fair enough, since at first glance these are just small improvements in the production process, as well as some reasonable reduction in cache latency. If it were Intel, we would have shouted about a big and sharp breakthrough, but AMD still sits on the Zen design, and the focus is on the next full micro-architectural update in Zen 2.
4K gaming analysis
Nevertheless, everyone wants to know about the test results of the Ryzen 2000 series. We start with games, and first of all with our performance / price charts for high-end 4K gaming. Our results take the R7 1800X as the baseline “100%”, and we show the geometric average for all our gaming tests at 4K.

As can be seen from the results, the new processors of the Ryzen 2000 series improved performance compared with the Ryzen 7 1800X, and even with the Ryzen 5 2600, by 1-3%. Intel processors were 0-4% higher than 1800X, and both Coffee Lake processors were at this peak at + 4%. In tests limited to the graphics processor, there is some benefit from single-core performance, but all modern processors at a reasonable frequency handle quite well.

For the 99th percentile graphs, new AMD processors are either gaining a level or have already surpassed the Ryzen 1000-series. For our Intel tests, the 6700K / 7700K of previous generations is 3% behind, compared to 1800X, while the rest is 4% higher than 1800X. Intel's favorite, Coffee Lake, gets first place, but all processors (with the exception of Bristol Ridge, A12-9800) have increased their results.
Gaming analysis 1080p
A key aspect for many users is the game with a lower resolution: 1920x1080 still dominates the game settings, no matter how enthusiastic we are, we want to see more pixels. Some readers have turned to us with the statement that they are still buying the best possible graphics card, but they work at a frequency of 200+ FPS at low resolutions, just for speed. Low-resolution tests are a bad idea of future processor performance, but what we see today is important to us.

At this resolution, the Ryzen 7 2700X rises by about + 7% compared to the previous generation 1800X, and the new 65W components easily match the 1800X. Users who are looking at the budget Ryzen 5 1600, AMD's bestseller last year, can now pay attention to 2600 (+ 7%) or 2600X for (+ 10% compared to 1600).
Yet, Intel wins here too. Due to the higher IPC speed and clock speed, Coffee Lake processors are 8–10% higher than Ryzen 7 2700X, and range from + 3% to + 25% depending on the model. At the same time, our results show that the Ryzen 7 2700X has risen above the processors of the previous generation of Intel, allowing the 2700X to win by a small margin from Kaby Lake and 5% + from Skylake.

The 99th percentile graph at 1080p looks like a stretched version of the graph of the average frame rate, and in general it is like this: the best 1080p processors work even better on the percentile. Of all the indicators where AMD needs to be competitive, this is the one where the new performance boost works best, but it seems there is a lot to do. Honestly, the results will look better if and when AMD can match Intel in frequency. AMD also has a deficit in the speed of DRAM response in main memory, which we called a factor in previous testing for a 99 percent frame rate. It will be interesting if AMD can provide a higher supported memory frequency faster than Intel, because it is really important here.
Workstation Analysis
In the competition of the main processor series, with Ryzen-1000, AMD delivered eight cores and sixteen threads against Intel Kaby Lake with four cores and eight threads. This time, Intel is offering six cores in Coffee Lake, and now 12 Intel threads resist 16 on AMD. AMD also raised the bar on the turbo mode frequency, but Intel takes the power budget far beyond the limits specified for the processor. So, in the middle range, where there were four streams against twelve, now is six against twelve, but Intel again produces higher frequencies.

In our single-threaded tests, the new Ryzen-2000 series now correspond to the performance of Intel Skylake processors. In the past round of comparisons, Intel still had some advantage, but now they are equal. To AMD's chagrin, Intel is still two generations ahead, thanks to Kaby Lake and Coffee Lake, which show excellent single-core performance due to the added frequency. This means that the Core i5-8400 really outperforms the best AMD with single-threading, and the Core i7-8770K is simply the king of the hill.
In multithreaded workloads, a number of additional variables come into play. This is the nature of the thread in each kernel, which parts of the kernel are dynamic or statically separated, memory management and cache. Here, AMD was aggressive in terms of latency and low-level cache size, but the non-inclusive AMD L3 cache competes here with Intel's write-back cache L3, which is more useful, as well as main memory with lower latency.

What we see here regarding AMD is that only the Ryzen 7 2700X eclipses the old Ryzen 7 1800X, and the 2700 lags behind. In this price range, more streams from the AMD chip give it a healthy advantage over the Coffee Lake i7-8700K, and it also overshadows the eight-core Skylake-X Core i7-7820X in most tests. It is important to note that previous generations of Intel i7-6700K and i7-7700K processors are very far behind competitors, and even the latest AMD Ryzen second-generation processor - Ryzen 5 2600.
If someone had said a few years ago that AMD would develop a second-generation Ryzen processor in 2018, which would eclipse Intel Skylake and Kaby Lake processors, I would have laughed. But here we are talking about the success of AMD. If the user wants to get a chip for multi-threaded workload, the $ 199 Ryzen 5 2600 is the best budget processor on the market today.
In this mid-level price competition, the Ryzen 5 2600 also easily surpasses the Core i5-8400. This is not a battle, but a beating.
General thoughts
A manufacturer loses somewhere, wins somewhere, but customers always win.
When there is competition, each product must make its best leap forward. Carrying this burden is not easy, with existing relationships and high budgets. But each breakthrough causes a competitor to react, and this is a victory for customers. In recent years, Intel has largely been criticized for stagnation — minor updates to the current process, pending the emergence of a new one; With such a long stagnation, everything that is competitive will look attractive on the market. Those inside the industry may say that, although Intel releases iterations on a similar 14nm design each year, expecting 10nm output, AMD made its best move forward with Zen and Ryzen at 14nm, now the next one from Ryzen 2 to GF 12 nm.
This time, reducing the results to simple recommendations will actually be very simple.
Any users who need high-end single-stream performance or high-end 1080p gaming using a mid-range graphics processor can choose Intel's Core i5-8400 as the perfect solution.
For hardcore enthusiasts working on high-end 4K graphics or, like their general calculations, the Ryzen 2000 series looks like the best choice. In each price position, AMD can meet the needs of the player in 4K, and wins in net bandwidth.
AMD also supplies a decent cooler with each processor than Intel has neglected in recent years, which makes the product even more attractive.
Thank you for staying with us. Do you like our articles? Want to see more interesting materials? Support us by placing an order or recommending to friends, 30% discount for Habr users on a unique analogue of the entry-level servers that we invented for you: The whole truth about VPS (KVM) E5-2650 v4 (6 Cores) 10GB DDR4 240GB SSD 1Gbps from $ 20 or how to share the server? (Options are available with RAID1 and RAID10, up to 24 cores and up to 40GB DDR4).
Dell R730xd 2 times cheaper? Only we have 2 x Intel Dodeca-Core Xeon E5-2650v4 128GB DDR4 6x480GB SSD 1Gbps 100 TV from $ 249 in the Netherlands and the USA! Read about How to build an infrastructure building. class c using servers Dell R730xd E5-2650 v4 worth 9000 euros for a penny?