The story of one prettiness or pseudo-three-dimensional rotation
Once upon a time, when computers were already not so big, but clock speeds were still measured in units of megahertz, my inquiring mind accidentally
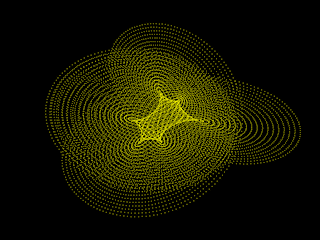
invented some very interesting effect. Take a look at the picture and imagine that this whole set of points rotates in the most incredible way.

Of course, for modern video cards this task is primitive, but in those days at the 3.5 megahertz Spectrum one could only dream of such powers. So forget about GPUs, rotation matrices and unrealistically demanding calculations and try to at least roughly figure out how you can realize such a beautiful thing .
Curious? Then welcome to kat!
For those who like to carefully scrutinize the essence of the issue, I have prepared a more than detailed description (with slides and source code on js + html5 canvas). In this article, I will convey the exclusively basic essence of the algorithm, the whole charm of which lies in its simplicity.
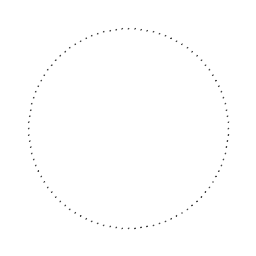
To facilitate understanding, I propose to attach to something specific, for example, to a circle consisting of 100 points: The

coordinates of each point are entered in the arrays X [100] and Y [100]:
Imagine that we have a drawPoints () function that will draw points from these same arrays on the screen (in the framework of this article I will not give its implementation so as not to be distracted from the topic).
To achieve complete Zen, only one thing is missing: the question "What will happen if ...?" So I decided then to experiment: what will happen if at each step of the drawing we move the values in one of the array according to the principle X [i + 1] = X [i] (and, accordingly, X [0] = X [_last]). The function that will perform such a shift is called shiftX () . And, of course, let's have aneternal buzz an endless cycle:
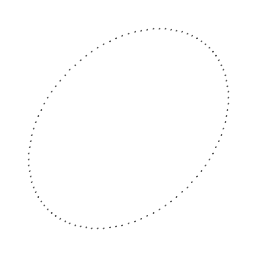
As a result, we get the very illusion of rotation. So, for example, after 5 frames the picture will be like this:

Here, in fact, that's all. Further, it’s a matter of technology:you can create more “rings”, distort with the formulas for calculating points and with their number, and so on and so forth.
For a long time I kept this algorithm in myself and blew my cheeks from the realization that I invented it myself. Now I decided to share it with you and I will be very happy if for someone this topic will be useful. Well, if someone else shares his own formulas of beautiful graphs, I will be immensely grateful.
Thanks for attention!
PS: After some time, I learned about the existence of cyclic arrays, which allowed me to get rid of unnecessary constant data movement.
PPS: It practically doesn’t matter which coordinate to “move” - X or Y, it was tested on my own experience.
PPPS:A characteristic feature of this effect is that the direction of rotation cannot be determined due to the lack of depth. Particularly enlightened ones are able to “rotate” charts in the direction in which they wish.
invented some very interesting effect. Take a look at the picture and imagine that this whole set of points rotates in the most incredible way.

Of course, for modern video cards this task is primitive, but in those days at the 3.5 megahertz Spectrum one could only dream of such powers. So forget about GPUs, rotation matrices and unrealistically demanding calculations and try to at least roughly figure out how you can realize such a beautiful thing .
Curious? Then welcome to kat!
Intro
For those who like to carefully scrutinize the essence of the issue, I have prepared a more than detailed description (with slides and source code on js + html5 canvas). In this article, I will convey the exclusively basic essence of the algorithm, the whole charm of which lies in its simplicity.
He said "let's go" and washed down with water
To facilitate understanding, I propose to attach to something specific, for example, to a circle consisting of 100 points: The

coordinates of each point are entered in the arrays X [100] and Y [100]:
X[i] = Xo + R*cos(α);

Y[i] = Yo + R*sin(α);Imagine that we have a drawPoints () function that will draw points from these same arrays on the screen (in the framework of this article I will not give its implementation so as not to be distracted from the topic).
Everything ingenious is simple
To achieve complete Zen, only one thing is missing: the question "What will happen if ...?" So I decided then to experiment: what will happen if at each step of the drawing we move the values in one of the array according to the principle X [i + 1] = X [i] (and, accordingly, X [0] = X [_last]). The function that will perform such a shift is called shiftX () . And, of course, let's have an
while (true)

{

  shiftX();

  drawPoints();

}
As a result, we get the very illusion of rotation. So, for example, after 5 frames the picture will be like this:

Here, in fact, that's all. Further, it’s a matter of technology:
Epilogue
For a long time I kept this algorithm in myself and blew my cheeks from the realization that I invented it myself. Now I decided to share it with you and I will be very happy if for someone this topic will be useful. Well, if someone else shares his own formulas of beautiful graphs, I will be immensely grateful.
Thanks for attention!
PS: After some time, I learned about the existence of cyclic arrays, which allowed me to get rid of unnecessary constant data movement.
PPS: It practically doesn’t matter which coordinate to “move” - X or Y, it was tested on my own experience.
PPPS:A characteristic feature of this effect is that the direction of rotation cannot be determined due to the lack of depth. Particularly enlightened ones are able to “rotate” charts in the direction in which they wish.
