May 11, 2010 at 17:53
Processor Cache Effects Gallery
- Transfer
 Almost all developers know that the processor cache is such a small but fast memory that stores data from recently visited memory areas - the definition is short and fairly accurate. Nevertheless, knowledge of the “boring” details regarding the cache operating mechanisms is necessary for understanding the factors affecting the code performance.
 In this article, we will look at a series of examples illustrating various features of the operation of caches and their impact on performance. Examples will be in C #, the choice of language and platform does not affect the performance assessment and the final conclusions. Naturally, within reasonable limits, if you select a language in which reading a value from an array is equivalent to accessing a hash table, you will not get any results suitable for interpretation. Italics are the notes of the translator.
- - - habracut - - -
Example 1: memory access and performance
How much do you think the second cycle is faster than the first?
int[] arr = new int[64 * 1024 * 1024];


// первый

for (int i = 0; i < arr.Length; i++) arr[i] *= 3;


// второй

for (int i = 0; i < arr.Length; i += 16) arr[i] *= 3;
The first cycle multiplies all array values by 3, the second cycle only every sixteenth value. The second cycle does only 6% of the work of the first cycle, but on modern machines both cycles are executed in about the same time: 80 ms and 78 ms, respectively (on my machine).
The answer is simple - access to memory. The speed of these cycles is primarily determined by the speed of the memory subsystem, and not the speed of integer multiplication. As we will see in the following example, the number of memory accesses is the same in the first and second cases.
Example 2: the effect of cache lines
Digging deeper - try other step values, not only 1 and 16:
for (int i = 0; i < arr.Length; i += K /* шаг */ ) arr[i] *= 3;Here is the runtime of this cycle for various values of step K:
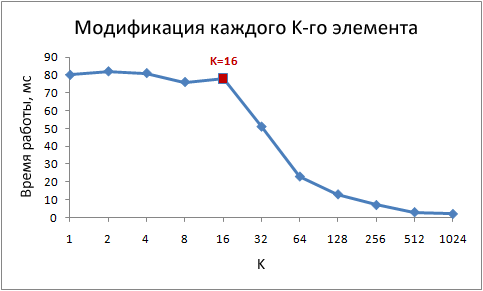
Note that for steps of 1 to 16, the runtime is practically unchanged. But with values greater than 16, the operating time decreases by about half every time we double the step. This does not mean that the cycle somehow magically starts to work faster, just the number of iterations at the same time also decreases. The key point is the same runtime with step values from 1 to 16.
The reason for this is that modern processors do not access memory byte, but in small blocks called cache lines. Typically, the string size is 64 bytes. When you read a value from memory, at least one cache line gets into the cache. Subsequent access to a value from this line is very fast.
Due to the fact that 16 int values occupy 64 bytes, loops with steps from 1 to 16 access the same number of cache lines, more precisely, to all lines of the array cache. At step 32, access occurs to every second line, at step 64, to every fourth.
Understanding this is very important for some optimization methods. The number of calls to it depends on the location of the data in the memory. For example, due to misaligned data, two memory accesses may be required instead of one. As we found out above, the speed of work will be two times lower.
Example 3: sizes of first and second level caches (L1 and L2)
Modern processors, as a rule, have two or three levels of caches, usually they are called L1, L2 and L3. In order to find out the sizes of caches of various levels, you can use the CoreInfo utility or the Windows API function GetLogicalProcessorInfo . Both methods also provide information about the size of the cache line for each level.
On my machine, CoreInfo reports on 32KB L1 data caches, 32KB L1 instruction caches, and 4MB L2 data caches. Each core has its own personal L1 caches, L2 caches common to each pair of cores:
Logical Processor to Cache Map:
* --- Data Cache 0, Level 1, 32 KB, Assoc 8, LineSize 64
* --- Instruction Cache 0, Level 1, 32 KB, Assoc 8, LineSize 64
- * - Data Cache 1, Level 1, 32 KB, Assoc 8, LineSize 64
- * - Instruction Cache 1, Level 1, 32 KB, Assoc 8, LineSize 64
** - Unified Cache 0, Level 2, 4 MB, Assoc 16, LineSize 64
- * - Data Cache 2, Level 1, 32 KB, Assoc 8, LineSize 64
- * - Instruction Cache 2, Level 1, 32 KB, Assoc 8, LineSize 64
--- * Data Cache 3, Level 1, 32 KB, Assoc 8, LineSize 64
--- * Instruction Cache 3, Level 1, 32 KB, Assoc 8, LineSize 64
- ** Unified Cache 1, Level 2, 4 MB, Assoc 16, LineSize 64
Check this information experimentally. To do this, let's go through our array incrementing every 16th value - an easy way to change the data in each cache line. Upon reaching the end, we return to the beginning. Checking the various sizes of the array, we should see a drop in performance when the array ceases to fit in caches of different levels.
The code is:
int steps = 64 * 1024 * 1024; // количество итераций

int lengthMod = arr.Length - 1; // размер массива -- степень двойки


for (int i = 0; i < steps; i++)

{

  // x & lengthMod = x % arr.Length, ибо степени двойки

  arr[(i * 16) & lengthMod]++;

}
Test results:

On my machine, performance drops after 32 KB and 4 MB are noticeable - this is the size of L1 and L2 caches.
Example 4: concurrency of instructions
Now let's take a look at something else. In your opinion, which of these two cycles will execute faster?
int steps = 256 * 1024 * 1024;

int[] a = new int[2];


// первый

for (int i = 0; i < steps; i++) { a[0]++; a[0]++; }


// второй

for (int i = 0; i < steps; i++) { a[0]++; a[1]++; }
It turns out that the second cycle runs almost twice as fast, at least on all the machines I tested. Why? Because the commands inside the loops have different data dependencies. The commands of the first have the following chain of dependencies:

In the second cycle, the dependencies are as follows: The

functional parts of modern processors are capable of performing a certain number of certain operations at the same time, usually not a very large number. For example, parallel access to data from the L1 cache at two addresses is possible, it is also possible to simultaneously execute two simple arithmetic instructions. In the first cycle, the processor cannot use these features, but in the second.
Example 5: cache associativity
One of the key questions that need to be answered when designing a cache is whether data from a specific memory area can be stored in any cache cells or only in some of them. Three possible solutions:
- Direct mapping cache , data of each cache line in RAM is stored in only one predetermined cache cell. The simplest way to compute a mapping is: memory_line_index% cache_cells. Two lines mapped to the same cell cannot be in the cache at the same time.
- N-input partially associative cache , each line can be stored in N different cache cells. For example, in a 16-input cache, a line can be stored in one of the 16 cells that make up the group. Typically, rows with equal low-order bits of indices separate the same group.
- Fully associative cache , any line can be stored in any cache cell. The solution is equivalent to a hash table in its behavior.
For example, on my machine, the 4 MB L2 cache is a 16-input partially associative cache. All RAM is divided into sets of lines by the least significant bits of their indices, lines from each set compete for one group of 16 L2 cache cells.
Since the L2 cache has 65 536 cells (4 * 2 20/ 64) and each group consists of 16 cells, in total we have 4,096 groups. Thus, the lower 12 bits of the row index determine which group this row belongs to (2 12 = 4 096). As a result, lines with addresses that are multiples of 262 144 (4 096 * 64) share the same group of 16 cells and compete for a place in it.
For associativity effects to manifest themselves, we need to constantly access a large number of lines from one group, for example, using the following code:
public static long UpdateEveryKthByte(byte[] arr, int K)

{

  const int rep = 1024 * 1024; // количество итераций


  Stopwatch sw = Stopwatch.StartNew();


  int p = 0;

  for (int i = 0; i < rep; i++)

  {

    arr[p]++;


    p += K; if (p >= arr.Length) p = 0;

  }


  sw.Stop();

  return sw.ElapsedMilliseconds;

}
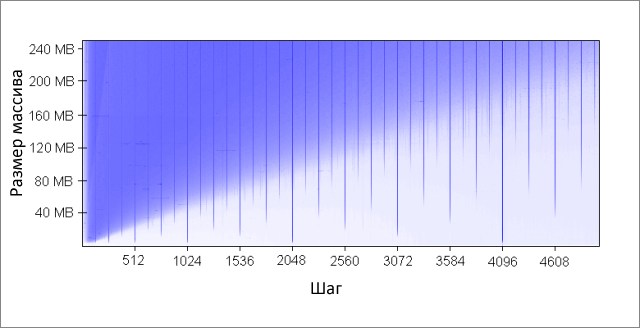
The method increments every Kth element of the array. Upon reaching the end, we start again. After a rather large number of iterations (2 20 ), we stop. I made runs for different sizes of the array and values of step K. Results (blue - long run time, white - small): The

blue areas correspond to those cases when the cache is unable to accommodate all the required data at the same time as the data is constantly changing . A bright blue color indicates an operating time of about 80 ms, almost white - 10 ms.
Let's deal with the blue areas:
- Why do vertical lines appear? Vertical lines correspond to step values at which too many rows (more than 16) from one group are accessed. For such values, the 16-input cache of my machine cannot accommodate all the necessary data.
Some of the bad step values are powers of two: 256 and 512. For example, consider step 512 and an array of 8 MB. In this step, there are 32 in the array portion (8 * 2 20 / 262,144), which are fighting each other for the cells in groups 512 cache (262,144 / 512). Section 32, and there are only 16 cells in the cache for each group, so there is not enough space for everyone.
Other step values that are not powers of two are simply unlucky, which causes a large number of accesses to the same cache groups, and also leads to the appearance of vertical blue lines in the figure. At this point, lovers of number theory are invited to think. - Why do vertical lines break off at the 4 MB border? With an array size of 4 MB or less, the 16-input cache behaves in the same way as it is fully associative, that is, it can accommodate all the data in the array without conflict. There are no more than 16 areas fighting for one cache group (262 144 * 16 = 4 * 2 20 = 4 MB).
- Why is there a large blue triangle at the top left? Because with a small step and a large array, the cache is not able to fit all the necessary data. The degree of cache associativity plays a secondary role here, the limitation is related to the size of the L2 cache.
For example, with an array size of 16 MB and a step of 128, we access every 128th byte, thus modifying every second line of the array cache. To save every second line in the cache, its size is 8 MB, but on my machine there is only 4 MB.
Even if the cache were completely associative, this would not allow 8 MB of data to be stored in it.Note that in the already considered example with a step of 512 and an array size of 8 MB, we need only 1 MB of cache to save all the necessary data, but this cannot be done due to insufficient cache associativity. - Why is the left side of the triangle gradually gaining its intensity? The maximum intensity falls on a step value of 64 bytes, which is equal to the size of the cache line. As we saw in the first and second examples, sequential access to the same line costs almost nothing. Say, with a step of 16 bytes, we have four memory accesses for the price of one.
Since the number of iterations is equal in our test for any step value, a cheaper step results in shorter run time.
Cache associativity is an interesting thing that can manifest itself under certain conditions. Unlike the other problems discussed in this article, it is not so serious. Definitely, this is not something that requires constant attention when writing programs.
Example 6: false cache split
On multi-core machines, you may run into another problem - cache matching. Processor cores have partially or completely separate caches. On my machine, L1 caches are separate (as usual), there are also two L2 caches common to each core pair. Details may vary, but in general, modern multi-core processors have multi-level hierarchical caches. Moreover, the fastest, but also the smallest caches belong to individual kernels.
When one of the kernels modifies the value in its cache, the other kernels can no longer use the old value. The value in the caches of other cores must be updated. Moreover, the entire cache line must be updated completely , since the caches operate on line level data.
We demonstrate this problem with the following code:
private static int[] s_counter = new int[1024];


private void UpdateCounter(int position)

{

  for (int j = 0; j < 100000000; j++)

  {

    s_counter[position] = s_counter[position] + 3;

  }

}
If on my four-core machine I call this method with parameters 0, 1, 2, 3 simultaneously from four threads, then the operation time will be 4.3 seconds . But if I call a method with parameters 16, 32, 48, 64, then the run time will be only 0.28 seconds .
Why? In the first case, all four values processed by threads at each moment in time are most likely to fall into one cache line. Each time one core increases the next value, it marks cache cells containing this value in other kernels as invalid. After this operation, all other kernels will have to cache the line again. This makes the caching mechanism inoperative, killing performance.
Example 7: iron complexity
Even now, when the principles of working caches are not a secret for you, the iron will still give you surprises. Processors differ from each other by optimization methods, heuristics and other subtleties of implementation.
The L1 cache of some processors can access two cells in parallel if they belong to different groups, but if they belong to one, only sequentially. As far as I know, some may even provide parallel access to different quarters of the same cell.
Processors can surprise you with tricky optimizations. For example, the code from the previous example about the split cache does not work on my home computer as I thought - in the simplest cases, the processor can optimize the work and reduce the negative effects. If the code is slightly modified, everything falls into place.
Here is another example of strange iron quirks:
private static int A, B, C, D, E, F, G;


private static void Weirdness()

{

  for (int i = 0; i < 200000000; i++)

  {

    <какой-то код>

  }

}
If you substitute three different options for <some code>, you can get the following results:
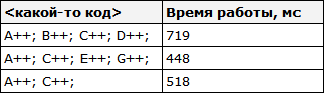
Incrementing the fields A, B, C, D takes longer than incrementing the fields A, C, E, G. Even stranger, incrementing the fields A and C takes longer than fields A, C and E, G. I don’t know exactly what the reasons for this are, but maybe they are connected with memory banks ( yes, with ordinary three-liter savings banks, and not what you thought ). Having thoughts on this subject, please speak in the comments.
I do not observe the above on the machine, however, sometimes there are abnormally bad results - most likely, the task scheduler makes its own “corrections”.
The following lesson can be learned from this example: it is very difficult to completely predict the behavior of iron. Yes, you can predict a lot, but you need to constantly confirm your predictions through measurements and testing.
Conclusion
I hope that all of the above helped you understand the design of processor caches. Now you can use the acquired knowledge in practice to optimize your code.
* Source code was highlighted with Source Code Highlighter.