Debugging Hadoop Applications
No matter how much they say that the logs are able to completely replace debugging, alas and ah - this is not entirely true, and sometimes not at all. Indeed, sometimes it doesn’t even occur to you that it was necessary to write this particular variable to the log - at the same time, in debug mode, you can often view several data structures at once; you can, in the end, stumble upon a problem area absolutely by accident. Therefore, sometimes debugging is inevitable, and often it can save a lot of time.
Debugging a single-threaded Java application is simple. Debugging a multi-threaded Java application is a little more complicated, but still easy. Debug a multiprocess Java application? With processes running on different machines? This is definitely harder. This is why all Hadoop tutorials recommend that you consult debugging.only and exclusively when other options (read: logging) are exhausted and do not help. The situation is often complicated by the fact that on large clusters you may not have access to specific map / reduce nodes (I came across this option). But let's solve the problem in parts. So…
The easiest option of all. Local installation of Hadoop - everything runs on the same machine, and moreover, in the same process, but in different threads. Debugging is equivalent to debugging a regular multi-threaded Java application - what could be more trivial?
How to achieve this? We go to the directory where we have deployed our local Hadoop (I believe that you can do this or can read the appropriate instructions and can handle it now).
Our task is to add another JVM option, somewhere around 282-283 lines (depending on the version, the number may change), immediately after the script has finished generating
What did we say with this spell? We said that we want to start a Java machine with support for a remote debugger, which will have to connect to port 1044, and until it connects, the program will be suspended (immediately after start). It's simple, right? It remains to go to Eclipse (or any other Java IDE) and add a remote debugging session there. Well, for example, like this:
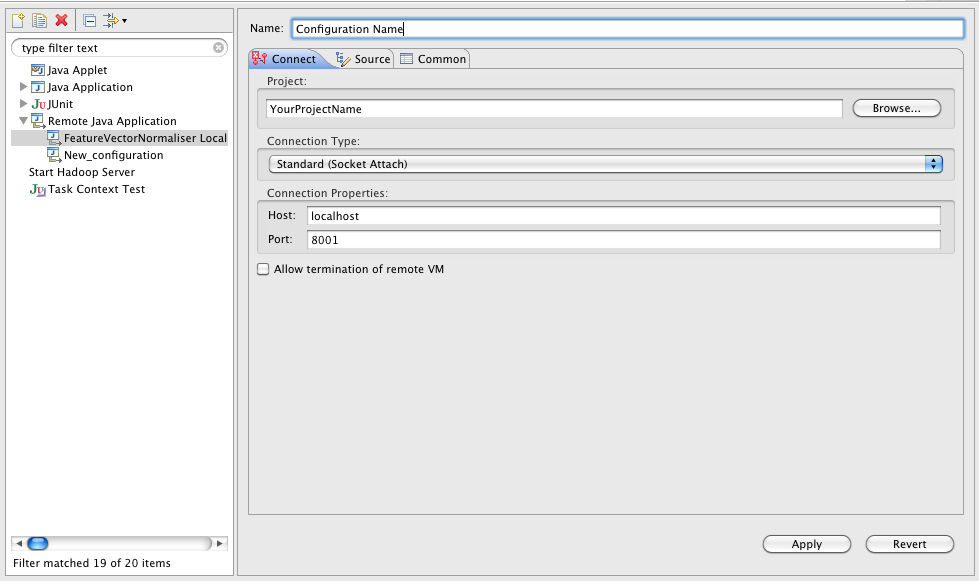
If you run debugging not on the local machine, but on some server (which is quite normal and I usually do this - I need to load my laptop with such things when there are special dev servers with wild amount of memory and many processors?), then just change
Khadup starts and does nothing, the JVM reports that it is waiting for a connection:
That's it, now connect with Eclipse to the debugging session - and wait until your breakpoint “pops up”. Debugging map / reduce classes is no different (under this scenario) than debugging gateway code.
In pseudo-distributed mode, Hadoop is closer to the state in which it will work in production (and we, accordingly, are closer to the headache that we will have when something does break). The difference is that map / reduce tasks are performed in separate processes, HDFS is already “real” (and not simulated by the local file system - although it is located on only one node), and debugging is more difficult. That is, you can, of course, apply the approach described above to the start of new processes, but I did not try to do this and there is a suspicion that without modifying the code of Hadoop itself it simply won’t work.
There are two main approaches to solving the debugging task in this mode - one of them is using a local task tracker, and the other is
So, IsolationRunner is a helper class that allows you to accurately simulate the process of performing a specific task (Task), in fact, repeating its execution. In order to use it, you need to do a few gestures:
As I noted above, this method will be guaranteed to work in pseudo-distributed mode, but it will also work fine if you have access to map / reduce nodes (this is almost an ideal situation). But there is also a third scenario, the most difficult ...
You are on a real, “combat” cluster, in which there are a thousand cars, and no one will give you the right to log in to one of them, except for gateways specially designed for this - gateway machines (hence the name gateway code, because it runs on them ) All in an adult way, although you are still working on a test “small” data set of half a terabyte, but the headache with debugging is already rising to its full height. Here, perhaps, it will be appropriate to repeat the advice about logging - if you are not already doing it, then do it. At a minimum, this will allow you to partially localize the problem, and you may be able to use one of the two methods listed above to identify and solve it. There is no easy debugging method that will give predictable results. Strictly speaking, all you can do is get your task to run locally,
All you need to do to execute the task locally is set
So, here is some information for you to think about how difficult it can be to debug map / reduce applications. Without denying all of the above, I would recommend the following strategy:
Good debugging!
PS is written based on my old post and weekly debugging of hadoop-application, Java-library and JNI, which supports it. In addition, greetings to Umputun and Bobuk, who, with their 179th issue of RT and the story about map / reduce, reminded me that there are things (although there are not many) that I understand and can tell about them ;-)
Debugging a single-threaded Java application is simple. Debugging a multi-threaded Java application is a little more complicated, but still easy. Debug a multiprocess Java application? With processes running on different machines? This is definitely harder. This is why all Hadoop tutorials recommend that you consult debugging.only and exclusively when other options (read: logging) are exhausted and do not help. The situation is often complicated by the fact that on large clusters you may not have access to specific map / reduce nodes (I came across this option). But let's solve the problem in parts. So…
Scenario One: Local Hadoop
The easiest option of all. Local installation of Hadoop - everything runs on the same machine, and moreover, in the same process, but in different threads. Debugging is equivalent to debugging a regular multi-threaded Java application - what could be more trivial?
How to achieve this? We go to the directory where we have deployed our local Hadoop (I believe that you can do this or can read the appropriate instructions and can handle it now).
    $ cd ~ / dev / hadoop
    $ cp bin / hadoop bin / hdebug
    $ vim bin / hdebug
Our task is to add another JVM option, somewhere around 282-283 lines (depending on the version, the number may change), immediately after the script has finished generating
$HADOOP_OPTS:HADOOP_OPTS = "$ HADOOP_OPTS -Xdebug -Xrunjdwp: transport = dt_socket, address = 1044, server = y, suspend = y"
What did we say with this spell? We said that we want to start a Java machine with support for a remote debugger, which will have to connect to port 1044, and until it connects, the program will be suspended (immediately after start). It's simple, right? It remains to go to Eclipse (or any other Java IDE) and add a remote debugging session there. Well, for example, like this:
If you run debugging not on the local machine, but on some server (which is quite normal and I usually do this - I need to load my laptop with such things when there are special dev servers with wild amount of memory and many processors?), then just change
localhostto the required host. Next, put a breakpoint in the program code (for starters, in the main body, the so-called gateway code), and start Hadoop:bin / hadoop jar myApplication.jar com.company.project.Application param1 param2 param3
Khadup starts and does nothing, the JVM reports that it is waiting for a connection:
Listening for transport dt_socket at address: 1044
That's it, now connect with Eclipse to the debugging session - and wait until your breakpoint “pops up”. Debugging map / reduce classes is no different (under this scenario) than debugging gateway code.
Scenario Two: pseudo-distributed mode
In pseudo-distributed mode, Hadoop is closer to the state in which it will work in production (and we, accordingly, are closer to the headache that we will have when something does break). The difference is that map / reduce tasks are performed in separate processes, HDFS is already “real” (and not simulated by the local file system - although it is located on only one node), and debugging is more difficult. That is, you can, of course, apply the approach described above to the start of new processes, but I did not try to do this and there is a suspicion that without modifying the code of Hadoop itself it simply won’t work.
There are two main approaches to solving the debugging task in this mode - one of them is using a local task tracker, and the other is
IsolationRunner'a. We must say right away that the first option can only give very approximate results, since the nodes will be different and all the code will be executed in one process (as in the previous version). The second option gives a very accurate approximation of the real work, but alas, it is impossible if you do not have access to specific Task Nodes (which is very very likely in case of large production clusters). So, IsolationRunner is a helper class that allows you to accurately simulate the process of performing a specific task (Task), in fact, repeating its execution. In order to use it, you need to do a few gestures:
- Set the value
keep.failed.tasks.filestotruein the job configuration. Depending on how you formulate your task, this can be done either by editing the XML file or in the program text, but, in any case, it is not difficult. This instructs the task tracker that if the task was completed with an error, it is not necessary to delete its configuration and data. - Further, the official guide recommends that you go to the node on which the task was completed with an error. In our case, it is still our local (or not very local, but still the only one) host; the directory where taskTracker is located depends on the configuration, but in the "default" mode this will most likely be
hadoop/bin. Insolently copy the example from the manual:$ cd
/ taskTracker / $ {taskid} / work $ bin / hadoop org.apache.hadoop.mapred.IsolationRunner ../job.xml
In our case, we can and should replacebin/hadoopwith thebin/hdebugone we created above (well, it’s clear that the relative path will be somehow different ;-)). As a result, we debug the fallen task, working with exactly the data that led to its fall. Simple, beautiful, comfortable. - We are connected by a debugger, we act, we find an error, we rejoice
As I noted above, this method will be guaranteed to work in pseudo-distributed mode, but it will also work fine if you have access to map / reduce nodes (this is almost an ideal situation). But there is also a third scenario, the most difficult ...
Scenario Three: production cluster
You are on a real, “combat” cluster, in which there are a thousand cars, and no one will give you the right to log in to one of them, except for gateways specially designed for this - gateway machines (hence the name gateway code, because it runs on them ) All in an adult way, although you are still working on a test “small” data set of half a terabyte, but the headache with debugging is already rising to its full height. Here, perhaps, it will be appropriate to repeat the advice about logging - if you are not already doing it, then do it. At a minimum, this will allow you to partially localize the problem, and you may be able to use one of the two methods listed above to identify and solve it. There is no easy debugging method that will give predictable results. Strictly speaking, all you can do is get your task to run locally,
All you need to do to execute the task locally is set
mapred.job.trackerto a value local(in the task configuration). Now, with some luck, you can connect with a debugger (most likely, not with your favorite Eclipse, but with something console running on the same network - or by throwing an SSH tunnel, if available) and execute your code on the gateway. From the pros - you work with real data on real HDFS. Of the minuses - if the error is floating and reproduces, God forbid, only on one or two nodes of the cluster, a line with two you will find it. The bottom line is the best you can achieve without talking to the cluster support team and requesting temporary access to a specific node.Conclusion
So, here is some information for you to think about how difficult it can be to debug map / reduce applications. Without denying all of the above, I would recommend the following strategy:
- Arrange debugging messages throughout the task code - first rarely (approximately), then more often when it becomes clear that the task falls, say, between 100 and 350 lines
- Try to reproduce the problem on your local Hadoup - very often it will succeed, and you can figure out what’s the matter
- Check if you have access to specific map / reduce nodes. Find out whether it is realistic to receive it (at least temporarily and not for everything)
- Use gaze debugging! Seriously, this works - it’s only better if the look is not yours: often an outsider can see the bug in three seconds, when you have already “looked closely” at it and do not notice it point-blank
- If all else fails, use different combinations of the techniques described above. At least one of them will work without fail.
Good debugging!
PS is written based on my old post and weekly debugging of hadoop-application, Java-library and JNI, which supports it. In addition, greetings to Umputun and Bobuk, who, with their 179th issue of RT and the story about map / reduce, reminded me that there are things (although there are not many) that I understand and can tell about them ;-)